
10 Best Customer Journey Analytics Tools: Compared in 2026
A practical comparison of 10 customer journey analytics tools across cross-channel, product, and digital experience use cases, who they're built for, and what you'll actually pay.
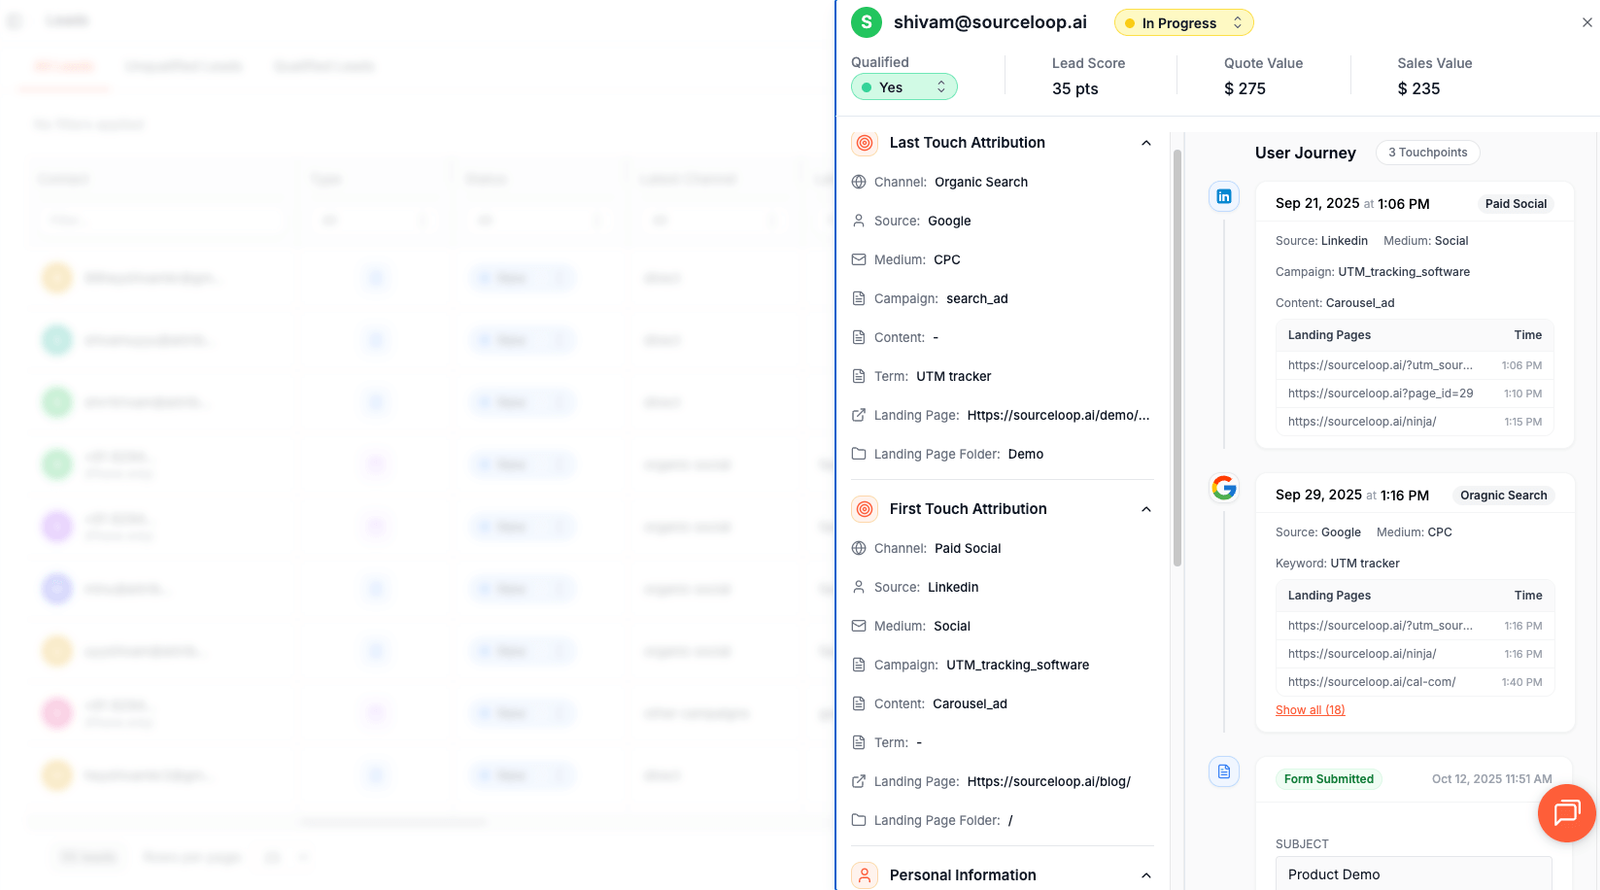
Table of contents
Customer journey analytics is the discipline of stitching together every touchpoint a customer has with your brand, from the first ad impression through the last in-app click, into one coherent picture.
The category overlaps with attribution, product analytics, and digital experience analytics, which is why "customer journey" can mean four different things depending on who's asking.
Below are 10 tools that each handle a distinct slice of the journey analytics problem in 2026.
Quick Comparison of Best Customer Journey Analytics Software
| Tool | Best for | Starts at |
|---|---|---|
 SourceLoop SourceLoop |
Marketing journey: ad click to revenue | $49/mo |
 Adobe Customer Journey Analytics Adobe Customer Journey Analytics |
Enterprise cross-channel analytics | Custom |
 Mixpanel Mixpanel |
Product analytics for SaaS | Free / $24/mo |
 Amplitude Amplitude |
Product-led growth journey analytics | Free / $49/mo |
 Heap Heap |
Autocapture journey analytics | Free / Custom |
 Contentsquare Contentsquare |
UX-focused journey + session replay | Custom |
 Quantum Metric Quantum Metric |
Real-time journey + business impact | Custom |
 FullStory FullStory |
Digital experience + session replay | Custom |
 Segment Segment |
CDP foundation for journey analytics | Free / Custom |
 Woopra Woopra |
Real-time individual customer journey | Free / $999/mo |
1. SourceLoop
Best for: Marketing and growth teams that need the journey from first ad click through booked meeting to closed revenue, stitched across devices and domains
"Customer journey analytics" is three different products wearing one label.
Adobe CJA stitches enterprise data across web, app, call centre and in-store. Mixpanel, Amplitude and Heap analyse what people do inside your product. Contentsquare, Quantum Metric and FullStory replay individual sessions.
SourceLoop covers the acquisition journey, from the first anonymous click to the money.
That gap gets described wrongly a lot. Mixpanel and Amplitude do track anonymous visitors, using a device ID that merges into the user profile at signup.
What they do not do is marketing attribution.
No click ID parsing, no channel classification, no ad spend ingestion, no multi-touch models, no conversion sync back to the ad platforms. You can hand-instrument UTMs as event properties and still have no cost figure to divide by.
Why SourceLoop works well for marketing journey analytics
1. A timeline per person, not an event stream to reassemble
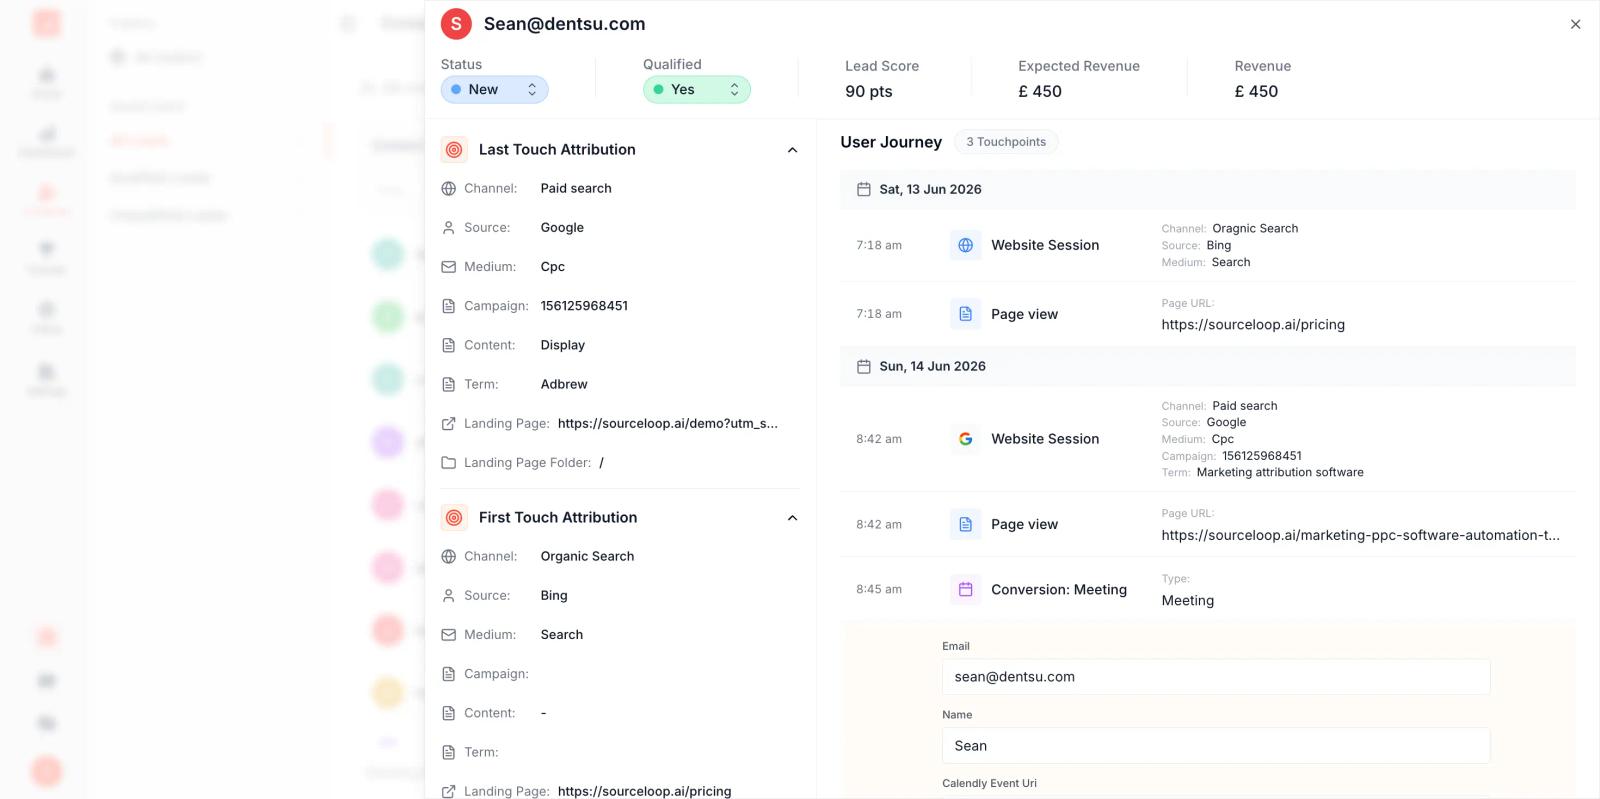
Open any contact and you get every session in order: how they arrived (channel, source, campaign, click ID), which pages they read, the gap between visits, and which session converted.
There is no event taxonomy to design first. The script records sessions and pageviews from install, so the journey exists for people who arrived before you decided what to measure.
2. Path sequences, which is journey analytics in the literal sense
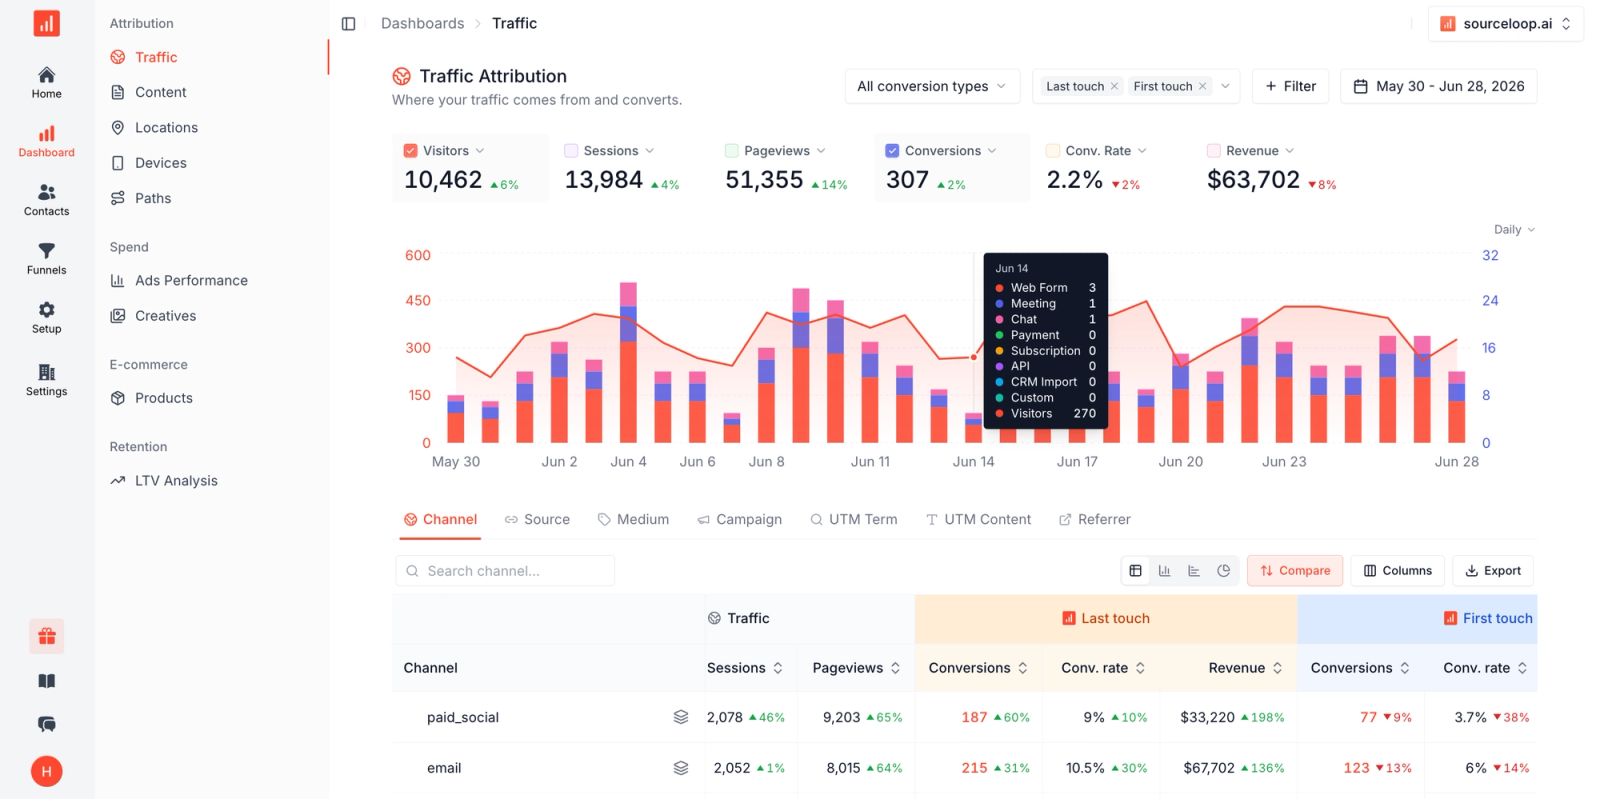
The Paths view shows the sequences that actually end in conversion, with visitors, conversions and revenue against each. 1 social → 2 paid_search. 1 email → 2 paid_social → 3 paid_social.
A collapse repeat touches toggle changes the question. On, you see the structural path. Off, you see frequency: how many touches a channel needs before it converts, which is a budgeting decision.
Seven attribution models run on that same journey, switched from a dropdown.
3. Journeys before anyone identifies themselves
In a considered purchase, most of next quarter's pipeline is anonymous today. The Visitors view lists every un-converted browser with its own first and last touch attribution, session count, engagement depth, geography, device and full path.
When they identify later, identity stitching merges that history into the contact, so week-one laptop research and a week-fourteen phone form-fill become one journey.
4. The journey survives the hops that usually break it
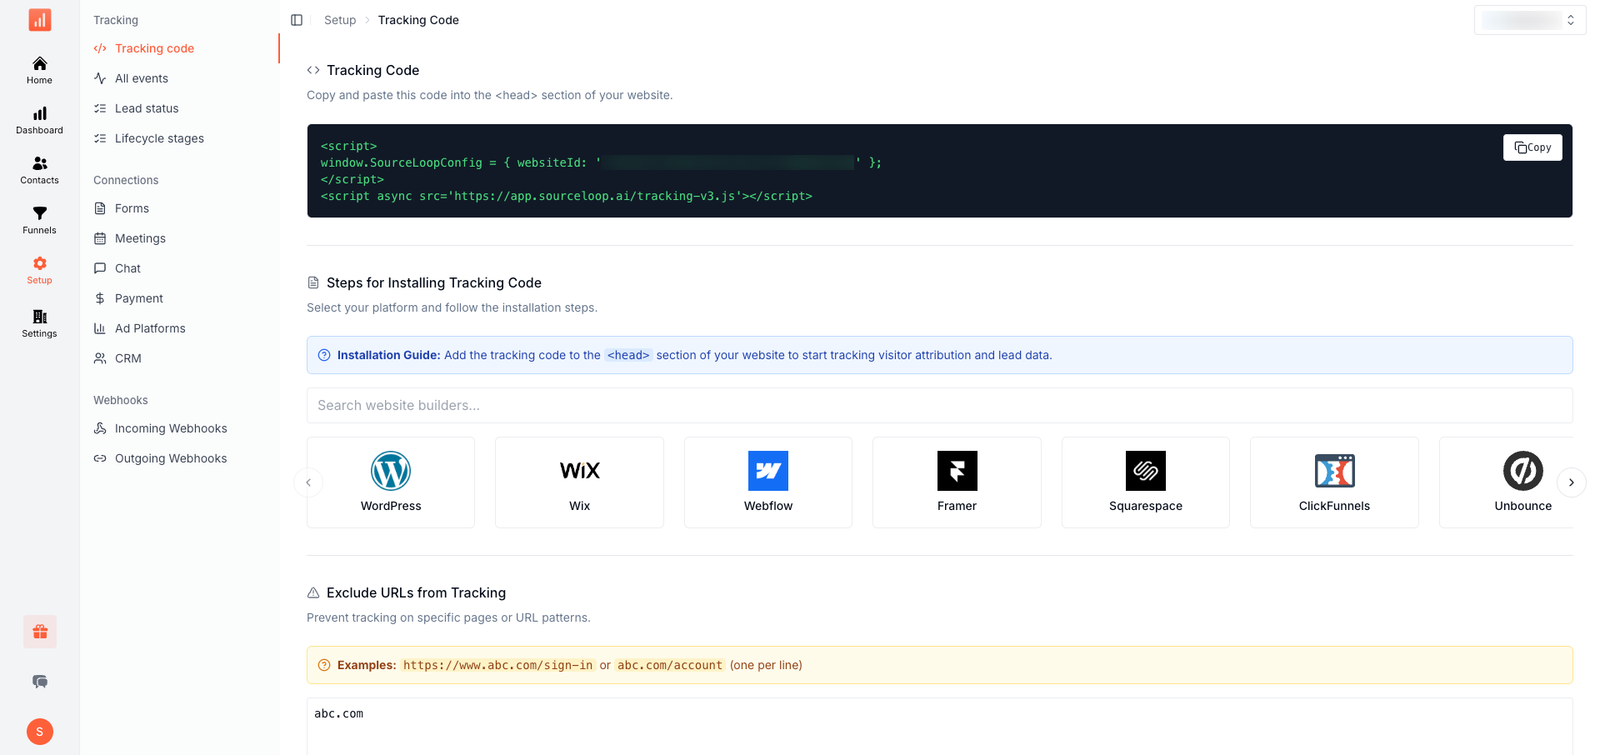
Subdomains are automatic. The visitor ID lives in a first-party cookie on your root domain, so www.yoursite.com and app.yoursite.com are the same person with no configuration.
Separate root domains (marketing on yourbrand.com, product on yourapp.io) need one config line. SourceLoop appends identity parameters to outbound links between them, and the destination adopts the ID on arrival.
This is the hop where most journey tools lose the source, and where a paid signup starts looking like Direct.
5. Conversion milestones without engineering work
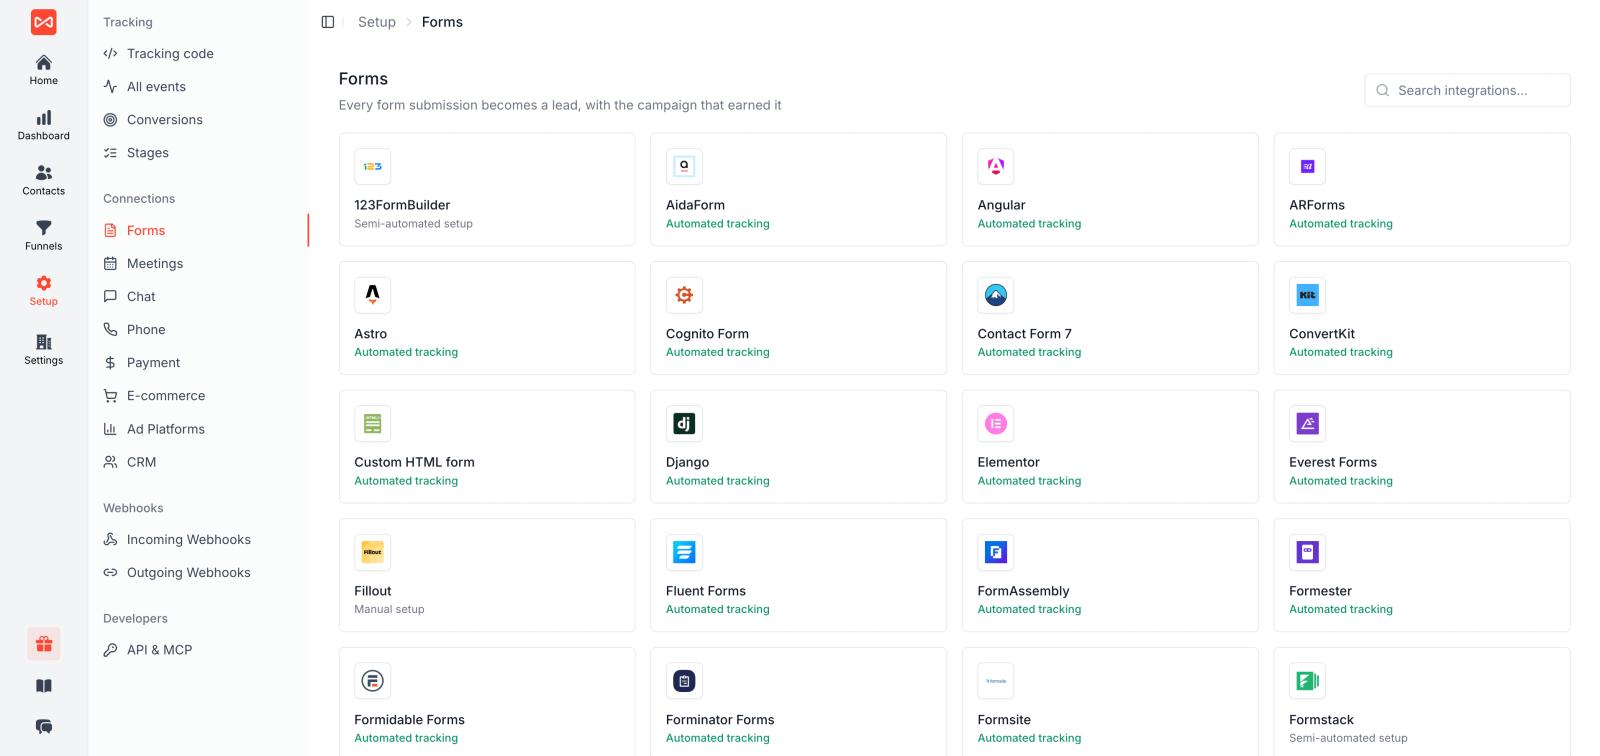
The milestones that define a journey are forms, bookings, chats, calls and payments. Around 70 of those tools are detected automatically, including Calendly, Cal.com, HubSpot Meetings, Chili Piper, Typeform, Gravity Forms, WPForms, Jotform, Webflow, Intercom, Drift, Crisp, CallRail, CallTrackingMetrics and Invoca.
Each lands on the timeline with the original source attached, and becomes a stage in the funnel builder.
6. Nine click IDs, because auto-tagging overwrites your UTMs
gclid, gbraid, wbraid, msclkid, fbclid, li_fat_id, ttclid, epik and rdt_cid, read on every landing URL and stored on the session and contact.
SourceLoop reads them before the referrer, which narrows the Direct bucket. A Google Ads click on iOS Safari arrives with the referrer stripped, and the gclid is the only thing left proving where it came from.
7. The journey ends at revenue, not at a signup event
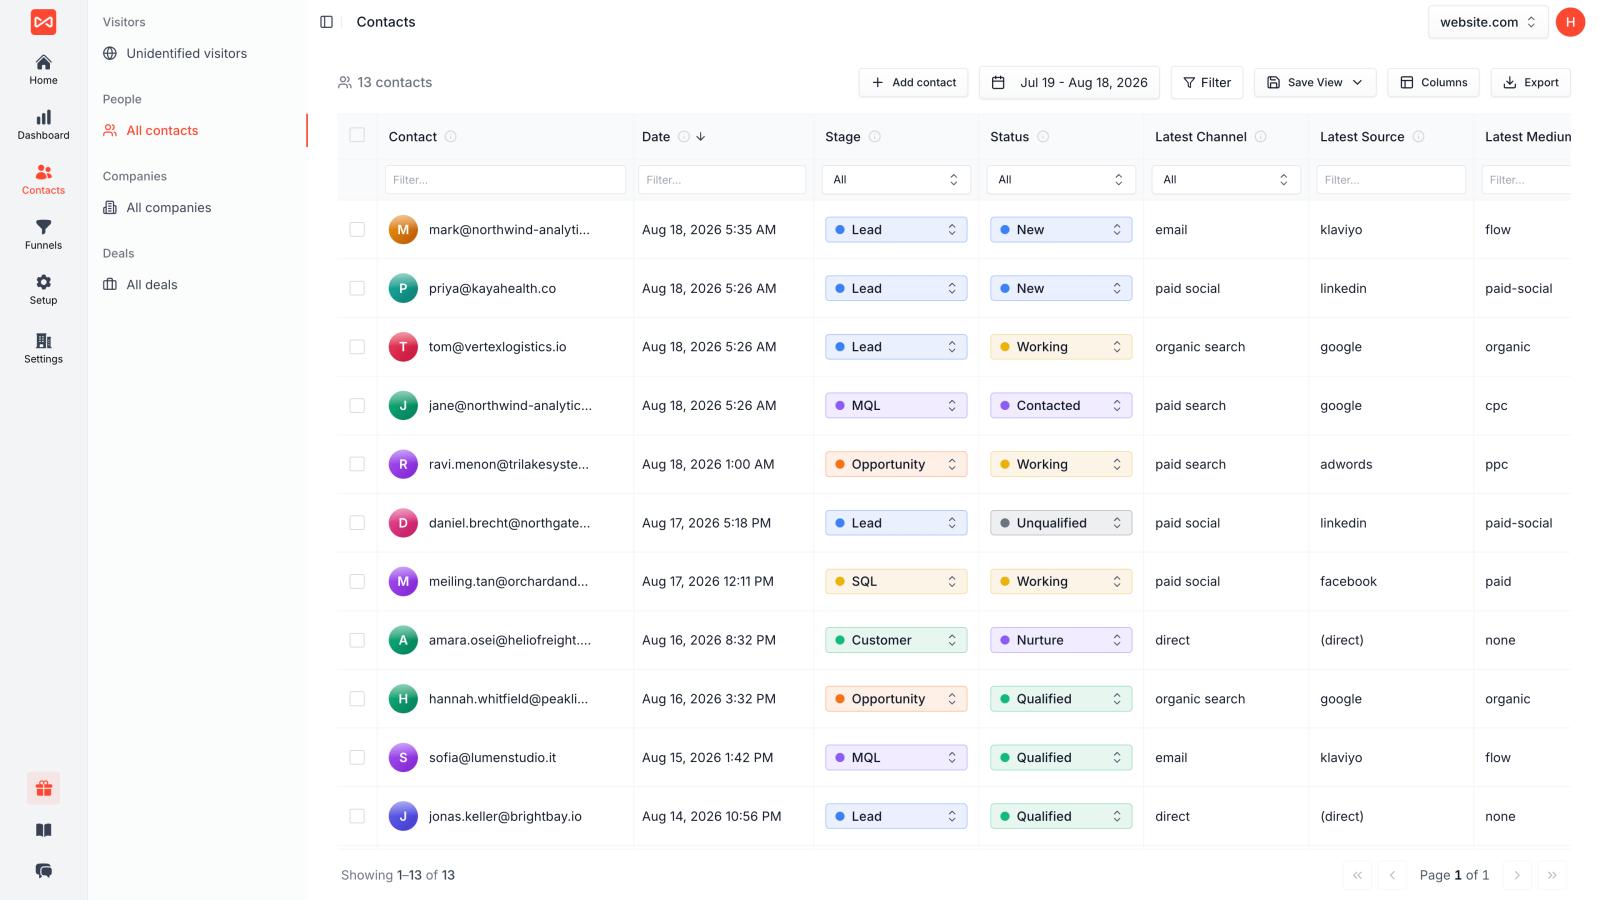
Stripe, Paddle, Polar, Lemon Squeezy and Dodo Payments webhooks match back to the visitor who first clicked, even when checkout happens days later on another device.
For sales-led motions, HubSpot, Salesforce, Pipedrive and Zoho sync both ways, so deal stage and closed-won value flow back into the journey.
Contacts also roll up by company, resolved from the domain on a captured lead email. In B2B the person who read the first blog post is rarely the person who signs.
8. Content attribution, so the journey names pages and not just channels
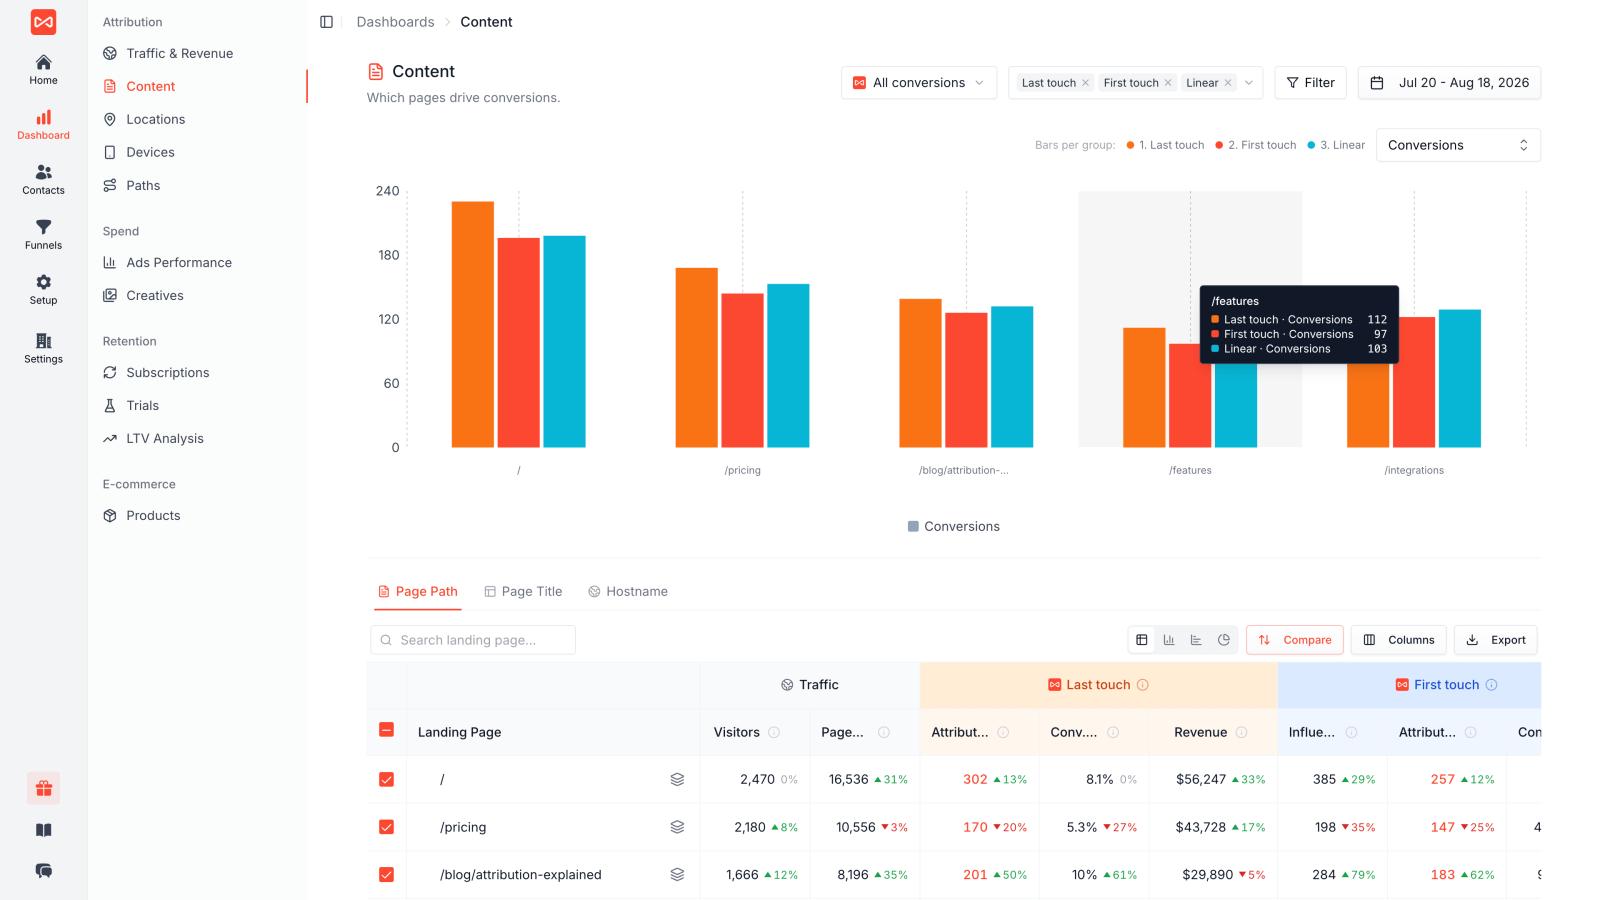
The Content dashboard reports conversions, conversion rate and attributed revenue per landing page and per visited page, under any model. Under first touch you see which posts open journeys, under last touch which pages close them. They are usually different pages.
Pros:
- Session-by-session timeline for every contact, no event schema to design first
- Path sequence analysis with a collapse-repeats toggle, plus seven attribution models
- Attribution on anonymous visitors, before they ever identify themselves
- Automatic subdomain stitching and one-line cross-root-domain stitching
- Around 70 lead tools captured with no engineering work
- Account-level journeys merging every person at a company
- Page-level content attribution under first and last touch
- MCP server and REST API for pulling the same journeys programmatically
Cons:
- No in-app product analytics. It will not tell you which feature drives retention. Pair it with Mixpanel, Amplitude or PostHog.
- No session replay or heatmaps. That is FullStory, Contentsquare and Quantum Metric territory.
- Web and server-side only. There is a JavaScript snippet and an npm SDK, but no native iOS or Android SDK, so app-first journeys need something else.
- Not a substitute for Adobe CJA if your journey genuinely spans call centre and in-store systems at enterprise scale.
- Tracked conversions are unlimited on every plan, but the entry tier covers 30k page views a month.
Pricing: Essential $49/mo covers 1 site, 1 user and 30k page views a month. Professional $99/mo adds 3 users and 100k page views. Agency $249/mo covers 3 sites, unlimited users and 2.5M page views. Tracked conversions are unlimited on every plan, annual billing takes 25% off, and there is a 7-day trial with no card.
2. Adobe Customer Journey Analytics
Best for: Enterprise organizations already invested in Adobe Experience Cloud
Adobe Customer Journey Analytics is the enterprise-grade cross-channel analytics platform. It unifies data from web, mobile, call center, in-store POS, and offline channels into a single customer profile, then provides Analysis Workspace to drill into journeys without building predefined reports.
Cross-channel stitching connects sessions and devices, and the platform supports any data schema through its flexible data model.
For Fortune 500 brands and large enterprises, Adobe CJA is the safe choice. The trade-offs are familiar Adobe trade-offs: implementation typically takes 3-6 months, requires dedicated analytics resources, and pricing scales sharply with data volume.
For organizations not already on Adobe Analytics, the lift to deploy CJA is rarely justified versus alternatives.
Pros:
- Most mature enterprise cross-channel journey analytics
- Native integration with Adobe Experience Cloud and Marketo
- Supports any data schema through flexible data model
Cons:
- 3-6 month implementation typical
- Enterprise pricing only
- Limited innovation since the original CJA release
Pricing: Custom enterprise pricing based on data volume and feature requirements. Most deployments six figures annually.
3. Mixpanel
Best for: SaaS and product teams that need event-based in-app journey analytics
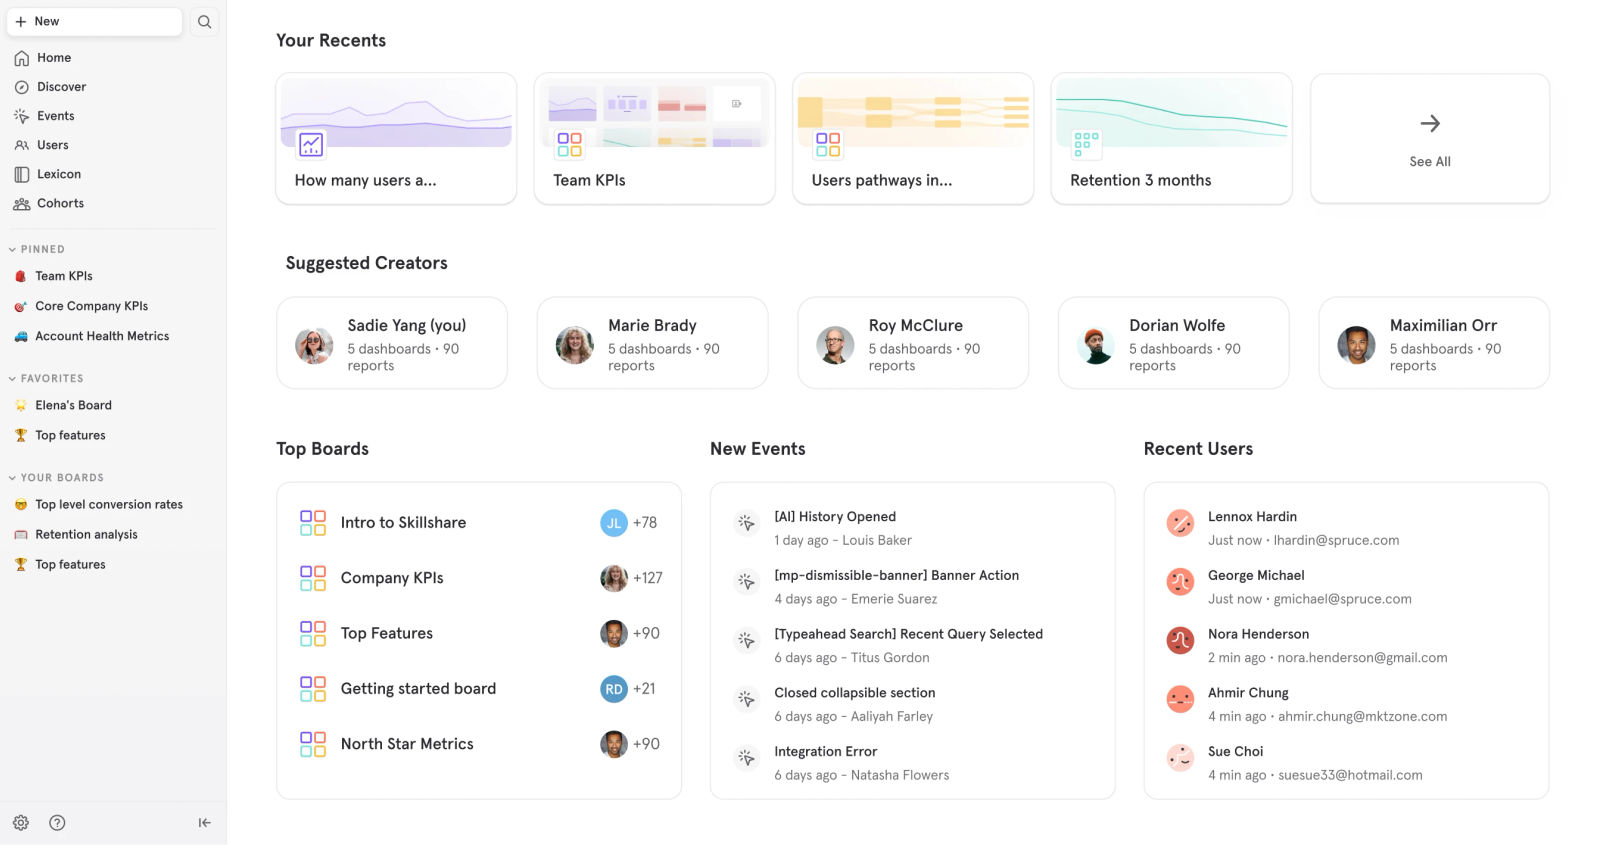
Mixpanel is the standard product analytics tool for tracking in-app user journeys: feature adoption, funnel drop-off, retention cohorts, A/B test outcomes.
The Flows report visualizes the most common paths users take through your product, which is the core "journey" view for product-led companies.
Mixpanel's free tier covers up to 1M events/month and is genuinely useful for early-stage SaaS.
Mixpanel doesn't see the marketing journey before the user signs up. Pair it with SourceLoop or Segment on the acquisition side and Mixpanel on the in-product side for the full journey view.
Pros:
- Industry-standard product analytics with strong journey visualization
- Free tier up to 1M events/month
- Strong cohort and retention analysis
Cons:
- Doesn't capture pre-signup marketing journey
- Pricing scales sharply with event volume
- Implementation requires engineering for proper event taxonomy
Pricing: Free tier up to 1M events/month. Growth from $24/month. Enterprise custom.
4. Amplitude
Best for: Product-led growth companies with mature data science needs
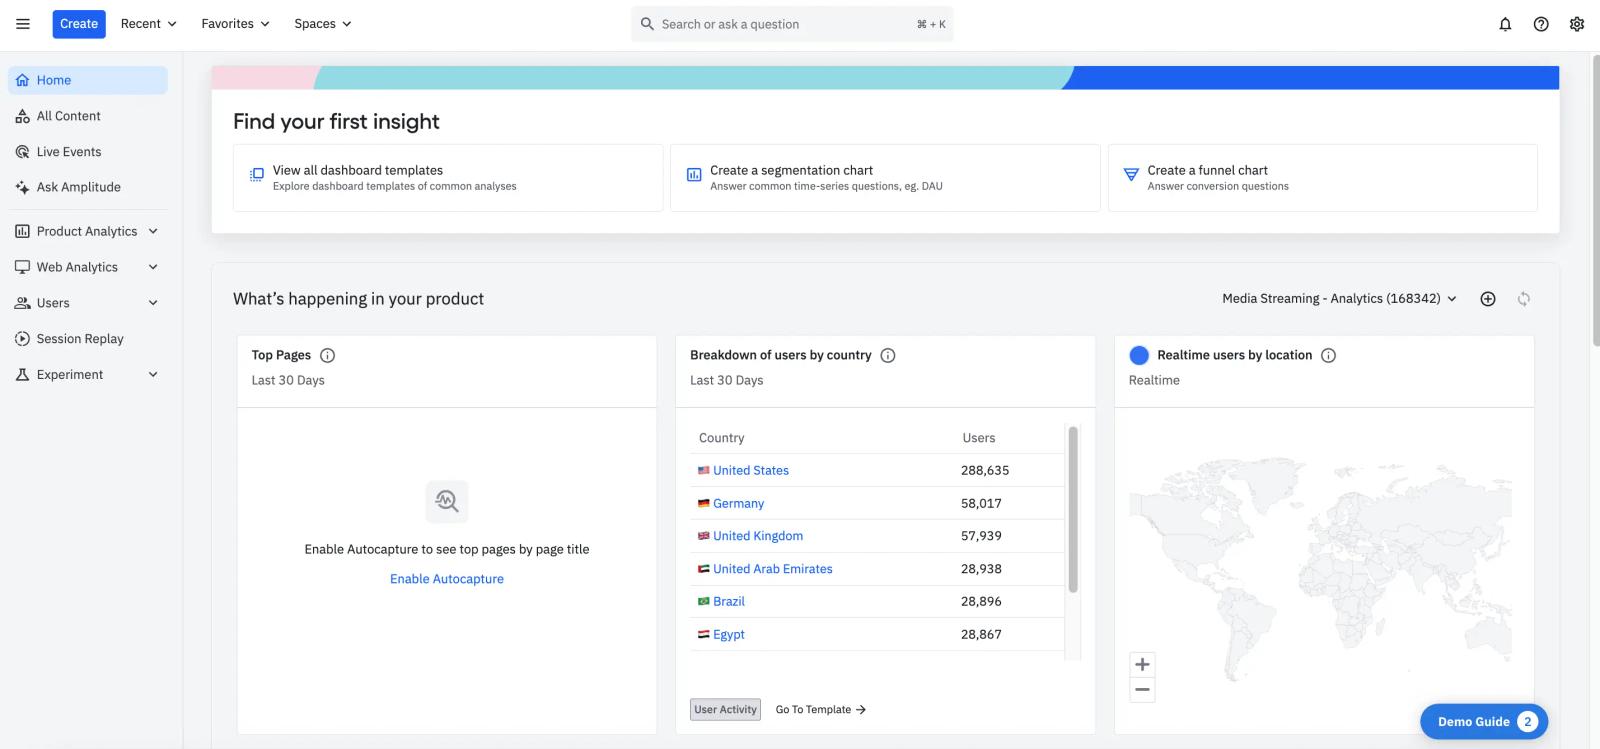
Amplitude competes head-to-head with Mixpanel for product analytics. Where Mixpanel leans into ease of use, Amplitude leans into depth: behavioral cohorts, predictive analytics, ML-driven retention insights, and built-in experimentation. The Pathfinder feature visualizes user journeys across product flows.
Amplitude's free Starter plan and $49/month Plus tier make it accessible for smaller teams.
Enterprise pricing scales with monthly tracked users (MTUs) into the six figures for large deployments. For PLG companies past Series A, Amplitude is often the choice over Mixpanel.
Pros:
- Deeper data science capabilities than Mixpanel
- Predictive analytics and behavioral cohorts
- Built-in experimentation alongside analytics
Cons:
- Steeper learning curve than Mixpanel
- Pricing scales with MTUs, expensive at high volumes
- Doesn't capture pre-signup marketing journey
Pricing: Free Starter plan. Plus from $49/month. Growth and Enterprise tiers custom.
5. Heap
Best for: Teams that want journey analytics without manually instrumenting events
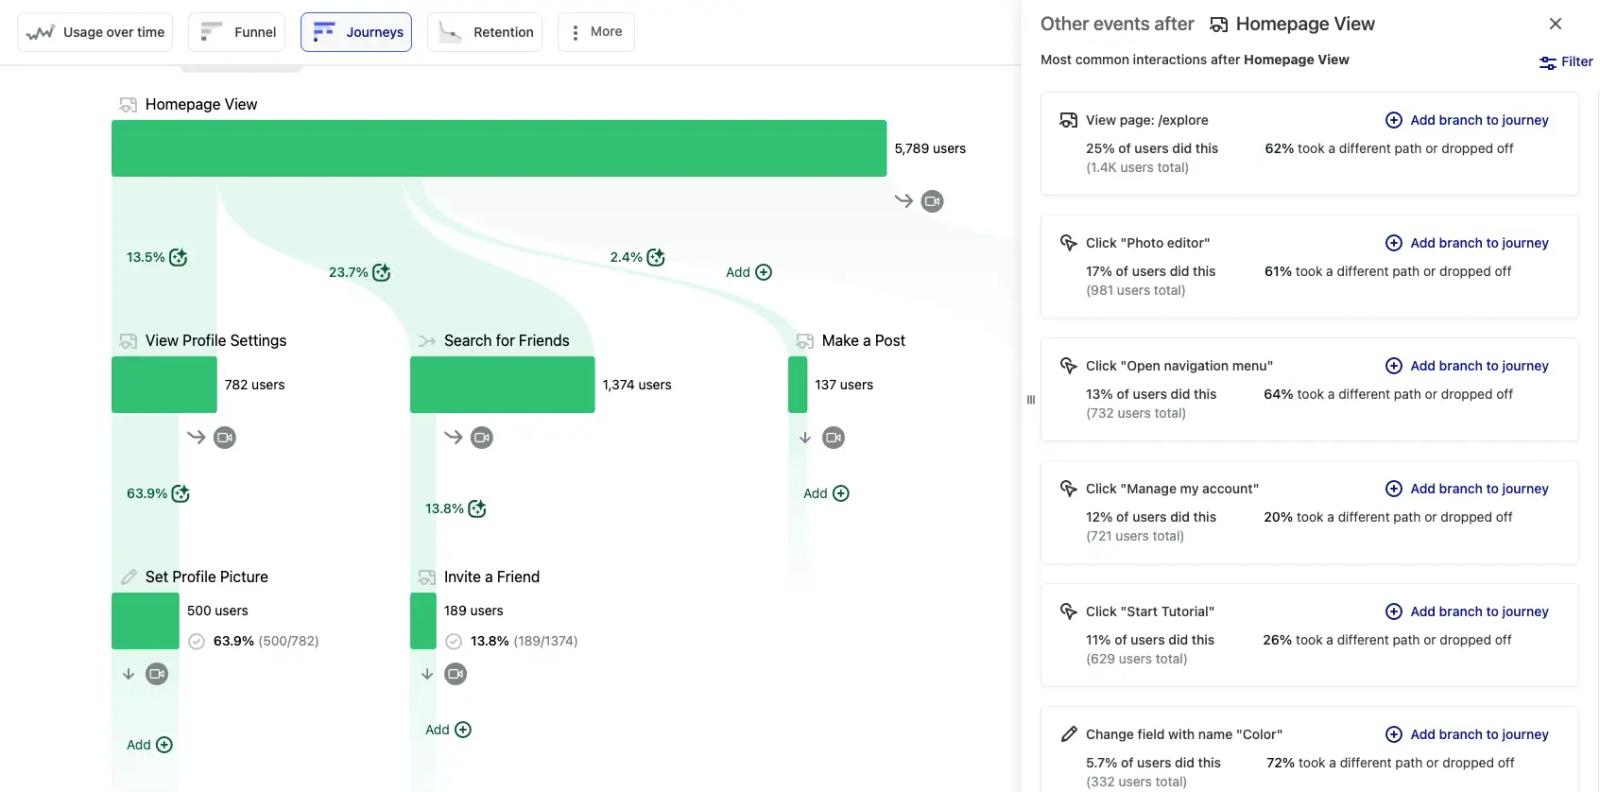
Heap takes a different approach to journey analytics through autocapture. Instead of requiring engineers to manually track each event, Heap's tag captures every click, page view, form submission, and scroll automatically.
You define events retroactively, which means you can analyze user journeys in your product even if you didn't think to track them at the time.
For teams without dedicated analytics engineering, Heap is genuinely faster to value. The trade-off is that autocapture generates noisy data, and serious analytics work still benefits from deliberate event taxonomy. Now part of Contentsquare, Heap continues to operate as a standalone product with a stronger focus on B2B SaaS.
Pros:
- Autocapture eliminates upfront event taxonomy work
- Retroactive event definition for historical journey analysis
- Faster time-to-value than Mixpanel or Amplitude
Cons:
- Autocapture generates noise that needs filtering
- Limited transparency on enterprise pricing
- Less mature for B2C and high-volume consumer apps
Pricing: Free Starter tier. Pro and Premier tiers custom, typically $1,000-$5,000/month.
6. Contentsquare
Best for: UX teams combining journey analytics with session replay and heatmaps
Contentsquare is a digital experience analytics platform that combines journey analysis with session replay, heatmaps, and AI-driven UX insights. While most analytics tools show what users did, Contentsquare helps you understand why they struggled or succeeded.
The AI surfaces frustration signals (rage clicks, error messages, hesitation patterns) automatically.
For UX and CX teams that need journey analytics tied to qualitative session evidence, Contentsquare is the strongest pick. The trade-off is enterprise-only pricing and 4-6 week implementation. Contentsquare acquired Heap in 2024 and now offers both products as a combined digital experience analytics suite.
Pros:
- Best-in-class combination of journey analytics and UX insights
- AI-driven frustration detection (rage clicks, hesitation)
- Heatmaps and session replay built in
Cons:
- Enterprise pricing only, no public tiers
- 4-6 week implementation
- Overkill for pure marketing attribution use cases
Pricing: Custom enterprise pricing. Typical implementations $1,500-$5,000+/month.
7. Quantum Metric
Best for: Enterprise digital teams that need real-time journey analytics with business impact quantification
Quantum Metric is a digital experience platform that captures every user action in real-time and quantifies the business impact of friction points.
The differentiator is that journey insights translate to dollar-impact estimates: if 5% of users drop off at checkout step 3, Quantum tells you the estimated revenue at risk.
Quantum is used heavily by retail, financial services, and travel brands where digital revenue is high and journey friction has measurable cost. It's enterprise-only, with implementations typically running 4-8 weeks.
Pros:
- Real-time journey capture with no sampling
- Dollar-impact quantification of friction points
- Strong fit for retail, finance, travel digital revenue
Cons:
- Enterprise pricing, no public tiers
- 4-8 week implementation
- Less suited for SaaS or B2B use cases
Pricing: Custom enterprise pricing.
8. FullStory
Best for: Product and CX teams that want session replay alongside journey analytics
FullStory made its name on session replay and has expanded into broader digital experience and journey analytics.
Every user session is captured automatically, friction signals are detected via AI, and journey reports show common paths through web and mobile apps. The Conversion Funnel and Frustration Index reports surface where users get stuck.
FullStory is a strong all-rounder for product and CX teams that want both quantitative journey data and qualitative session evidence in one tool. It's enterprise-priced with no public tiers, and typical deployments start around $25,000/year.
Pros:
- Industry-leading session replay alongside journey analytics
- AI-driven frustration detection
- Strong mobile and web coverage
Cons:
- Enterprise pricing, no transparent tiers
- Typical deployments start $25K+/year
- Overlaps significantly with Contentsquare and Quantum Metric
Pricing: Custom enterprise pricing. Most deployments $25,000+/year.
9. Segment
Best for: Engineering-led teams that want a CDP routing customer journey data to every analytics tool
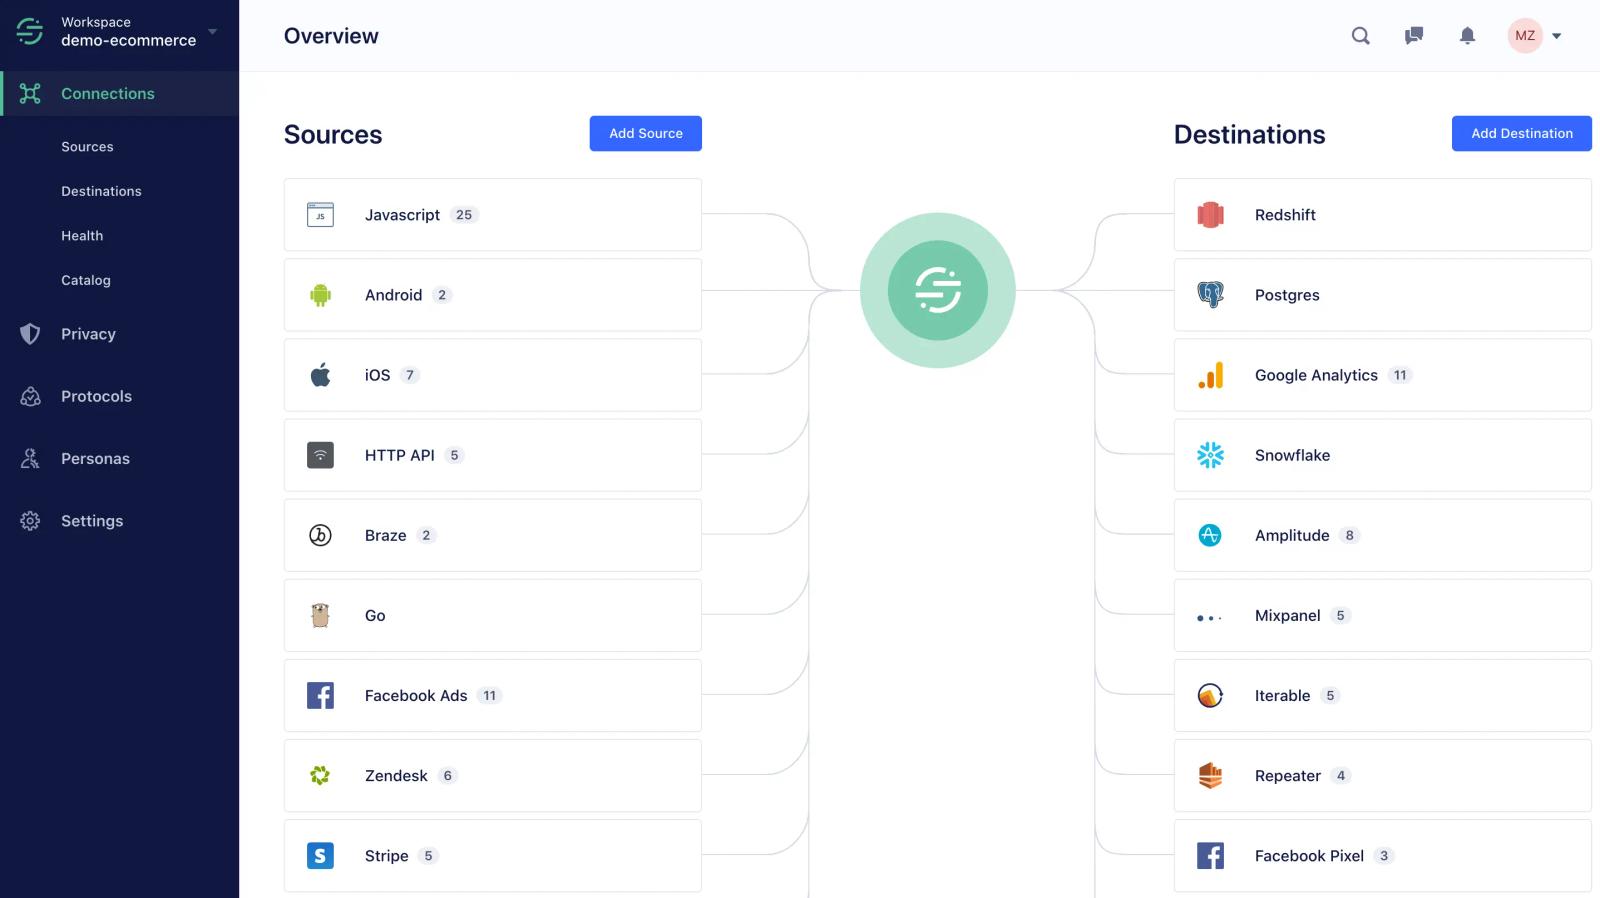
Segment, now owned by Twilio, is the dominant customer data platform. It collects first-party event data from your website, mobile app, or backend, then routes it to over 300 destinations including Mixpanel, Amplitude, FullStory, ad platform CAPIs, CRMs, and data warehouses.
Segment isn't a journey analytics tool itself, it's the infrastructure that makes consistent journey data possible across every other tool in your stack.
For B2B teams with engineering resources, Segment is the most flexible foundation for journey analytics. The trade-off is complexity: implementing Segment well requires engineering investment, and pricing scales with monthly tracked users. For teams without dev resources, a managed all-in-one tool delivers the same outcome with less work.
Pros:
- Most flexible CDP for routing journey events to every destination
- 300+ pre-built integrations
- Future-proof if you change analytics tools
Cons:
- Requires engineering resources to implement well
- Pricing scales sharply with MTUs
- Not a journey analytics tool by itself
Pricing: Free plan up to 1,000 MTUs. Team plan from $120/month. Business plan custom.
10. Woopra
Best for: Customer success and growth teams that want real-time individual customer journey tracking
Woopra takes a different angle than Mixpanel or Amplitude: instead of aggregate journey analytics, Woopra focuses on real-time individual customer profiles. You can pull up a single customer and see every page they visited, every email they opened, every support ticket they filed, every product event they fired, all in one timeline.
For customer success teams, account managers, and growth teams that need to see individual customer behavior in real time, Woopra is genuinely useful. The trade-off is that it's less mature than Mixpanel or Amplitude for cohort and funnel analysis at scale.
Pros:
- Real-time individual customer journey timelines
- Strong fit for customer success and account management
- Free tier covers small teams
Cons:
- Less mature than Mixpanel for aggregate analytics
- Pricing scales sharply at enterprise tiers
- Smaller integration ecosystem than competitors
Pricing: Free Core tier for up to 500K actions/month. Pro from $999/month. Enterprise custom.
How to choose
For most teams, customer journey analytics is a layered system, not a single tool. Here's how to think about the layers.
The lean approach: cover the marketing journey first. Most teams already have a product analytics tool (or get one quickly).
What they do not have is clean visibility into the journey before the user signs up: which ad click brought them in, which campaign sourced the eventual paying customer, and what that customer turned out to be worth. SourceLoop covers that layer at $49/month, with visitor-level source capture, nine click IDs, automatic Calendly and form detection, path sequence analysis, and webhook revenue stitching from Stripe, Polar and Paddle.
It feeds clean acquisition data into Mixpanel, Segment, or whatever product analytics tool you already use, so you can finally see the full journey from ad click to retention.
The traditional stack: if you're at enterprise scale, expect to run multiple tools. Adobe CJA or Salesforce Marketing Cloud Intelligence for cross-channel analytics. Mixpanel or Amplitude for product analytics. Contentsquare, Quantum Metric, or FullStory for digital experience. Segment as the CDP foundation routing data between them. Total cost easily clears $100,000/year at mid-market scale.
Frequently asked questions
-
What is customer journey analytics software?
Customer journey analytics software stitches together every interaction a customer has with your brand (across web, mobile, ads, email, support, in-store, and product) into a single coherent journey view. The category includes marketing journey tools (SourceLoop, Cometly), product analytics (Mixpanel, Amplitude, Heap), digital experience analytics (Contentsquare, Quantum Metric, FullStory), and enterprise cross-channel platforms (Adobe CJA, Salesforce Marketing Cloud Intelligence).
-
What's the difference between customer journey analytics and product analytics?
Product analytics (Mixpanel, Amplitude, Heap) tracks what users do inside your product after they sign up: feature adoption, funnel drop-off, retention. Customer journey analytics is broader, covering the full journey from first marketing touch through closed revenue and beyond. Product analytics is one layer of customer journey analytics, not the whole picture.
-
Do I need a CDP for customer journey analytics?
For small to mid-sized teams, no. A managed analytics tool (SourceLoop for marketing, Mixpanel for product) covers most journey analytics needs without a CDP. For mid-market and enterprise teams running 5+ analytics, marketing, and CRM tools that all need consistent event data, a CDP like Segment is genuinely useful. The decision usually comes down to engineering resources: if you have the dev capacity to implement and maintain Segment, it's worth it.
-
How much should I budget for customer journey analytics?
Below $5M ARR, $49-$500/month tools (SourceLoop, Mixpanel free tier, Heap free tier) cover the basics. Between $5M-$50M ARR, dedicated product analytics and CDP tools at $1,000-$5,000/month make sense (Amplitude, Segment, Contentsquare). Above $50M ARR, enterprise platforms (Adobe CJA, Quantum Metric, FullStory) at $50,000+/year are justified by digital revenue at stake.
-
What's the difference between journey analytics and session replay?
Journey analytics quantifies user behavior across multiple sessions: what percentage of users complete a funnel, where the highest drop-off occurs, which features predict retention. Session replay shows individual user sessions as video-like recordings so you can see exactly what one user did. Modern tools (Contentsquare, Quantum Metric, FullStory) combine both because the quantitative "what" needs the qualitative "why" to be actionable.
-
Can I use Google Analytics 4 for customer journey analytics?
GA4 has path exploration reports and can visualize basic journeys, but it's not a serious customer journey analytics tool. The data model is built around web and app sessions, not unified customer profiles, and identity stitching across devices is limited. For mid-market teams that want real journey analytics, GA4 is a starting point, not the destination.
-
What journey analytics tool is best for B2B SaaS?
For pre-signup journey (which marketing channel sourced the customer), SourceLoop covers the marketing layer at $49/month with Calendly auto-detection and revenue stitching. For post-signup product analytics, Mixpanel or Amplitude are the standards. For account-level B2B journey analytics tied to CRM revenue, Dreamdata and HockeyStack are the dedicated options at $999-$2,200/month.
-
How long does customer journey analytics setup take?
Managed marketing journey tools (SourceLoop, Cometly) are typically live within a day. Product analytics tools (Mixpanel, Amplitude) take 1-3 weeks for proper event instrumentation. CDPs (Segment) take 2-6 weeks depending on system count. Enterprise platforms (Adobe CJA, Contentsquare, Quantum Metric) typically take 1-3 months of onboarding before reliable data flows. Plan for an extra 2-4 weeks of calibration before you trust the numbers for decision-making.



 Paid Social


