
Measurement in Marketing: Track KPIs & Connect to Revenue
Stop guessing. Master measurement in marketing to track KPIs & connect spend to revenue. Your complete guide to success.


Measurement in marketing is the systematic process of tracking KPIs and connecting marketing activities to business outcomes like revenue, customer acquisition, and growth. It answers the question every CMO faces: which marketing efforts actually drive results, and which ones waste budget?
What is measurement in marketing?
Marketing measurement is the practice of quantifying the performance and impact of marketing efforts across channels, campaigns, and touchpoints. It encompasses everything from tracking website traffic and ad clicks to connecting those activities to qualified leads, closed deals, and revenue.
The goal is simple: understand which marketing investments produce returns and which ones don't. But execution is complex. According to McKinsey research, only 3% of CMOs can attribute more than half of their marketing spend through marketing ROI measurement. That gap represents billions in wasted budget and missed opportunities.
Marketing measurement includes several components:
Campaign analytics that track performance across paid ads, organic content, email, and other channels
Attribution models that assign credit to touchpoints along the customer journey
Marketing mix modeling that evaluates overall channel performance and external factors
Incrementality testing that proves causality through controlled experiments
Revenue tracking that connects marketing activities to pipeline, deals, and customer lifetime value
The measurement methods you choose depend on your business model, marketing mix, and budget. A DTC ecommerce brand selling through Shopify needs different tools than a B2B SaaS company with 16-month sales cycles.
Why marketing measurement matters in 2026
Marketing budgets face more scrutiny than ever. CFOs demand proof that marketing drives growth, not just activity. Privacy regulations limit what you can track. Ad platforms report inflated numbers. And the customer journey spans more touchpoints across more channels than before.
Without accurate measurement, you're flying blind. You can't answer basic questions like:
Which campaigns generate qualified leads versus tire-kickers?
What's the real return on ad spend after accounting for organic conversions?
Should you shift budget from Google Ads to LinkedIn, or double down on content?
Which landing pages and offers convert visitors into customers?
Marketing measurement solves these problems by connecting marketing activities to business outcomes. It transforms marketing from a cost center into a revenue driver with clear ROI.
Strategic KPIs vs tactical KPIs: What to track
Not all KPIs carry equal weight. Marketing measurement requires tracking two distinct types of metrics that serve different purposes.
Strategic KPIs: Your destination
Strategic KPIs reflect ultimate business goals. They're typically shared across the organization and directly tied to revenue and growth. These are lagging indicators that tell you what happened, but they're what executives care about most.
For B2B SaaS companies, strategic KPIs include:
Monthly recurring revenue (MRR) and annual recurring revenue (ARR)
Customer acquisition cost (CAC)
Customer lifetime value (CLTV)
Marketing-influenced revenue
Pipeline value created
For ecommerce businesses, focus on:
Total revenue and revenue growth rate
Average order value
Return on ad spend (ROAS)
Customer lifetime value
Gross margin
For service businesses selling through demos and consultations:
Revenue per customer
Sales cycle length
Win rate from qualified leads
Customer acquisition cost
Lifetime value to CAC ratio
Tactical KPIs: Your navigation system
Tactical KPIs are leading indicators that predict changes in strategic metrics. They help you spot problems and opportunities early, before they impact revenue. These metrics guide day-to-day optimization decisions.
For paid advertising, track:
Click-through rate (CTR)
Cost per click (CPC)
Conversion rate by campaign and ad set
Cost per lead or cost per acquisition
Impression share and ad position
For website and conversion optimization:
Landing page conversion rate
Form completion rate
Bounce rate on key pages
Time to conversion
Cart abandonment rate (ecommerce)
For B2B lead generation:
Demo requests or consultation bookings
Marketing qualified leads (MQLs)
Sales qualified leads (SQLs)
Lead-to-opportunity conversion rate
Pipeline velocity
The key is connecting tactical KPIs to strategic outcomes. If cost per click rises 20% but conversion rate stays flat, your cost per acquisition just increased 20%. That early signal lets you adjust bids, test new creative, or shift budget before it damages ROI.
Core marketing measurement methods
Modern marketing measurement relies on three complementary approaches. Each method answers different questions and serves different purposes in your measurement strategy.
Multi-touch attribution: Digital journey tracking
Multi-touch attribution (MTA) tracks customer interactions across digital touchpoints before conversion. It uses click or view-based tracking to map the customer journey, then assigns credit to each touchpoint using an algorithm.
Common attribution models include:
First-touch attribution gives all credit to the first interaction. This works well for measuring awareness campaigns and top-of-funnel performance.
Last-touch attribution credits the final touchpoint before conversion. Most ad platforms use this model by default, which tends to favor retargeting and branded search.
Linear attribution distributes credit equally across all touchpoints. This provides a balanced view but may overweight minor interactions.
Time-decay attribution gives more credit to touchpoints closer to conversion, reflecting their stronger influence on the final decision.
Position-based (U-shaped) attribution emphasizes the first and last touchpoints while giving some credit to middle interactions.
Multi-touch attribution excels at answering questions like "Did the customer click Facebook Ads or Google Ads before purchasing?" It's particularly valuable for ecommerce businesses with short sales cycles and primarily digital customer journeys.
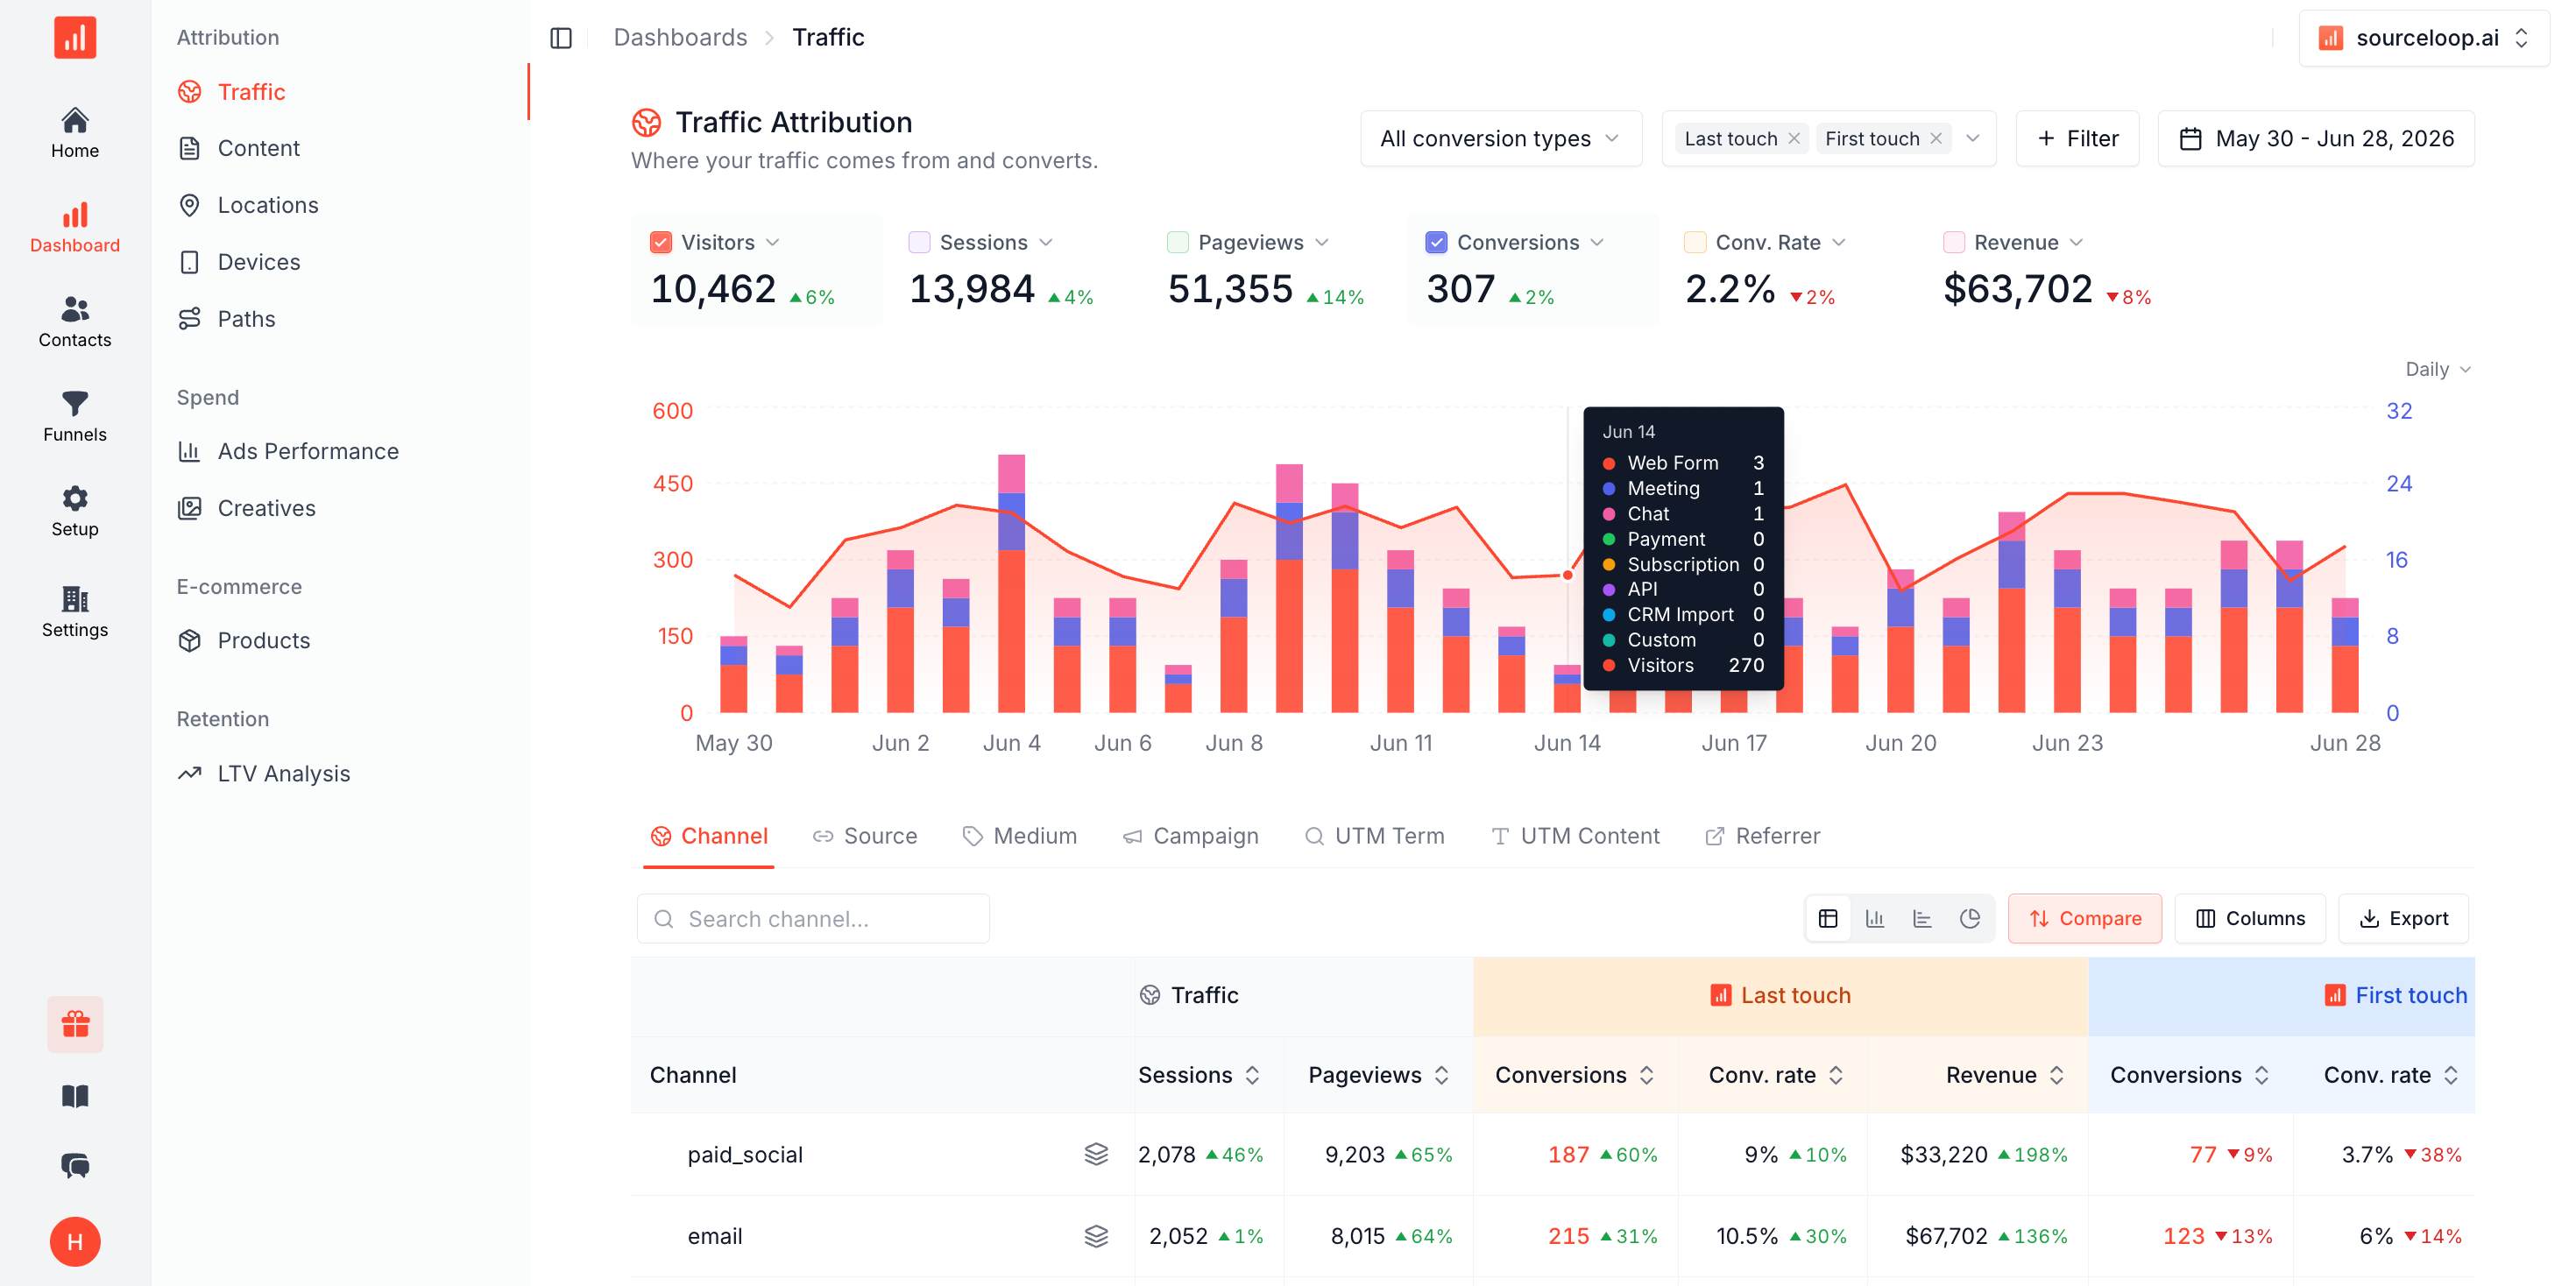
However, MTA has significant limitations. It doesn't measure incrementality or causality. You can't tell if a customer purchased because they saw an ad or if they would have bought anyway. The method struggles with offline channels like TV, radio, and print. And privacy changes, including the deprecation of third-party cookies, make digital tracking increasingly unreliable.
For B2B companies with long sales cycles, attribution becomes even less effective. When deals close 16 months after first touch, most attribution tools can't connect the dots.
Marketing mix modeling: Strategic channel evaluation
Marketing mix modeling (MMM) uses statistical analysis of historical data to measure the contribution of each marketing channel to sales and conversions. It employs regression techniques to decompose the factors influencing business performance, including marketing spend, seasonality, economic conditions, and competitive activity.
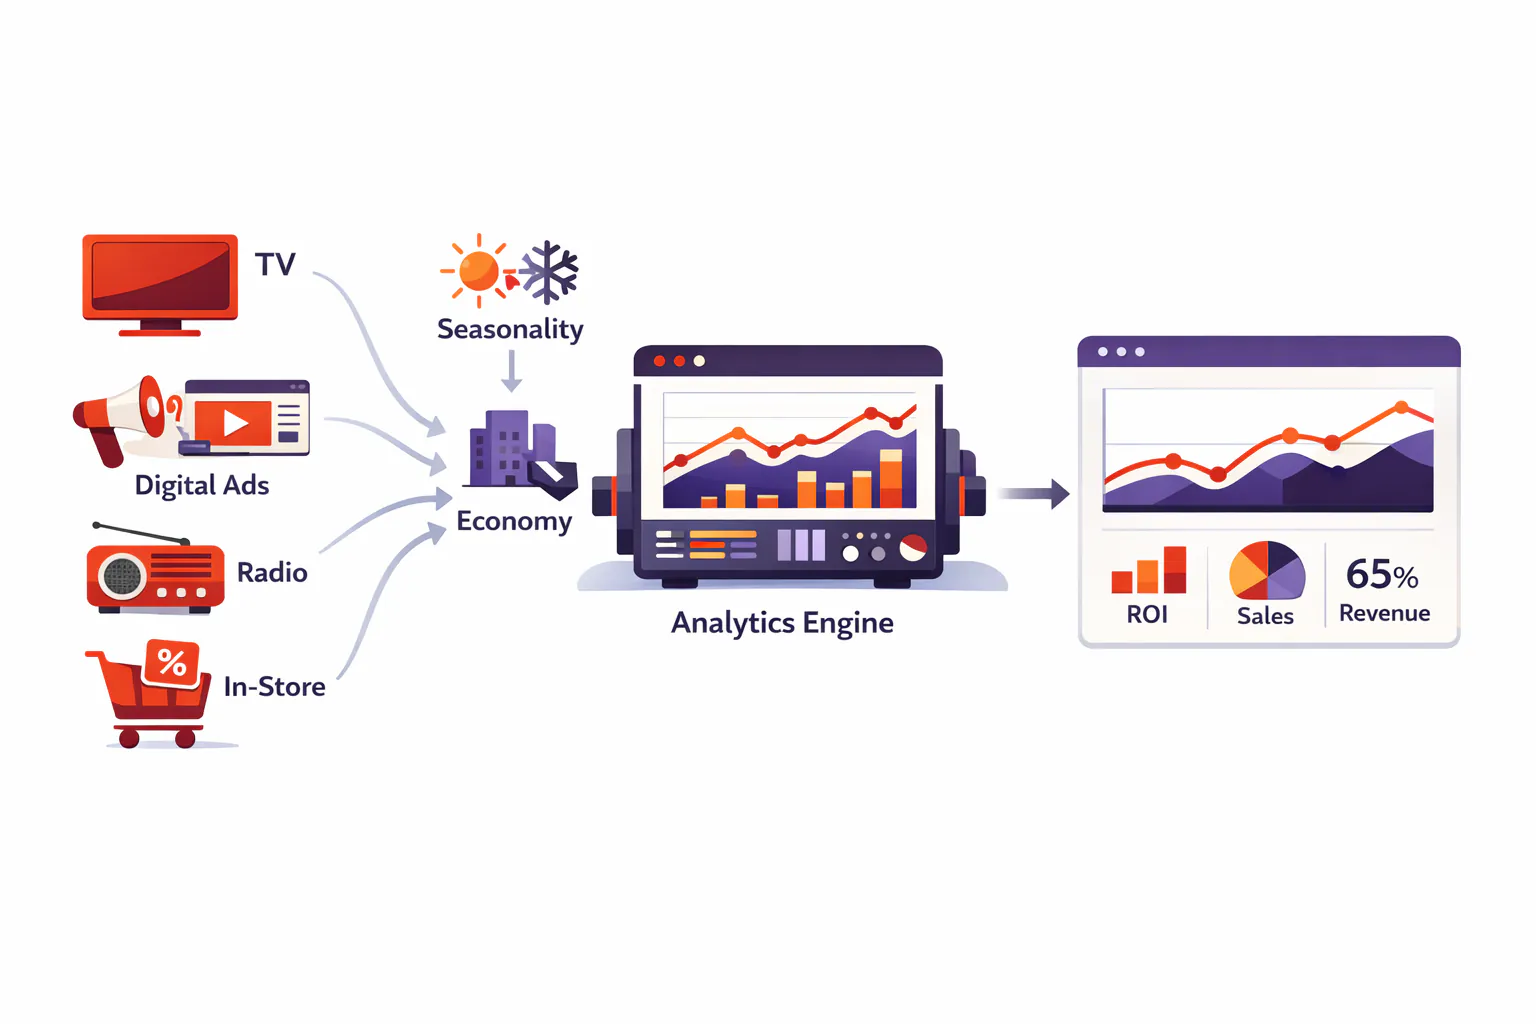
MMM answers strategic questions like:
What's the incremental impact of each marketing channel on revenue?
How do external factors like seasonality affect performance?
What will happen if we shift 10% of budget from one channel to another?
What's the optimal budget allocation across channels?
The key advantage of MMM is that it measures incrementality. It estimates what would have happened without each marketing activity, isolating the true causal impact. This makes it far more reliable than attribution for strategic decisions.
MMM also works across both online and offline channels. It can measure the impact of TV ads, radio spots, and billboards alongside digital campaigns. And because it doesn't rely on user-level tracking, it's privacy-compliant and unaffected by cookie deprecation.
The tradeoffs: MMM focuses on channel-level performance over longer time periods rather than individual campaigns or creative. It requires substantial historical data, typically 18-24 months. And it demands solid data infrastructure and statistical expertise to build and maintain accurate models.
According to Supermetrics research, companies spending above $5 million annually on marketing should invest in MMM to guide budgeting and strategic planning.
Building your marketing measurement stack
Effective measurement requires the right tools and infrastructure. Your measurement stack should capture data, connect it across systems, and make it accessible for analysis and decision-making.
Data collection and tracking

First-party tracking forms the foundation. With third-party cookies disappearing, you need to capture visitor behavior directly on your own domain. This includes:
Website tracking that captures page views, events, and conversions
UTM parameters that tag campaign sources in URLs
Form tracking that connects submissions to marketing touchpoints
Call tracking that attributes phone conversions to campaigns
Meeting booking that links scheduled demos to ad clicks

Tools like Sourceloop handle this layer by capturing visitor behavior across ads, website pages, forms, booked meetings, phone calls, and live chat.
Every lead and customer is connected to the campaigns, channels, keywords, landing pages, and touchpoints that influenced them.
CRM integration and revenue tracking
Marketing measurement only matters if it connects to revenue. Your tracking data needs to flow into your CRM where deals close and revenue is recorded.
Sourceloop creates attribution fields directly in HubSpot, Pipedrive, or Salesforce and fills them automatically. Sales reps see the origin of each lead inside the record they already work in. Deal values and won/lost status sync back, so reporting reflects actual revenue rather than just form fills.

For ecommerce, order revenue from Shopify flows through webhooks, connecting purchases to the ads that drove them.
Ad platform sync
Closing the loop requires sending conversion data back to ad platforms. Google Ads and Meta use this feedback to optimize automated bidding toward real outcomes rather than clicks.
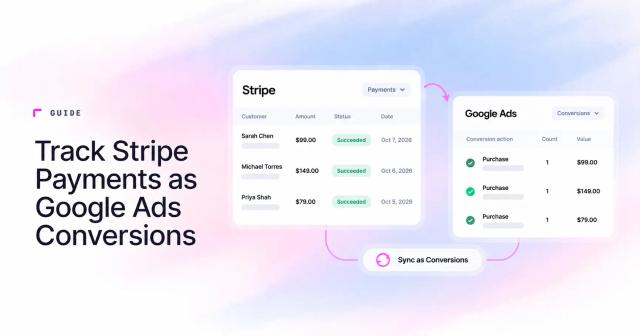
Sourceloop pushes qualified leads and closed revenue back to Google Ads and Meta as offline conversions. This trains the algorithms to find more customers like the ones who actually bought, not just people who filled out forms.
Common marketing measurement challenges
Even with the right tools and methods, measurement presents ongoing challenges. Here's how to address the most common obstacles.
Challenge 1: Proving marketing attribution
The biggest complaint from marketing teams: "We can't prove which campaigns drive revenue." This happens when tracking breaks between marketing touchpoints and CRM records.
Solution: Implement first-party tracking that captures UTM parameters and campaign data, then writes it directly into CRM fields. Tools like Sourceloop automate this process, ensuring every lead arrives with full attribution context.
Challenge 2: Disconnected data sources
Marketing data lives in ad platforms, analytics tools, CRMs, and spreadsheets. Stitching it together manually wastes time and introduces errors.
Solution: Build a data pipeline that consolidates marketing data into a single source of truth. This might be a data warehouse, a marketing analytics platform, or a tool like Supermetrics that automates data collection.
Challenge 3: Platform-reported metrics don't match reality
Facebook claims 1,000 conversions. Google Analytics shows 600. Your CRM records 400. Which number is right?
Solution: Trust your own tracking over platform reports. Platforms have incentives to inflate numbers. Your first-party tracking and CRM data reflect what actually happened. Use incrementality testing to validate platform claims.
Challenge 4: Long sales cycles break attribution
B2B companies with 12-16 month sales cycles struggle to connect closed deals back to the original marketing touchpoint. Most attribution tools have 30-90 day lookback windows.
Solution: Capture attribution data at the lead level and store it in your CRM. When the deal closes months later, the original source is still recorded. Focus on pipeline metrics (opportunities created, pipeline value) rather than waiting for closed revenue.
Challenge 5: Privacy regulations limit tracking
GDPR, CCPA, and similar regulations restrict what you can track without consent. Cookie banners reduce tracking coverage.
Solution: Shift to first-party tracking on your own domain. Implement cookieless tracking modes for users who decline consent. Focus on aggregate channel performance through MMM rather than individual user tracking.
Frequently Asked Questions
What is the difference between marketing measurement and marketing analytics?
Marketing measurement focuses on quantifying the impact and performance of specific marketing activities, campaigns, and channels. Marketing analytics is broader, encompassing the tools, techniques, and processes used to analyze marketing data and generate insights. Measurement is what you track; analytics is how you analyze it.
What are the most important marketing KPIs to track?
The most important KPIs depend on your business model. B2B companies should track customer acquisition cost, marketing-influenced revenue, pipeline value, and lead-to-customer conversion rate. Ecommerce businesses focus on return on ad spend, average order value, customer lifetime value, and revenue growth. All businesses should track both strategic KPIs (revenue, ROI) and tactical KPIs (CTR, CPC, conversion rate).
How do you measure marketing ROI accurately?
Accurate marketing ROI measurement requires connecting marketing spend to revenue. Track all marketing costs including ad spend, tools, and personnel. Capture first-party data that links marketing touchpoints to leads and customers. Sync revenue data from your CRM or ecommerce platform. Use attribution models to assign credit across touchpoints. Calculate ROI as (revenue attributed to marketing minus marketing costs) divided by marketing costs.
What is incrementality in marketing measurement?
Incrementality measures the additional conversions or revenue generated by marketing efforts that wouldn't have happened otherwise. It answers "What would have happened if we hadn't run this campaign?" Incrementality testing uses controlled experiments to prove causality by comparing a group exposed to marketing against a control group that isn't.
How does first-party data improve marketing measurement?
First-party data is information you collect directly from customers and visitors on your own properties. It's more accurate than third-party data, privacy-compliant, and unaffected by cookie deprecation. First-party tracking captures the full customer journey across your website, forms, and conversions, then connects it to CRM records and revenue. This provides reliable attribution data that you own and control.
What's the difference between multi-touch attribution and marketing mix modeling?
Multi-touch attribution tracks individual customer journeys across digital touchpoints and assigns credit to each interaction. It works at the user level and requires digital tracking. Marketing mix modeling uses statistical analysis of historical data to measure the overall contribution of each marketing channel to sales, including offline channels. MMM works at the aggregate level and doesn't require user tracking, making it privacy-compliant.
How much should I spend on marketing measurement tools?
Budget 2-5% of your total marketing spend on measurement tools and infrastructure. Companies spending under $3 million annually can start with free tools like Google Analytics and platform reporting. Those spending $3-5 million should add attribution tools and experimentation capabilities. Companies spending above $5 million should invest in marketing mix modeling and comprehensive measurement platforms.



 Paid Social


