
7 Types of Attribution Models That Marketers Should Know
A visual guide to the 7 attribution models every marketer should know, last touch, first touch, last/first non-direct, linear, U-shaped, and time decay.
On this page
- The example journey we’ll use
- Quick reference: all 7 models on the example journey
- 1. Last Touch Attribution
- When to use it
- When NOT to use it
- 2. First Touch Attribution
- When to use it
- When NOT to use it
- 3. Last Non-Direct Attribution
- When to use it
- When NOT to use it
- 4. First Non-Direct Attribution
- When to use it
- When NOT to use it
- 5. Linear Attribution
- When to use it
- When NOT to use it
- 6. Position-Based (U-Shaped) Attribution
- When to use it
- When NOT to use it
- 7. Time Decay Attribution
- When to use it
- When NOT to use it
- Side-by-side: same journey, all 7 models
- What this looks like in SourceLoop
- Which model should you actually pick?
- How to switch models in SourceLoop
- What’s next
If you’ve ever tried to explain marketing performance in a meeting that includes a paid-acquisition lead AND a content marketer, you’ve felt the attribution-model problem. Paid wants credit for any conversion their ads touched. Content wants credit for the blog post that started the journey. Both are partially right. The attribution model is the rule that decides how partial.
This guide walks through the seven models SourceLoop supports, applies the same journey to all seven so you can see the difference at a glance, and tells you which to pick for which decision.
The example journey we’ll use
To make the seven models concrete, we’ll use the same customer journey throughout this article:
| Day | Action | Channel | Touch # |
|---|---|---|---|
| Day 1 | Saw Meta ad and clicked through | Meta (paid social) | 1 |
| Day 4 | Searched Google for your brand | Google (organic search) | 2 |
| Day 7 | Clicked link in newsletter | 3 | |
| Day 14 | Converted to paid plan | , | , |
Three marketing touches over a week, one conversion on Day 14. Every model below will assign credit to those three touches differently.
Quick reference: all 7 models on the example journey
| Model | Family | Meta (T1) | Google (T2) | Email (T3) | Best for |
|---|---|---|---|---|---|
| 1. Last Touch | Single-touch | 0% | 0% | 100% | Paid bidding, short cycles |
| 2. First Touch | Single-touch | 100% | 0% | 0% | Brand and top-of-funnel reporting |
| 3. Last Non-Direct | Single-touch | 0% | 0% | 100% | Daily reporting, GA-compatible |
| 4. First Non-Direct | Single-touch | 100% | 0% | 0% | Top-of-funnel for established brands |
| 5. Linear | Multi-touch | 33% | 33% | 33% | Cross-channel assist credit |
| 6. Position-Based (U-Shaped) | Multi-touch | 40% | 20% | 40% | Balanced reporting, B2B funnels |
| 7. Time Decay | Multi-touch | ~13% | ~30% | ~57% | Long sales cycles, considered purchases |
The seven models split into two families: single-touch (one channel gets 100%) and multi-touch (credit is split across the journey). Each is explained in detail below.
1. Last Touch Attribution
The rule: 100% of the credit goes to the last marketing touch before the conversion.
Applied to our example:
Meta ad      (Day 1, T1)  ░░░░░░░░░░░░░░░░░░░░  0%
Google       (Day 4, T2)  ░░░░░░░░░░░░░░░░░░░░  0%
Newsletter   (Day 7, T3)  ████████████████████  100%
                                                 ↑ all credit here
When to use it
- Paid acquisition bidding: Google Ads and Meta’s bidding algorithms expect last-click signals. Sending Last Touch conversions back is what makes their auctions train correctly.
- High-intent, short-cycle conversions: for impulse purchases or single-session conversions, the last touch usually IS the touch that mattered.
- Quick efficiency comparisons: “which channel produced the most last-touch conversions this week?” is a fast, defensible answer.
When NOT to use it
- B2B or SaaS with long sales cycles: Last Touch credits the final email or Google search, ignoring all the brand-building that made the prospect ready to convert.
- When debating whether to keep a top-of-funnel channel: Last Touch will always make discovery channels look weak, even when they’re driving the eventual conversions.
2. First Touch Attribution
The rule: 100% of the credit goes to the first marketing touch in the journey.
Applied to our example:
Meta ad      (Day 1, T1)  ████████████████████  100%
                                                 ↑ all credit here
Google       (Day 4, T2)  ░░░░░░░░░░░░░░░░░░░░  0%
Newsletter   (Day 7, T3)  ░░░░░░░░░░░░░░░░░░░░  0%
When to use it
- Top-of-funnel investment decisions: First Touch is the only honest way to defend brand campaigns, paid social discovery, SEO content, and PR. These channels rarely convert on the last click, but the conversion wouldn’t exist without them.
- Audience-discovery analysis: “which channel originally found our best customers?” is a First Touch question.
- Content marketing reporting: blog posts and pillar content are first-touch assets by design.
When NOT to use it
- Optimising paid-search bidding: First Touch will tell you to invest in awareness when you may need closing efficiency now.
- For short single-session journeys: when the customer converts on their first visit, First Touch and Last Touch are the same thing.
3. Last Non-Direct Attribution
The rule: 100% of the credit goes to the last non-Direct touch. If the final session before conversion was a Direct visit (the visitor typed your URL or clicked a bookmark), skip it and credit the marketing touch before it.
This is Google Analytics’ default model and SourceLoop’s recommended default, because Direct visits usually aren’t a marketing channel.
Applied to our example (no Direct touches in the journey, so identical to Last Touch):
Meta ad      (Day 1, T1)  ░░░░░░░░░░░░░░░░░░░░  0%
Google       (Day 4, T2)  ░░░░░░░░░░░░░░░░░░░░  0%
Newsletter   (Day 7, T3)  ████████████████████  100%
The difference shows up when there IS a Direct touch:
Meta ad      (Day 1, T1)  ░░░░░░░░░░░░░░░░░░░░  0%
Google       (Day 4, T2)  ░░░░░░░░░░░░░░░░░░░░  0%
Newsletter   (Day 7, T3)  ████████████████████  100% ← Last Non-Direct credits here
Direct       (Day 10, T4) ░░░░░░░░░░░░░░░░░░░░  0% ← Last Touch would credit this instead
When to use it
- GA-compatible reporting: numbers line up with what your team sees in Google Analytics
- Default everyday view: for most marketing-mix decisions, more honest than Last Touch because brand-recall direct visits don’t deserve credit
- Brands with lots of repeat / Direct traffic: particularly useful when your Direct percentage is high
When NOT to use it
- When you specifically want to measure brand recall: turning a paying customer into a direct-return visitor IS a marketing outcome; this model hides it.
4. First Non-Direct Attribution
The rule: 100% of the credit goes to the first non-Direct touch. Same logic as Last Non-Direct, but at the start of the journey.
Applied to our example (no Direct touches, so identical to First Touch):
Meta ad      (Day 1, T1)  ████████████████████  100%
Google       (Day 4, T2)  ░░░░░░░░░░░░░░░░░░░░  0%
Newsletter   (Day 7, T3)  ░░░░░░░░░░░░░░░░░░░░  0%
The difference shows up when the journey starts with a Direct visit:
Direct       (Day 0, T0)  ░░░░░░░░░░░░░░░░░░░░  0%  ← First Touch would credit this
Meta ad      (Day 1, T1)  ████████████████████  100% ← First Non-Direct credits here
Google       (Day 4, T2)  ░░░░░░░░░░░░░░░░░░░░  0%
Newsletter   (Day 7, T3)  ░░░░░░░░░░░░░░░░░░░░  0%
When to use it
- Top-of-funnel reporting in established brands: many returning customers’ “first touch” is technically Direct (they’ve been to your site before). First Non-Direct credits the actual marketing channel that brought them back.
- First-touch attribution with cleaner data, like First Touch, but without Direct dominating the report.
When NOT to use it
- For brand-new audiences: if your customer base is mostly first-time visitors, First Touch and First Non-Direct produce nearly identical results.
5. Linear Attribution
The rule: Credit is split equally across every touch in the journey.
Applied to our example (3 touches, so each gets 33.3%):
Meta ad      (Day 1, T1)  ███████░░░░░░░░░░░░░  33%
Google       (Day 4, T2)  ███████░░░░░░░░░░░░░  33%
Newsletter   (Day 7, T3)  ███████░░░░░░░░░░░░░  33%
If the journey had 5 touches, each would get 20%. If 10 touches, each would get 10%.
When to use it
- Cross-channel assist credit: when you want to show that every channel contributed something, without arguing about which contributed more
- As a sanity check against single-touch models: if Last Touch says a channel produced 50% of conversions and Linear says 18%, the difference is the credit it was over-claiming
- Executive summaries: Linear is the easiest multi-touch model to explain in a meeting
When NOT to use it
- For ad-platform bidding signals: Google Ads and Meta won’t optimise well off Linear conversions
- When recency genuinely matters more: Linear weights a social impression three weeks ago the same as an email click 24 hours before conversion
6. Position-Based (U-Shaped) Attribution
The rule: 40% to the first touch, 40% to the last touch, 20% split across the middle touches.
Applied to our example (3 touches, so middle gets all 20%):
Meta ad      (Day 1, T1)  ████████░░░░░░░░░░░░  40%   ← first touch
Google       (Day 4, T2)  ████░░░░░░░░░░░░░░░░  20%   ← middle
Newsletter   (Day 7, T3)  ████████░░░░░░░░░░░░  40%   ← last touch
The name comes from the credit shape: big at both ends, smaller in the middle. The thinking is that the first touch (discovery) and the last touch (close) are the two structurally important moments; middle touches mostly serve to keep the lead warm.
When to use it
- Balanced top-of-funnel + closing reporting: a fair compromise for teams that want to credit both discovery channels and closing channels meaningfully
- B2B sales reporting: the U-shape matches how most B2B funnels feel: discovery moment, long middle of nurture, closing moment
- Marketing-mix decisions involving cuts: harder to defend cutting purely-middle channels, harder to over-credit pure-closing channels
When NOT to use it
- For single-touch and two-touch journeys: if there are no middle touches, Position-Based degenerates into 50/50 or 100% single-touch
- For very long sales cycles: Time Decay is usually a better fit
7. Time Decay Attribution
The rule: Credit is weighted by recency. The closer a touch is to the conversion, the more credit it gets. SourceLoop uses exponential decay with a 7-day half-life: a touch 7 days before conversion gets half the credit of a touch on the same day.
Applied to our example (conversion on Day 14):
Meta ad      (Day 1,  13 days out)  ███░░░░░░░░░░░░░░░░░  ~13%
Google       (Day 4,  10 days out)  ██████░░░░░░░░░░░░░░  ~30%
Newsletter   (Day 7,  7 days out)   ███████████░░░░░░░░░  ~57%
                                                            ↑ closest to conversion
The 7-day half-life means:
| Days before conversion | Credit weight (relative) |
|---|---|
| 0 days (same day) | 100% |
| 7 days | 50% |
| 14 days | 25% |
| 21 days | 12.5% |
| 28 days | 6.25% |
So even a touch 4 weeks out still gets some credit, just much less than recent touches.
When to use it
- Long B2B / SaaS sales cycles: when journeys span weeks or months, Time Decay correctly reflects that the touch from yesterday is more relevant than the touch from a month ago
- High-consideration ecommerce: for purchases involving multiple research sessions, Time Decay credits late-funnel research moments over early-funnel discovery
- As a smarter Last Touch: Time Decay is essentially Last Touch with grace for very recent assists. Fairer when the last week of touches all matter, not just the final click.
When NOT to use it
- For short single-session conversions: if most journeys are same-day, Time Decay collapses to Last Touch
- When measuring top-of-funnel investment: Time Decay will always under-credit the discovery touch from weeks ago
Side-by-side: same journey, all 7 models
The headline comparison from earlier, repeated here as a take-home reference:
| Model | Meta (T1, Day 1) | Google (T2, Day 4) | Email (T3, Day 7) |
|---|---|---|---|
| Last Touch | 0% | 0% | 100% |
| First Touch | 100% | 0% | 0% |
| Last Non-Direct | 0% | 0% | 100% |
| First Non-Direct | 100% | 0% | 0% |
| Linear | 33% | 33% | 33% |
| Position-Based (U-Shaped) | 40% | 20% | 40% |
| Time Decay | ~13% | ~30% | ~57% |
Notice how the same conversion produces wildly different stories:
- Under Last Touch, the campaign is “Newsletter wins, kill Meta and Google”.
- Under First Touch, the campaign is “Meta is the hero, Newsletter and Google just happened to be in the way”.
- Under Position-Based, “discovery and closing both matter, the middle is supporting”.
- Under Time Decay, “the last week of touches mostly drove this, the Meta impression two weeks back contributed something but barely”.
All four are technically correct. The right one depends on what you’re deciding.
What this looks like in SourceLoop
Every report in SourceLoop that credits conversions has an attribution model picker in the controls bar under the report’s title. Most reports start on Last touch, and you can change it or tick several models at once.
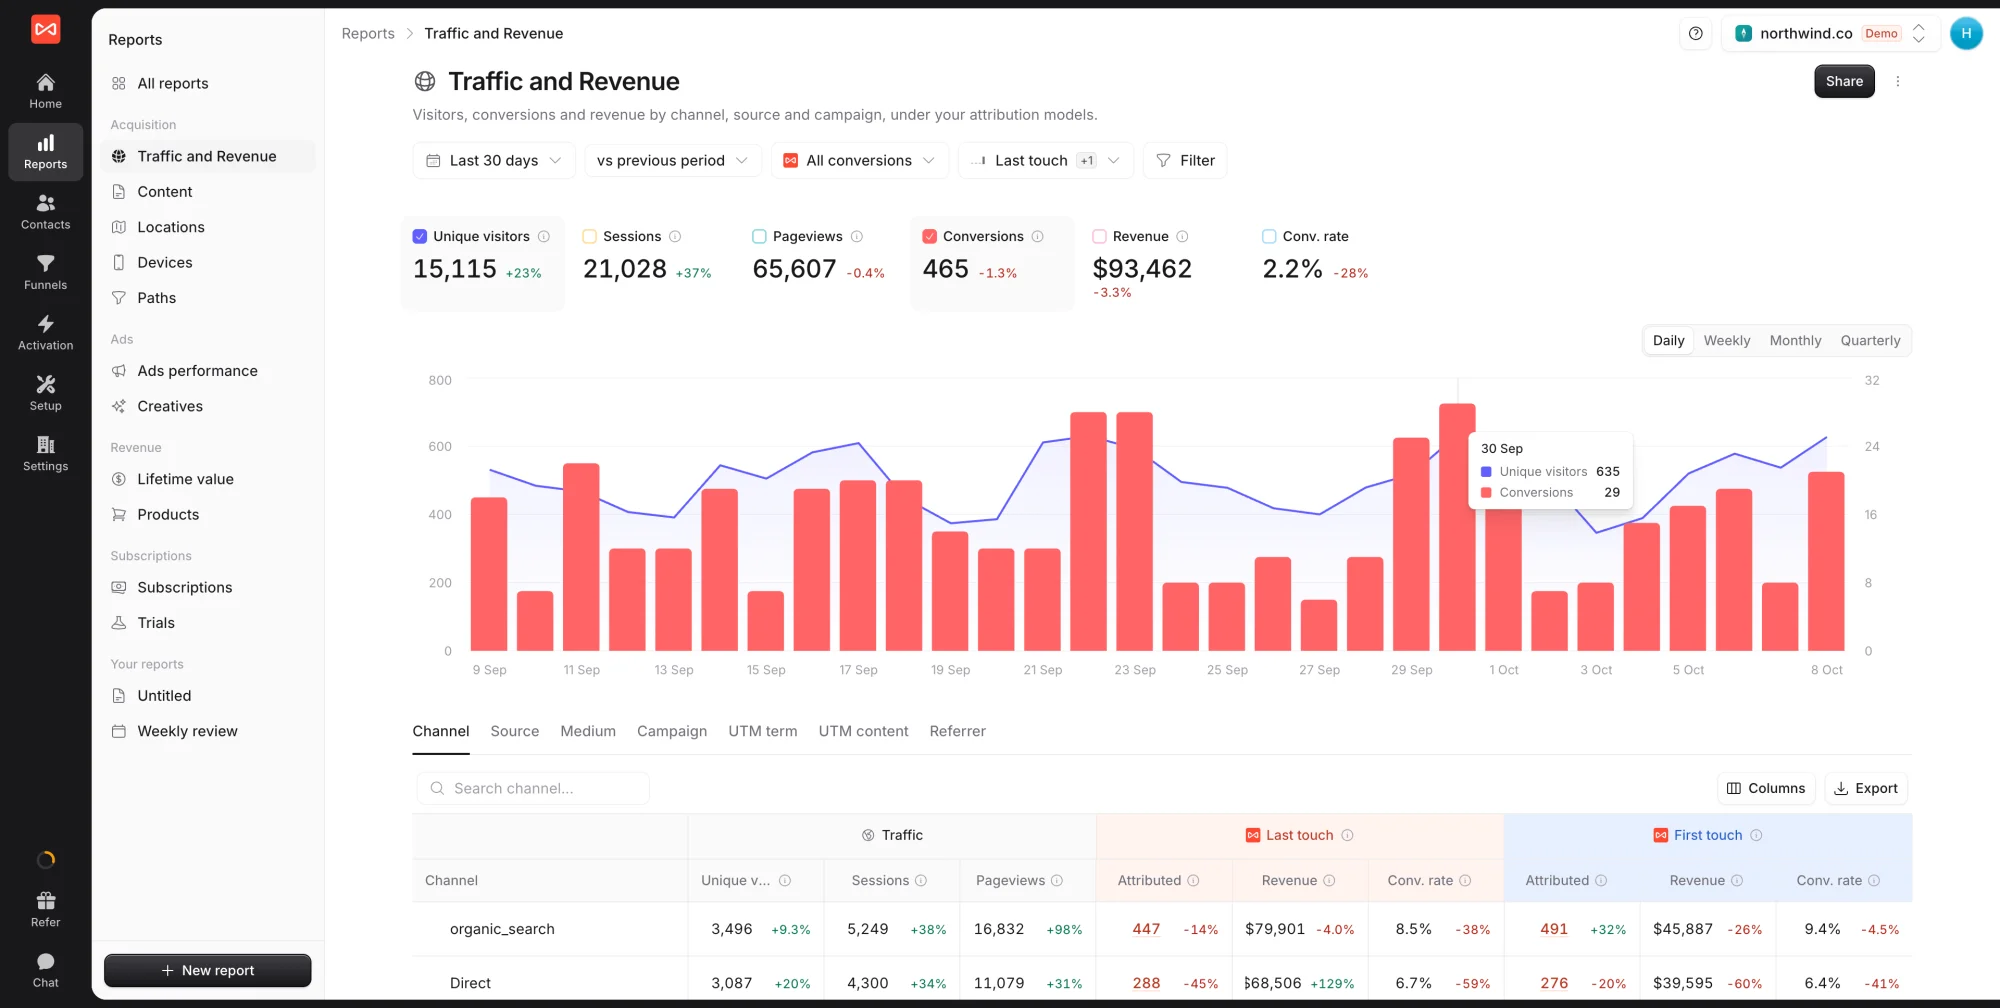
The selector is the same control across the Traffic and Revenue, Content, Locations, Devices, Ads performance, Creatives, and Spend reports. Picking a different model rebuilds every number on the page (the metric tiles, the chart, the breakdown table) under the rules of the model you picked.
To compare two models in the same view, tick a second model in the picker. The breakdown table will split each metric column per model so you can see Last Touch and First Touch credit side by side for the same campaigns. The numerical gap between the two columns is your assist value.
Which model should you actually pick?
For most teams the answer isn’t a single model. It’s which model for which question.
| Decision you’re making | Model to use |
|---|---|
| Bidding signal for Google Ads, Meta, TikTok | Last Touch (or Last Non-Direct) |
| Quarterly executive update | Position-Based or Linear |
| Content / SEO reporting | First Touch or First Non-Direct |
| ”Should we cut this channel?” debate | Compare Last Touch + Linear side by side |
| Long B2B sales cycle reporting | Time Decay |
| Default everyday view | Last Non-Direct (matches GA) |
The Traffic and Revenue, Content, Locations, Devices, and Ads performance reports in SourceLoop all support several models at once via the model selector. The cleanest workflow is to stack two models in the same view, the gap between their columns is the actual answer to “how much of this channel is direct conversion vs assist”.
How to switch models in SourceLoop
On any of these reports:
- Open the model picker in the controls bar. Each model has a one-line explanation under its name.
- Tick a second or third model to add it alongside the current one.
- The table gets one colour-coded group of columns per model, so a single table can show Last touch, First touch, and Linear credit side by side.
- Untick a model to remove it.
The model applies to Conversions counts, Revenue totals, and derived metrics (CPA, ROAS). Switching models changes every credited number in the report: the cards, the chart, the table, and the totals.
What’s next
- See the reports where these models apply:
- See the actual touch sequences multi-touch models work on: Paths report
Frequently asked questions
-
What's an attribution model?
A rule for splitting credit when one conversion is preceded by multiple marketing touches. A customer might see your Meta ad, then search Google, then click a newsletter link before buying. An attribution model decides which of those three touches deserves credit. Different models give different answers; the choice depends on the decision you're making.
-
What's the difference between single-touch and multi-touch attribution?
Single-touch gives 100% credit to one touchpoint, either the first or the last. Multi-touch splits credit across every touch in the journey using a weighting rule. Single-touch is simpler and matches what ad platforms expect; multi-touch is more honest about how marketing actually works, but harder to defend cleanly to a single channel.
-
Which attribution model should I use?
Depends on the decision. For paid bidding signals, Last Touch. For brand awareness justification, First Touch. For everyday reporting that matches Google Analytics, Last Non-Direct. For honest cross-channel credit, Linear. For balancing top and bottom of funnel, Position-Based (U-Shaped). For long sales cycles where recency matters, Time Decay.
-
Does my attribution model affect the numbers in Google Ads or Meta dashboards?
No. Each ad platform applies its own model to the conversions you send back to it. Your SourceLoop model affects SourceLoop reports and the conversion data pushed back, but the platform's UI still reports under its own rules.
-
Why does Google Analytics use Last Non-Direct as the default?
Because Direct visits usually aren't a marketing channel, they're someone typing your URL or clicking a bookmark. Crediting the marketing touch before the Direct visit is more useful than crediting Direct itself. SourceLoop defaults to Last Non-Direct for the same reason.
-
Can I look at one campaign under multiple attribution models at the same time?
Yes. SourceLoop's model selector supports stacking multiple models in the same view, so you'll see Last Touch credit alongside First Touch credit (or however many others you add) for the same campaign in the same table. The gap between columns is the assist value.

 Paid Social


