
Automate SEO Reporting: Your 2026 Playbook for Revenue
Automate SEO reporting in 2026. Get a step-by-step playbook to connect data, build dashboards, and drive revenue from your SEO efforts.
Automated SEO reporting pulls data from Google Search Console, Google Analytics, and other sources into scheduled dashboards that update themselves. Instead of spending hours each month copying numbers into spreadsheets, you set up the connections once and receive reports automatically.
The average marketing team spends 10-15 hours monthly on manual reporting. Automation eliminates that work while reducing errors and ensuring stakeholders see consistent, up-to-date metrics.
What Is Automated SEO Reporting?
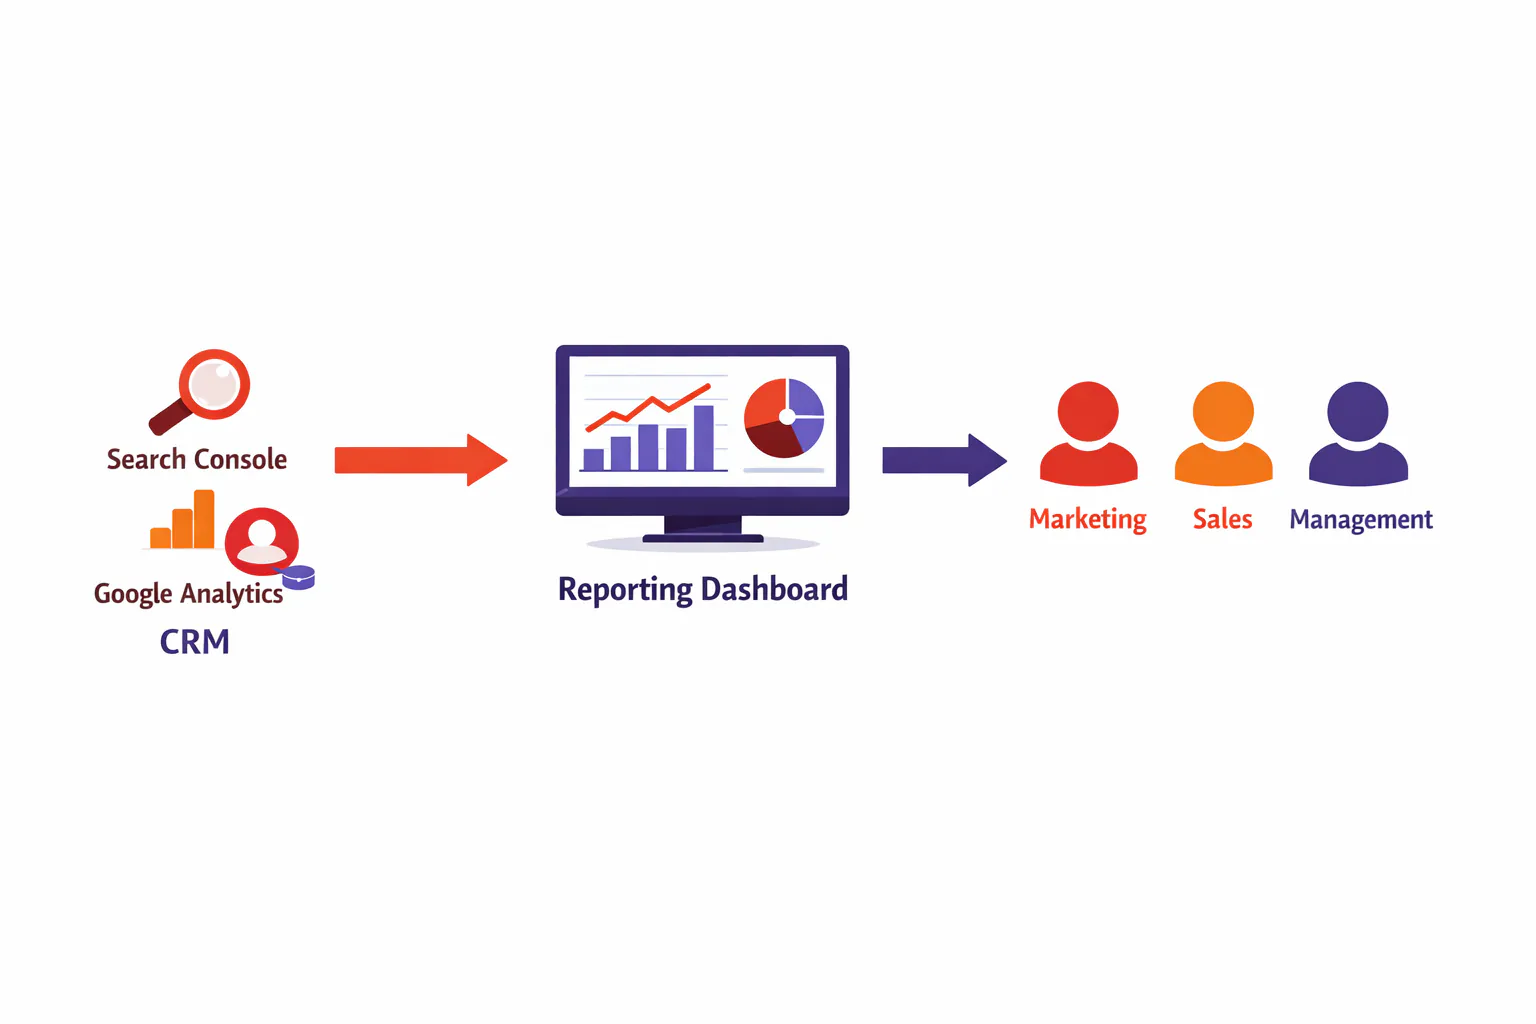
Automated SEO reporting uses software to collect, organize, and deliver SEO performance data on a schedule without manual intervention. The system connects to your data sources, Google Search Console, Google Analytics, rank trackers, and other SEO tools, then compiles the metrics into dashboards or PDF reports that update daily, weekly, or monthly.
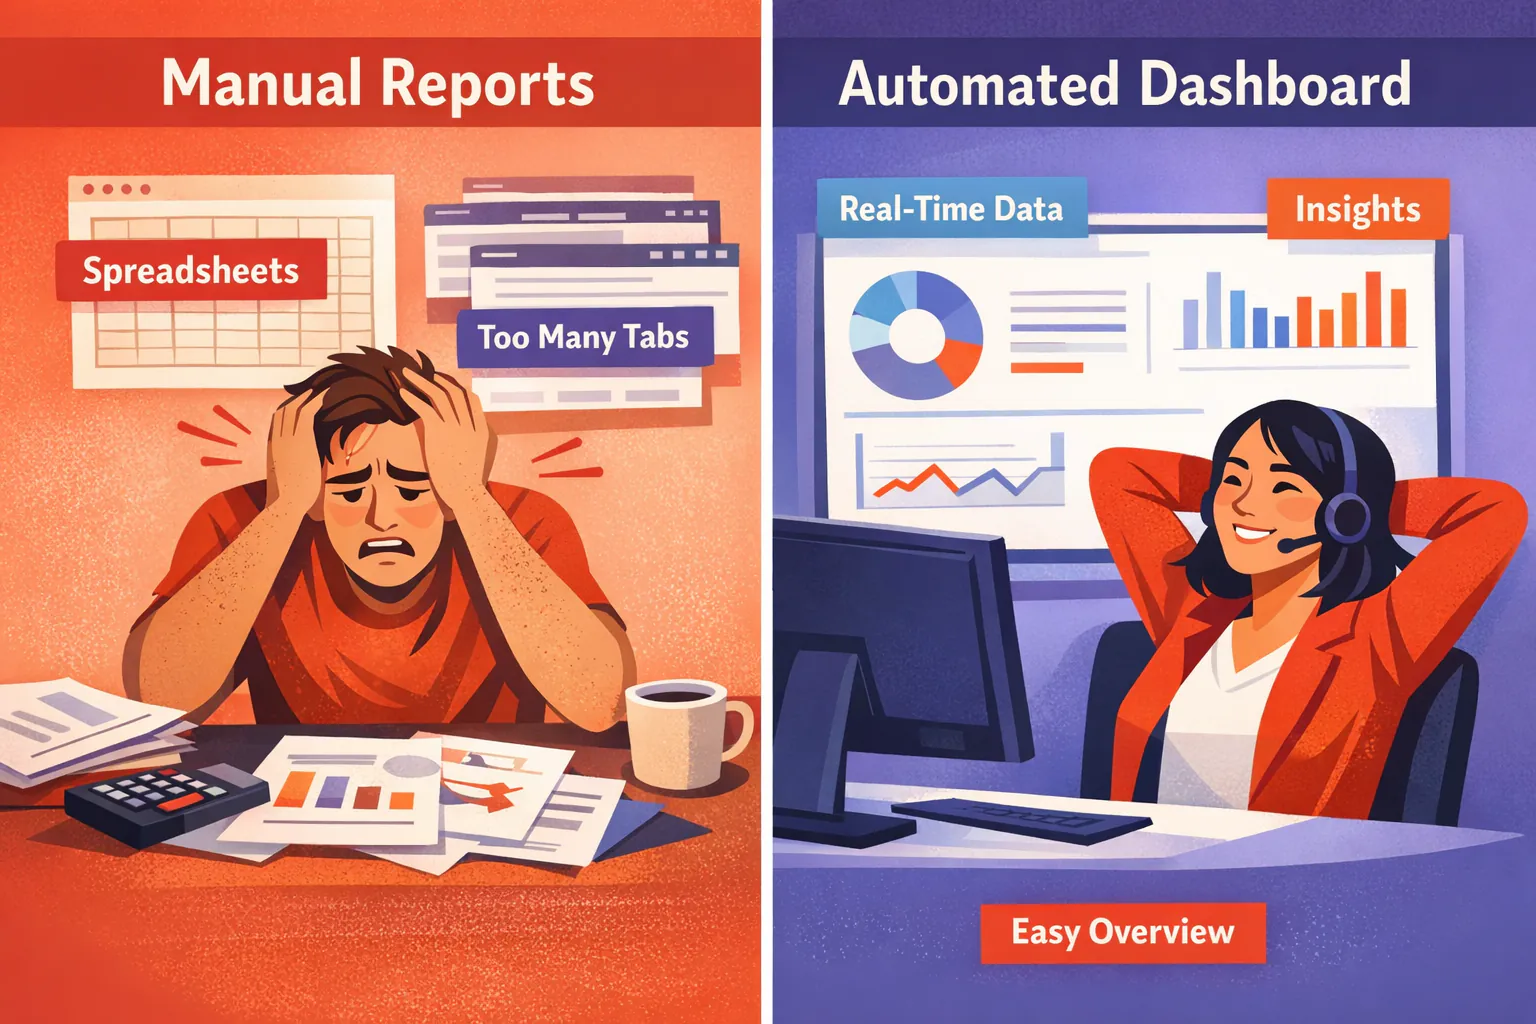
Traditional reporting requires someone to log into multiple platforms, export data, paste it into spreadsheets, create charts, and format everything for presentation. Automated systems handle all of that through API connections and pre-built templates.
The automation doesn't just save time. It ensures every report uses the same methodology, pulls from the same date ranges, and presents data consistently. When three different people create manual reports, you often get three different numbers for the same metric.
Core SEO Metrics to Include in Automated Reports
The best automated reports track metrics that connect to business outcomes, not just vanity numbers. Here's what to include:
1. Organic Traffic and User Behavior
Organic sessions from Google Analytics show how many people arrived from search engines. Track this alongside bounce rate, pages per session, and average session duration to understand whether that traffic engages with your content.
Don't stop at sessions. Track new vs. returning users to see whether your SEO attracts fresh audiences or relies on repeat visitors.
2. Keyword Rankings and Visibility
Monitor rankings for your target keywords, but focus on keyword rank changes over time rather than absolute positions. A keyword moving from position 12 to position 6 matters more than one sitting at position 3 for six months.
Include search console data showing impressions and click-through rate for your top queries. High impressions with low CTR signals an opportunity to improve titles and meta descriptions.
3. Conversions and Revenue Attribution
This is where most SEO reports fail. They show traffic but never connect it to business outcomes.
Track goal completions from Google Analytics, form submissions, demo requests, trial signups, or purchases. Then go deeper: which organic traffic sources produce the most conversions? Which landing pages convert best?
For businesses with longer sales cycles, attribution becomes critical. You need to know which SEO efforts produced qualified leads that eventually became customers. Tools like Sourceloop connect organic traffic to CRM records, showing exactly which campaigns, keywords, and landing pages influenced each deal.
4. Technical SEO Health
Automated reports should flag technical issues before they damage rankings. Include:
Crawl errors from Google Search Console
Page speed metrics from Core Web Vitals
Mobile usability issues
Indexing status showing how many pages Google has indexed vs. how many you submitted
These metrics catch problems early. A sudden spike in crawl errors or a drop in indexed pages signals an issue that needs immediate attention.
5. Backlink Profile
Track total backlinks, referring domains, and domain authority of new links. More importantly, monitor the quality of new backlinks, one link from an authoritative site matters more than 100 links from low-quality directories.
Set up alerts for sudden drops in referring domains, which might indicate lost links or a negative SEO attack.
How to Automate SEO Reporting: Step-by-Step
Step 1: Define Your KPIs and Reporting Frequency
Start by identifying what matters to your business or clients. Don't track every possible metric, focus on the 8-12 KPIs that directly influence decisions.
For most businesses, this includes:
Organic traffic (sessions and users)
Keyword rankings for target terms
Conversion rate from organic traffic
Revenue or leads attributed to SEO
Technical health indicators
Decide how often stakeholders need reports. Executive teams typically want monthly summaries. SEO teams need weekly or daily dashboards to monitor performance and catch issues quickly.
Step 2: Connect Your Data Sources
Automated reporting requires API access to your data sources. The most common connections include:
Google Search Console: Provides impressions, clicks, average position, and CTR for your organic search queries. Every automated SEO report needs this connection.
Google Analytics (GA4): Delivers traffic, user behavior, and conversion data. Connect GA4 to see how organic visitors behave after they land on your site.
Rank tracking tools: Services like Ahrefs, SEMrush, or Moz track keyword positions across search engines. Connect these to monitor ranking changes automatically.
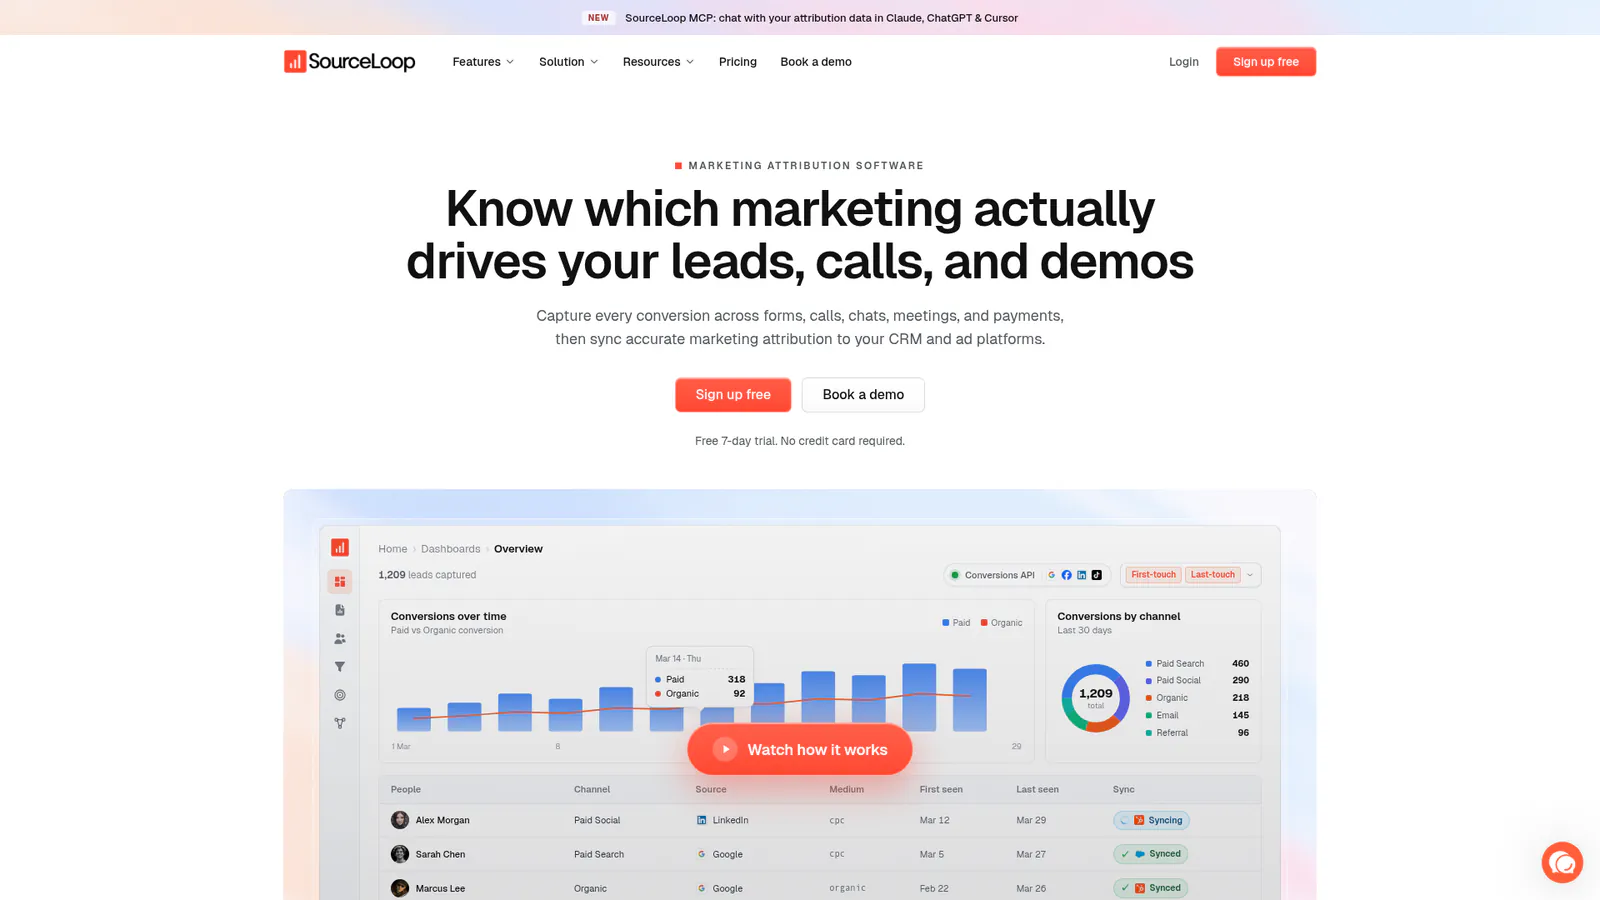
Attribution platforms: For businesses that need to connect SEO to revenue, tools like Sourceloop track the full customer journey from first click through conversion. This shows which organic campaigns produce qualified leads and closed deals, not just form fills.
Most reporting tools provide step-by-step instructions for connecting these sources. You'll typically need to authenticate with your Google account and grant API access.
Step 3: Choose Your Reporting Tool
The right tool depends on your needs, budget, and technical comfort level.
Google Looker Studio (formerly Data Studio) is free and integrates natively with Google Search Console and GA4. It's ideal for basic reporting but requires manual setup for each dashboard and offers limited automation features.
Dedicated SEO reporting platforms like DashThis, AgencyAnalytics, and Databox offer pre-built templates, automated scheduling, and white-label options for agencies. They cost $30-$150 per month depending on features and client count.
AI search visibility platforms like Orchly AI combine traditional SEO reporting with AI search monitoring.
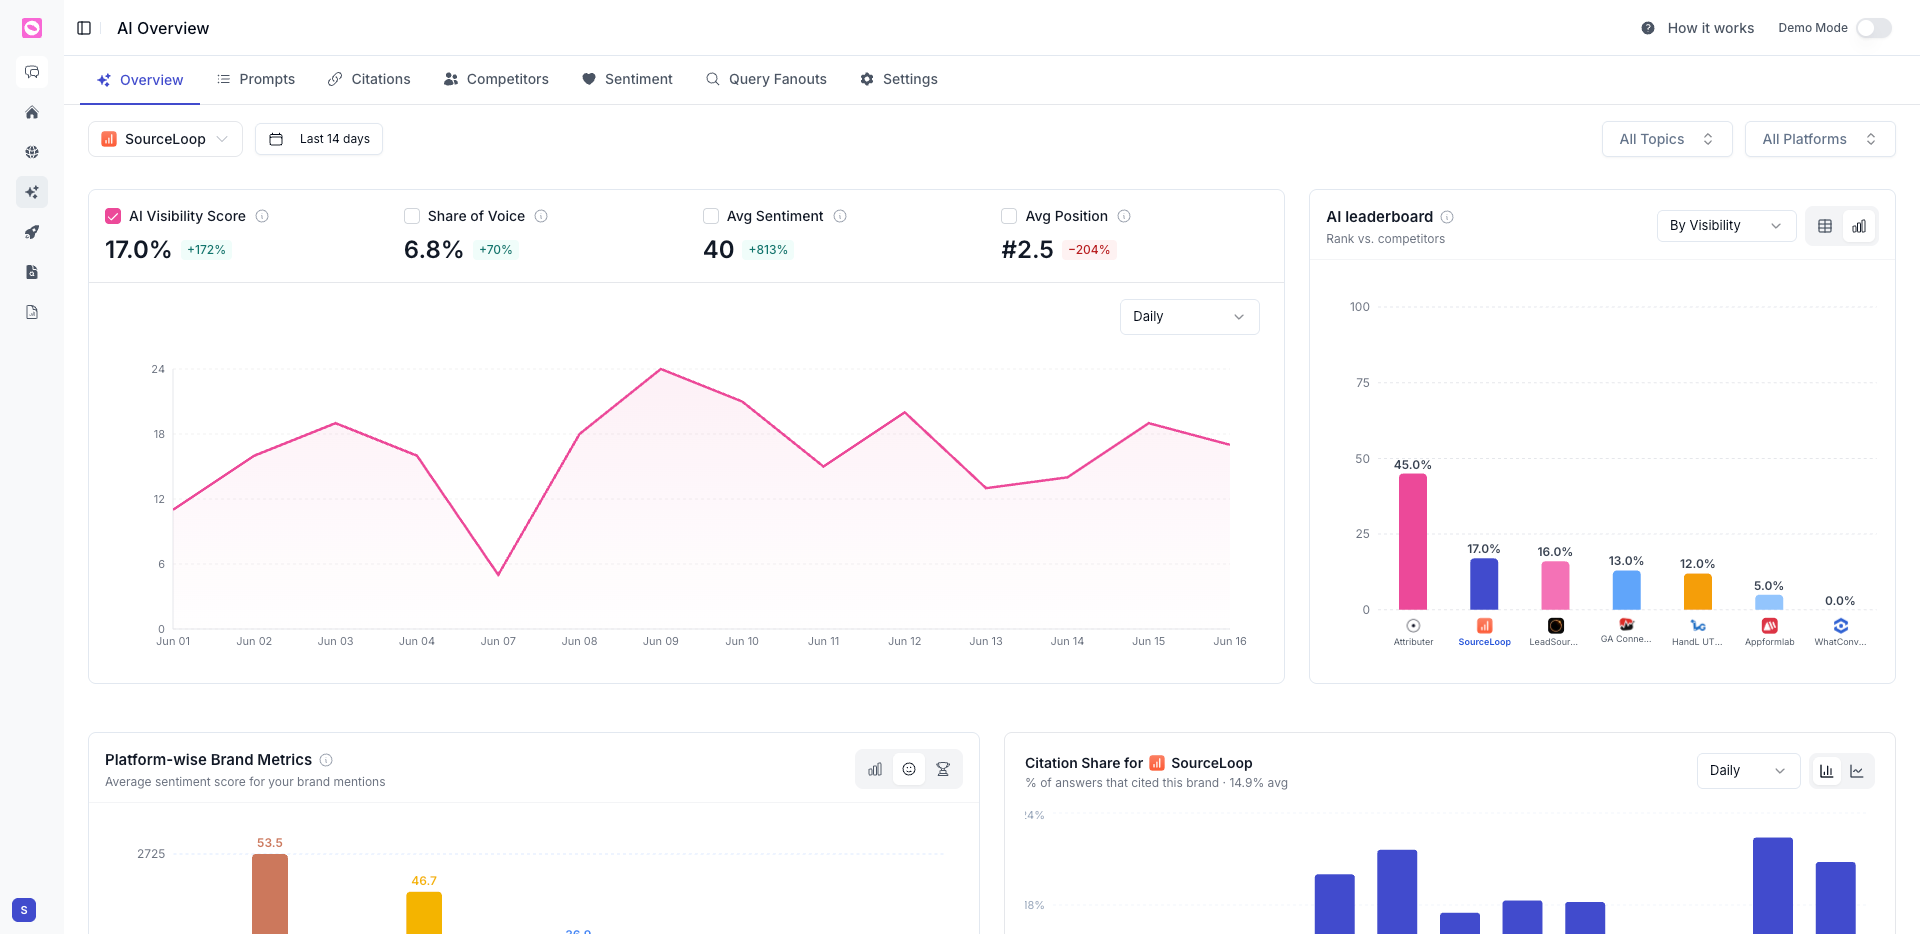
Their Report Builder compiles SEO metrics from Google Search Console and GA4 alongside AI visibility data from ChatGPT, Perplexity, and other AI platforms. This matters because AI search is becoming a significant traffic source, your reports should track both traditional and AI search performance in one place.
Attribution-focused tools like Sourceloop are essential if you need to connect SEO performance to revenue.
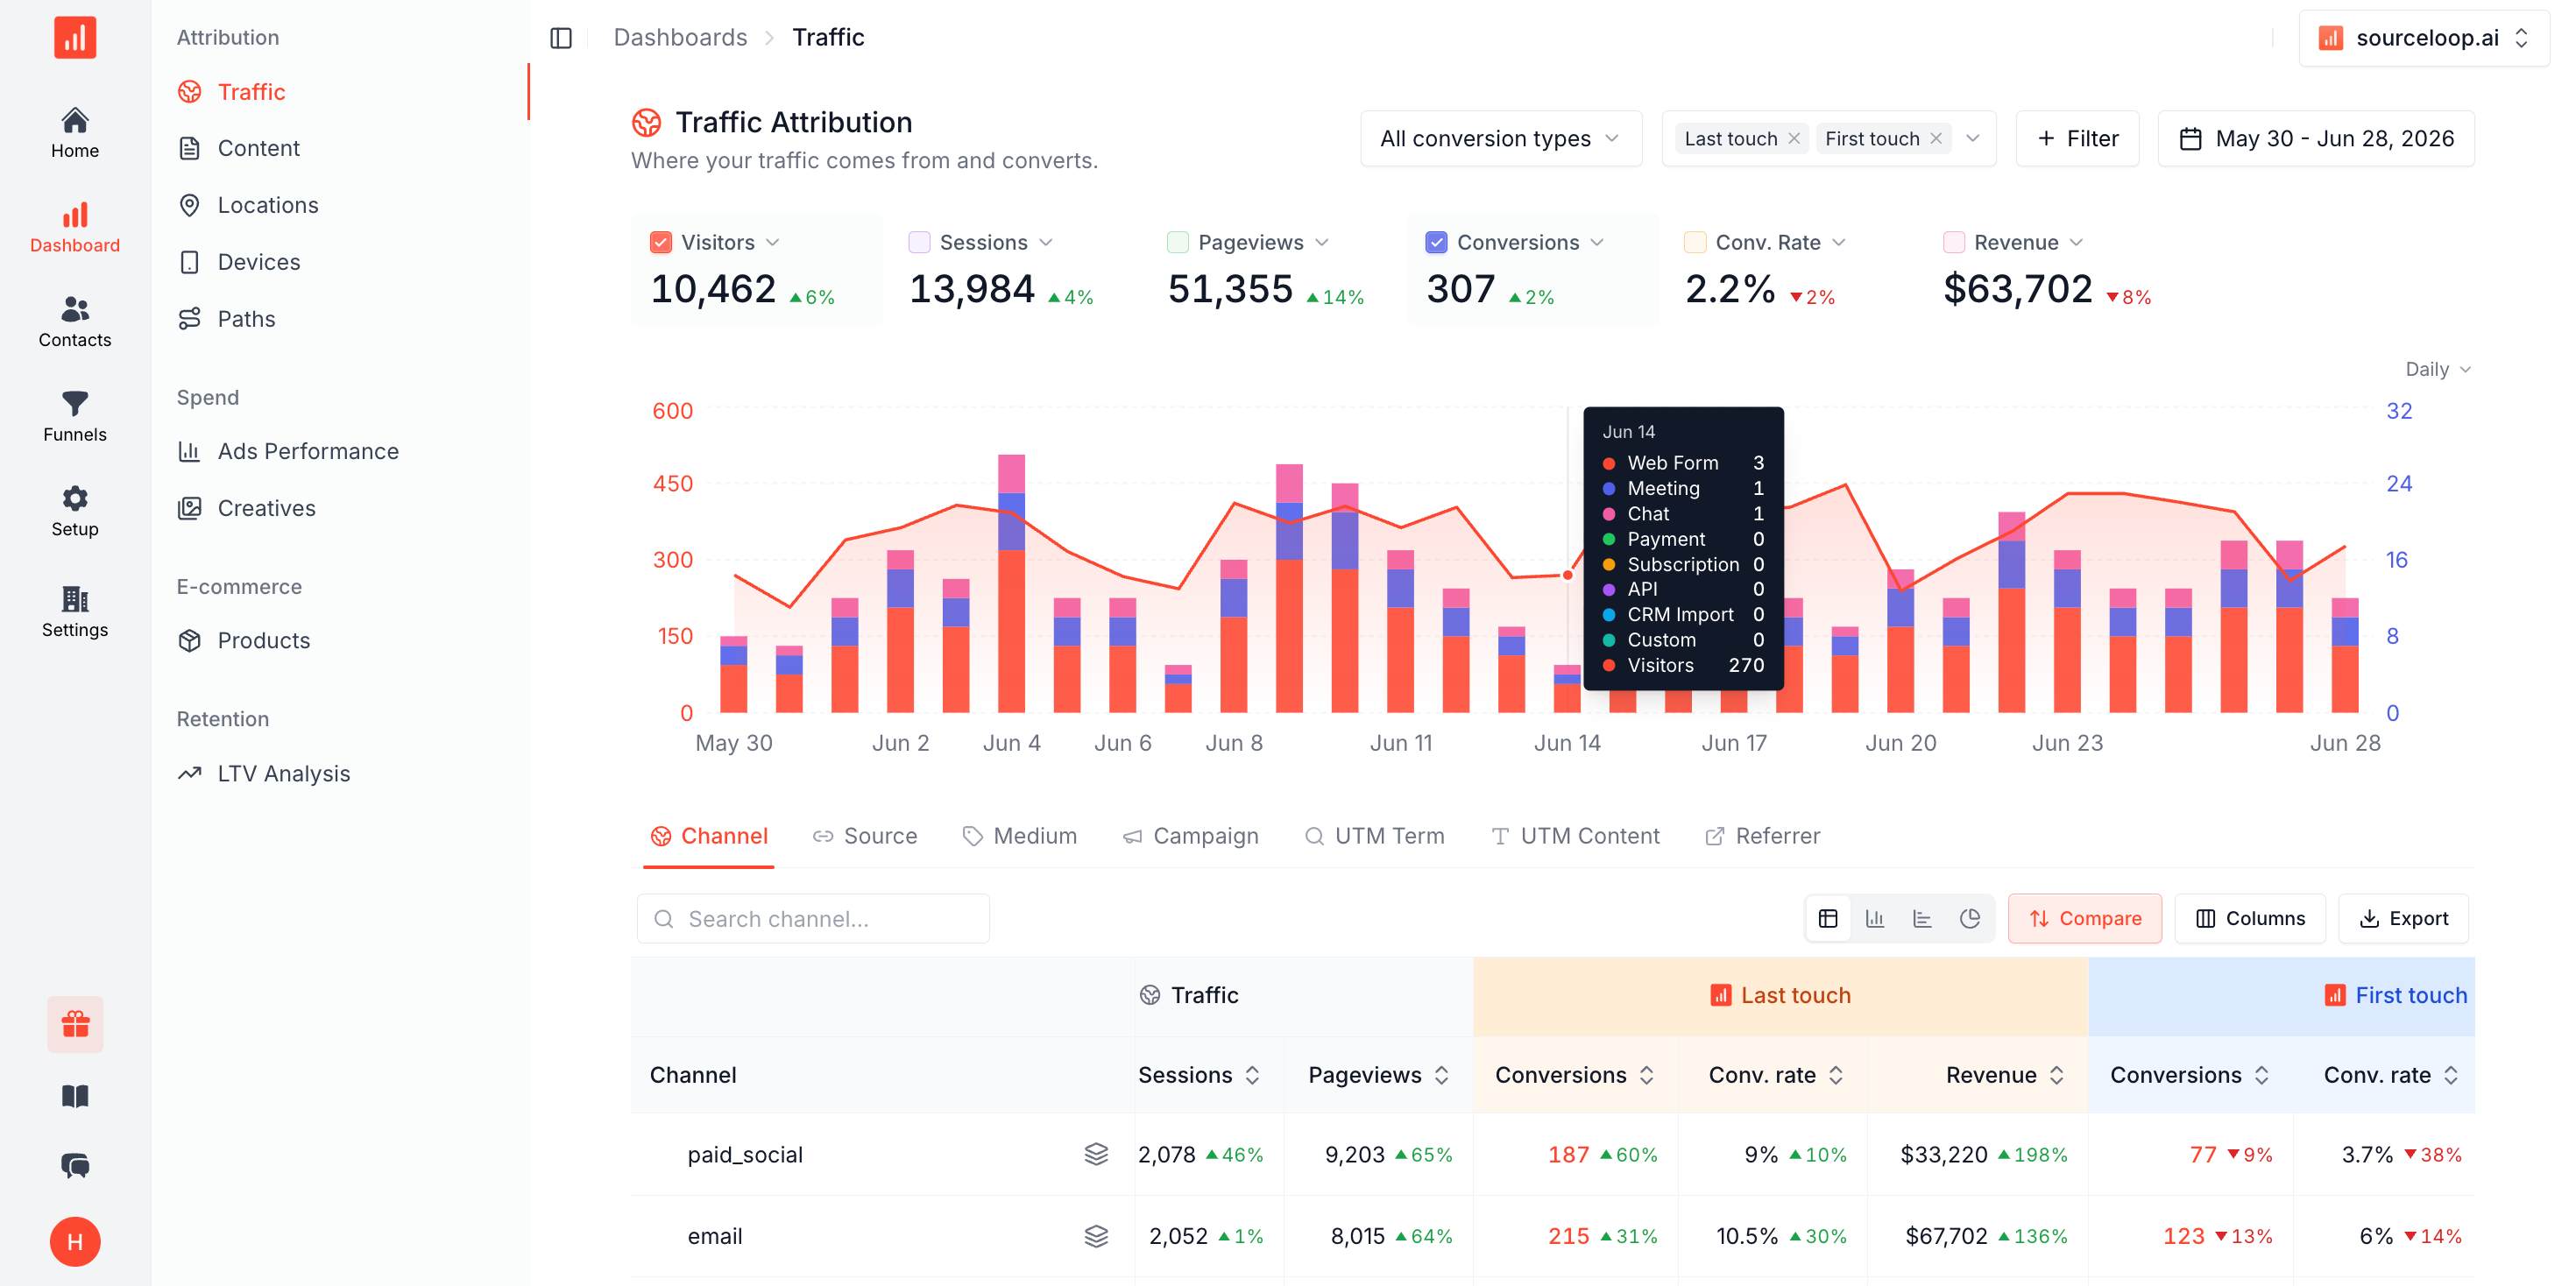
These platforms track the complete customer journey, showing which organic campaigns, keywords, and landing pages influenced each lead and customer. Instead of reporting on clicks and sessions, you report on qualified leads and closed revenue.
Step 4: Build Your Report Template
Most reporting tools offer pre-built templates, but customize them to match your KPIs. A typical automated SEO report includes:
Executive summary section:
Month-over-month traffic change
Ranking improvements for priority keywords
Conversion and revenue impact
Key wins and issues
Traffic analysis:
Organic sessions trend (line chart)
Top landing pages by traffic
Traffic by device (desktop, mobile, tablet)
Geographic breakdown if relevant
Keyword performance:
Ranking changes for target keywords
Top queries by impressions and clicks
Queries with high impressions but low CTR (optimization opportunities)
Conversion tracking:
Goal completions from organic traffic
Conversion rate by landing page
Revenue or leads attributed to SEO campaigns
Technical health:
Crawl errors and indexing issues
Core Web Vitals scores
Mobile usability problems
Backlink summary:
New referring domains
Lost backlinks
Top new backlinks by authority
Step 5: Set Up Automated Delivery
Configure your reporting tool to generate and send reports automatically. Most platforms let you:
Schedule reports daily, weekly, or monthly
Email reports to specific recipients
Generate PDF versions for stakeholders who don't need live dashboards
Create different report versions for different audiences (executive summary vs. detailed SEO team report)
Set up Slack or email alerts for critical metrics. If organic traffic drops more than 20% week-over-week or a priority keyword falls out of the top 10, you want to know immediately rather than waiting for the next scheduled report.
Step 6: Review and Refine
Automated reports aren't set-it-and-forget-it. Review them monthly to ensure they still track the metrics that matter. As your SEO strategy evolves, your reporting should evolve too.
Ask stakeholders if the reports answer their questions. If executives keep asking about metrics that aren't in the report, add them. If no one looks at a particular section, remove it.
Combining SEO and AI Search Reporting
Traditional SEO reporting only shows half the picture. AI search engines like ChatGPT, Perplexity, and Google's AI Overviews now answer millions of queries that used to drive organic traffic. If your brand isn't mentioned in those AI responses, you're invisible to a growing segment of searchers.
Modern automated reporting should track both traditional search rankings and AI search visibility. Tools like Orchly AI monitor where your brand appears in AI-generated answers across multiple platforms, showing:
Which AI platforms mention your brand and how often
Your share of voice compared to competitors in AI responses
Sentiment of AI mentions (positive, neutral, negative)
Traffic coming from AI search engines vs. traditional search
This combined view shows whether your SEO efforts improve visibility across all search channels, not just Google's traditional results. As AI search grows, this becomes increasingly critical for understanding your true organic performance.
Frequently Asked Questions
What are automated SEO reports?
Automated SEO reports are performance dashboards that pull data from Google Search Console, Google Analytics, and other SEO tools automatically, then compile it into scheduled reports without manual data entry. They save 10-15 hours monthly compared to manual reporting.
How much does automated SEO reporting cost?
Free tools like Google Looker Studio provide basic automation. Dedicated reporting platforms cost $30-$150 per month depending on features and the number of websites or clients. Enterprise solutions with advanced attribution and AI search tracking range from $125-$500+ monthly.
Can you automate SEO completely?
No. While you can automate data collection, reporting, and some optimization tasks, SEO still requires human strategy, content creation, and technical problem-solving. Automation handles repetitive tasks so humans can focus on high-value work.
What is the 80/20 rule in SEO?
The 80/20 rule (Pareto Principle) suggests that 80% of your SEO results come from 20% of your efforts. In reporting, this means focusing on the few metrics that actually drive business outcomes rather than tracking everything possible.
How often should automated SEO reports run?
Executive reports typically run monthly. SEO teams benefit from weekly or daily dashboards to monitor performance and catch issues quickly. Set up real-time alerts for critical metrics like sudden traffic drops or ranking losses.
What's the difference between automated and manual SEO reporting?
Automated reporting uses software to collect and compile data on a schedule, saving 10-15 hours monthly and eliminating human error. Manual reporting requires someone to log into multiple platforms, export data, and create reports by hand each time.
Should SEO reports include AI search visibility?
Yes. AI search engines like ChatGPT and Perplexity now answer millions of queries that used to drive organic traffic. Modern SEO reports should track both traditional search rankings and AI search visibility to show complete organic performance.
How do I connect SEO reporting to revenue?
Use attribution platforms that track the complete customer journey from first organic visit through closed deal. Tools like Sourceloop connect Google Search Console and GA4 data to your CRM, showing which organic campaigns, keywords, and landing pages influenced each customer and how much revenue they generated.



 Paid Social


