
Linear Attribution Model: A Practical Guide for 2026
Understand the linear attribution model with clear examples and formulas. Learn its pros, cons, and when to use it for better marketing decisions.

Linear attribution is a multi-touch attribution model that assigns equal credit to every marketing touchpoint in the customer journey. When a prospect clicks your LinkedIn ad, reads three blog posts, attends a webinar, and converts after a sales call, each interaction receives 20% of the conversion credit.
The model sounds fair. Every channel that touched the prospect gets recognized. But fairness and accuracy are different things. A LinkedIn ad that generated initial awareness does not have the same influence as the sales call that closed the deal. Linear attribution treats them identically.
What Is Linear Attribution?
Linear attribution is a multi-touch attribution model that divides conversion credit equally among every touchpoint a prospect engages with before converting. Unlike single-touch models that credit only the first or last interaction, linear attribution acknowledges the entire journey.
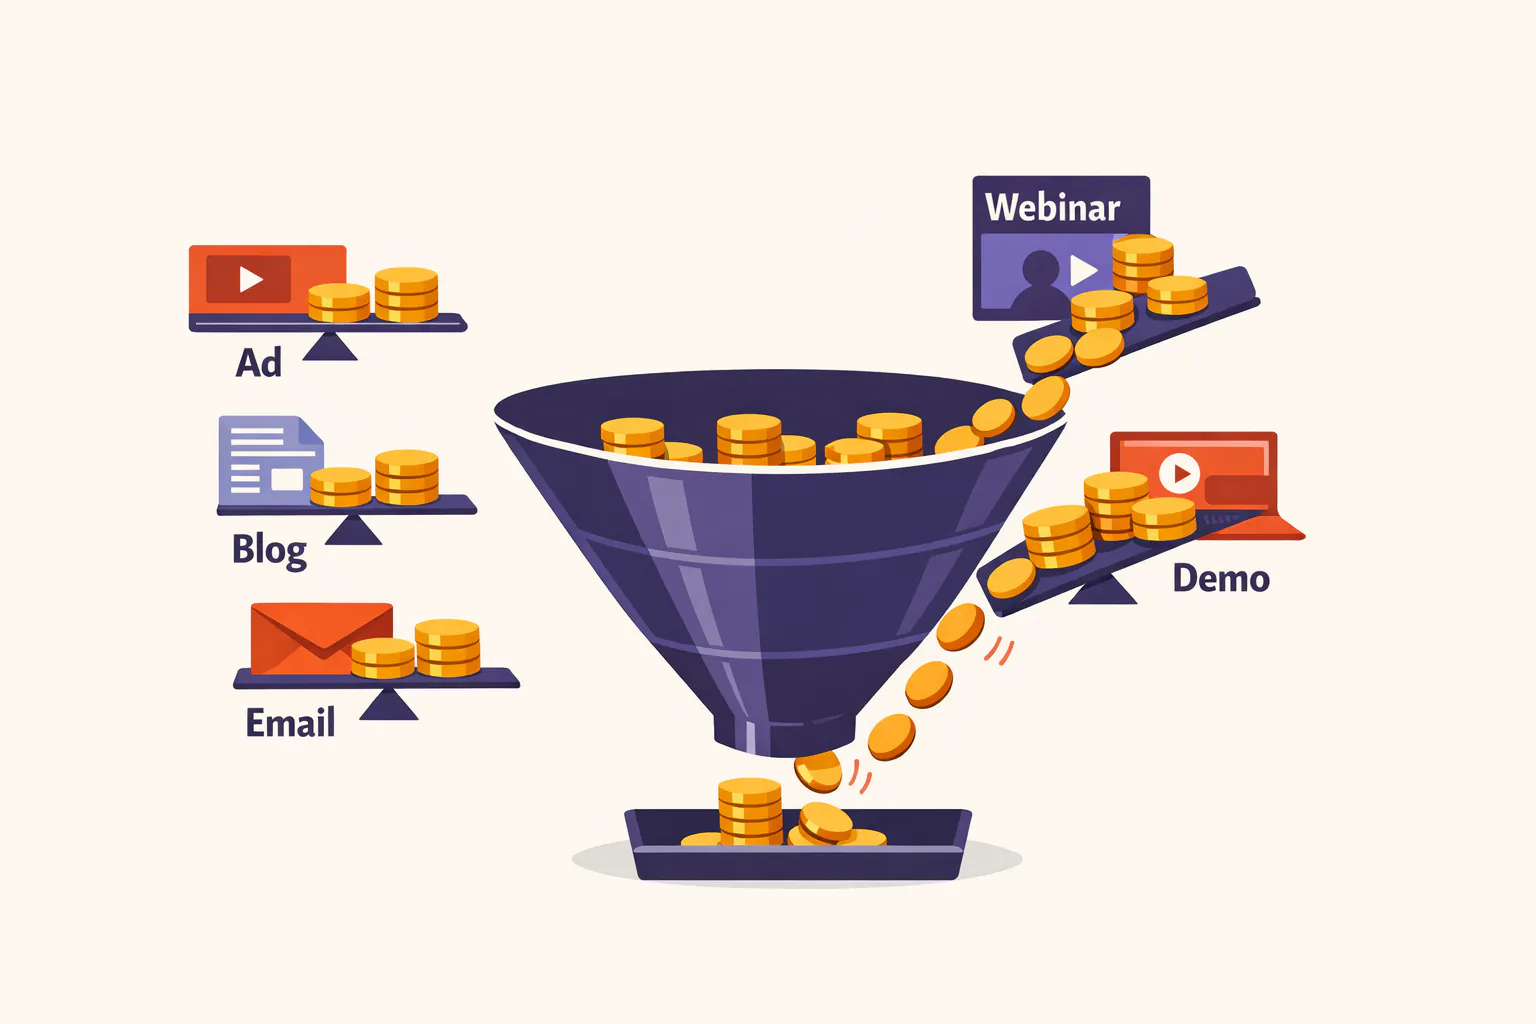
Here's how it works. Sarah discovers your B2B SaaS product through five interactions:
Clicks a Google Ads search ad (Monday)
Reads a blog post via organic search (Wednesday)
Downloads a whitepaper from an email campaign (Friday)
Attends a product webinar (next Tuesday)
Books a demo after clicking a retargeting ad (Thursday)
Under linear attribution, each touchpoint receives 20% credit for Sarah's demo booking. The Google ad, blog post, email, webinar, and retargeting ad are treated as equally influential.
The logic: every interaction contributed to the decision. Remove any single touchpoint and the conversion might not have happened. This makes linear attribution appealing for marketers who want to avoid the oversimplification of first-touch or last-touch models.
The problem: not all touchpoints influence decisions equally. A five-minute product demo has more conversion impact than a three-second social media impression. Linear attribution cannot distinguish between them.
How Linear Attribution Actually Works in Practice
Implementing linear attribution requires tracking every touchpoint, assigning equal weight, and connecting attribution data to your CRM and reporting tools.
Step 1: Touchpoint identification
The system captures every interaction a prospect has with your brand. This includes paid ads (Google, LinkedIn, Facebook), organic channels (search, social, direct), content engagement (blog posts, whitepapers, videos), email opens and clicks, webinar attendance, and sales interactions (calls, demos, meetings).
Each touchpoint needs a timestamp and source identifier. Most organizations use UTM parameters on links, tracking pixels on pages, and CRM activity logs for sales touchpoints.
Step 2: Equal credit distribution
Once a conversion occurs, the system counts the total number of touchpoints in that prospect's journey. It divides 100% by the touchpoint count and assigns that percentage to each interaction.
5 touchpoints = 20% credit each
10 touchpoints = 10% credit each
20 touchpoints = 5% credit each
The math is simple. The challenge is defining what counts as a touchpoint. Does every page view count? Only form fills? What about email opens versus clicks? These decisions dramatically affect which channels receive credit.
Step 3: Aggregation and reporting
Attribution platforms aggregate credit across all conversions to show channel-level performance. If LinkedIn generated 1,000 touchpoints across 200 conversions, and those touchpoints received an average of 15% credit each, LinkedIn's total attributed conversions would be 150 (1,000 × 0.15).
Marketing teams use this data to compare channel performance and allocate budgets. Channels with high attributed conversion counts receive more investment. Channels with low counts get cut.
This is where linear attribution creates problems. High-frequency channels (social media, display ads, content) generate many touchpoints but often have low per-touchpoint influence. Low-frequency channels (demos, sales calls, pricing pages) generate few touchpoints but have high per-touchpoint influence. Linear attribution over-credits the former and under-credits the latter.
The Budget Allocation Trap: When Linear Attribution Destroys ROI
Linear attribution looks objective. Every touchpoint gets equal credit. No favoritism. But equal credit assumes equal influence, and that assumption breaks down in predictable ways.
Trap 1: Over-investing in high-frequency, low-impact channels
A B2B SaaS company tracks attribution across 12 marketing channels. Their linear attribution report shows:
Blog content: 450 attributed conversions
LinkedIn organic: 380 attributed conversions
Email nurture: 320 attributed conversions
Retargeting ads: 180 attributed conversions
Product demos: 120 attributed conversions
Sales calls: 90 attributed conversions
The marketing team interprets this as "blog content drives the most pipeline" and doubles the content budget. Six months later, pipeline quality drops. Why?
Blog posts generate many touchpoints (every article read counts), but most readers are early-stage researchers, not buyers. Product demos and sales calls generate fewer touchpoints but convert at 10x the rate. Linear attribution made the blog look like a revenue driver when it was really an awareness channel.
The team should have increased demo capacity and sales headcount, not content production. Linear attribution led them to the wrong decision.
Trap 2: Under-valuing conversion touchpoints
An e-commerce brand runs linear attribution and sees that Instagram ads generate 40% of attributed revenue while their abandoned cart email sequence generates only 8%. They cut the email budget by 60% and shift it to Instagram.
Three months later, revenue drops 25%. The abandoned cart emails had a 35% conversion rate. Instagram ads had a 2% conversion rate. But Instagram generated 20 touchpoints per customer (impressions, clicks, retargeting) while the email sequence generated only 2 touchpoints (email open, click).
Linear attribution gave Instagram 10x more credit simply because it touched customers more frequently, not because it was more effective at driving purchases.
Trap 3: Ignoring touchpoint sequence and timing
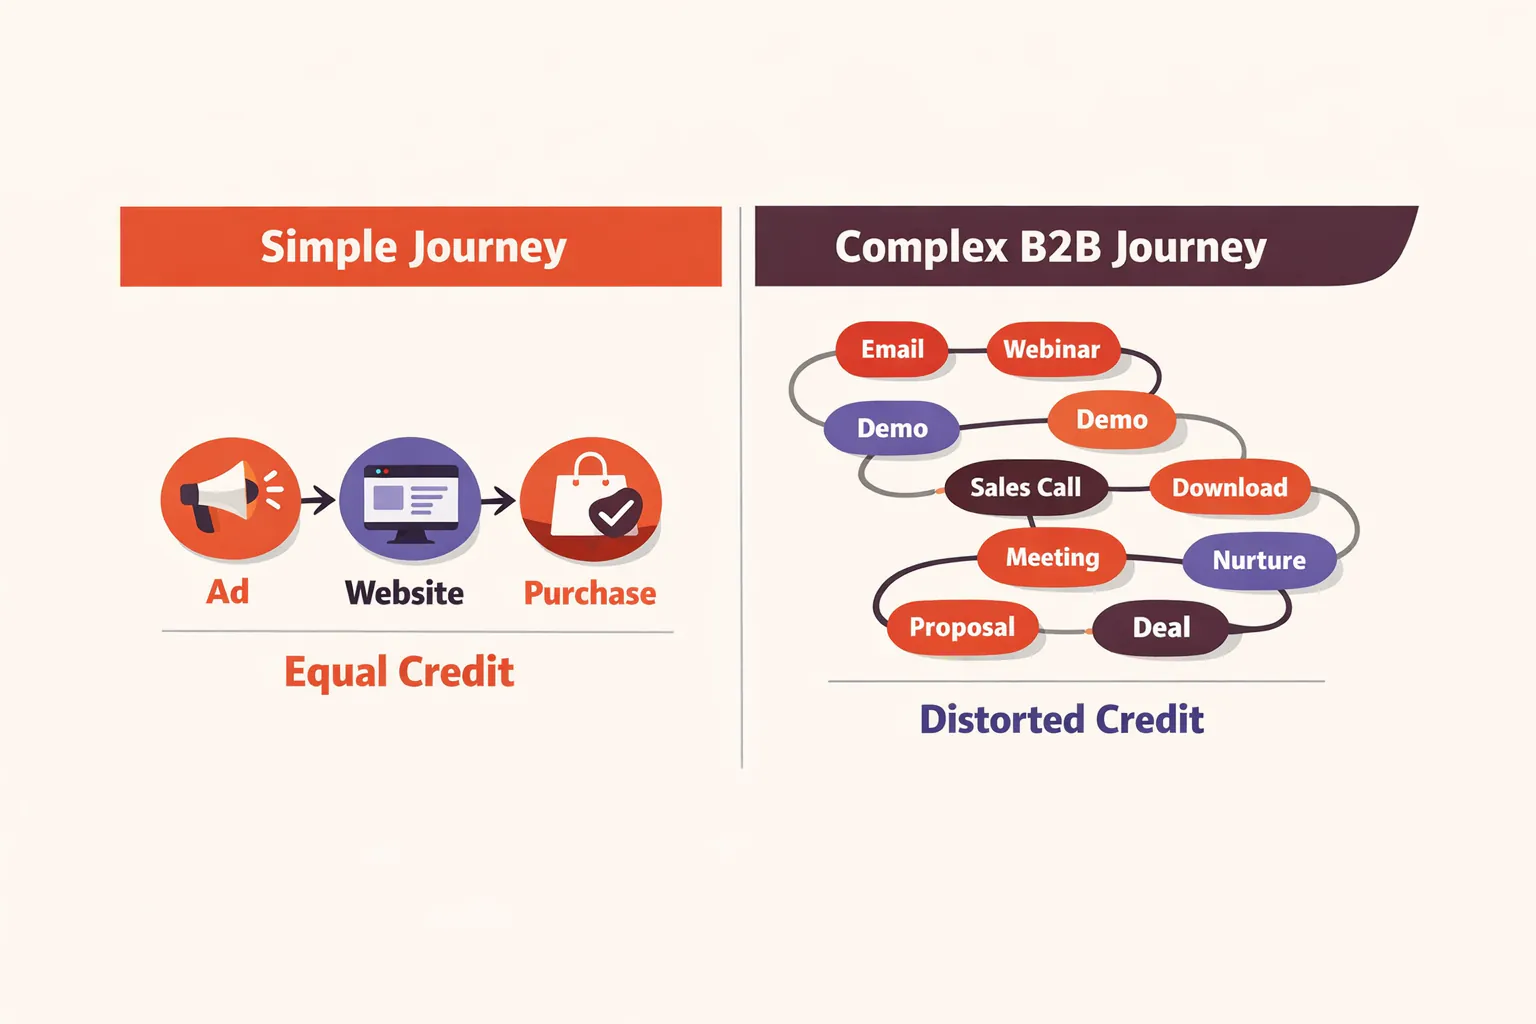
A prospect's journey looks like this:
Week 1: Sees a LinkedIn ad, clicks, reads homepage (2 touchpoints)
Week 4: Receives cold email, clicks, reads case study (2 touchpoints)
Week 8: Attends webinar, downloads slides (2 touchpoints)
Week 12: Receives pricing email, books demo, converts (3 touchpoints)
Linear attribution assigns 11.1% credit to each touchpoint. But the pricing email and demo (weeks 12) clearly had more influence on the final decision than the LinkedIn ad (week 1). The early touchpoints built awareness. The late touchpoints drove conversion.
By treating all touchpoints equally, linear attribution cannot distinguish between awareness-building and conversion-driving activities. Marketing teams optimize for touchpoint volume rather than touchpoint impact.
According to research on B2B attribution models, organizations using linear attribution as their primary model misallocate 40-50% of marketing spend in sales cycles exceeding 90 days. The error compounds over time as teams continue investing in high-frequency channels that generate touchpoints but not revenue.
When Linear Attribution Actually Works
Linear attribution is not inherently bad. It works well in specific scenarios where the equal-credit assumption aligns with reality.
Short sales cycles with balanced touchpoints (under 30 days, 3-7 interactions)
A small-ticket B2B SaaS product ($49/month, self-serve signup) sees prospects convert within 2-3 weeks through a predictable journey:
Discover via paid search or content
Sign up for free trial
Receive onboarding emails
Engage with in-app prompts
Convert to paid
Each touchpoint genuinely contributes similar value. The paid search ad generates awareness. The trial removes friction. The emails provide education. The in-app prompts drive activation. Linear attribution accurately reflects this balanced journey.
Content-heavy strategies where every interaction builds trust
A professional services firm (consulting, legal, financial advisory) relies on thought leadership to build credibility. Prospects engage with multiple content pieces before reaching out:
Read 3-5 blog posts
Download 1-2 whitepapers
Watch a webinar
Read case studies
Book a consultation
Each content interaction incrementally builds trust and expertise perception. No single piece closes the deal. The cumulative effect matters. Linear attribution captures this cumulative influence better than single-touch models.
Early-stage attribution analysis when you lack historical data
A startup launching its first marketing campaigns has no baseline for which touchpoints drive conversions. Linear attribution provides a neutral starting point. It shows which channels participate in conversions without making assumptions about which ones matter most.
After 3-6 months of data collection, the team can graduate to more sophisticated models (time-decay, position-based, data-driven) that weight touchpoints based on observed conversion patterns.
Multi-channel campaigns where you need to justify budget across teams
Marketing organizations with separate teams managing different channels (paid media, content, email, events) use linear attribution to ensure every team receives credit for conversions they touched. This prevents political battles over attribution and encourages cross-channel collaboration.
The model is not perfectly accurate, but it is politically neutral. Every team sees their contribution recognized in the data.
The Decision Framework: Should You Use Linear Attribution?
Use this framework to determine whether linear attribution fits your business model and marketing strategy.
Factor | Linear Attribution Works | Linear Attribution Fails |
|---|---|---|
Sales cycle length | Under 30 days | Over 90 days |
Touchpoints before conversion | 3-7 interactions | 15+ interactions |
Touchpoint impact variance | Similar influence across channels | High variance (demos vs. impressions) |
Marketing sophistication | Early-stage, building baseline | Mature, optimizing for ROI |
Channel mix | Balanced across awareness and conversion | Heavy on high-frequency channels (social, display) |
Primary goal | Understand full-journey participation | Optimize budget allocation for revenue |
Attribution infrastructure | Basic tracking, single platform | Advanced tracking, multi-platform |
If your business falls into the left column for most factors, linear attribution provides useful insights. If you're in the right column, you need attribution models that weight touchpoints based on their actual influence.
How to Implement Linear Attribution Correctly
Setting up linear attribution requires careful tracking configuration, clear touchpoint definitions, and integration across your marketing stack.
Step 1: Define what counts as a touchpoint
Not every interaction should count as a touchpoint. Define clear criteria:
Include:
Paid ad clicks (search, social, display)
Organic channel visits (search, social, direct)
Content downloads (whitepapers, ebooks, templates)
Email clicks (not opens, which are unreliable)
Webinar attendance
Demo bookings and attendance
Sales calls and meetings
Exclude:
Page views without engagement (bounce rate >80%)
Email opens (tracking pixels are unreliable)
Social media impressions without clicks
Retargeting impressions without clicks
The goal is to count meaningful interactions, not passive exposures. Every touchpoint should represent a deliberate engagement with your brand.
Step 2: Set your attribution window
The attribution window defines how far back in time to look for touchpoints. Common windows:
30 days: E-commerce, short sales cycles
90 days: Mid-market B2B SaaS
180 days: Enterprise B2B, complex sales
Longer windows capture more touchpoints but dilute credit across many interactions. Shorter windows focus on recent, high-intent touchpoints but miss early awareness activities.
For most B2B organizations, a 90-day window balances completeness and relevance.
Step 3: Implement linear attribution with SourceLoop
SourceLoop tracks every touchpoint across your marketing channels and applies linear attribution logic automatically. Here's how it works:
Automatic touchpoint capture: SourceLoop's tracking script captures every session, including the source (Google, LinkedIn, email), medium (organic, paid, referral), campaign, and landing page. The data persists across sessions, building a complete journey for each prospect.
Equal credit distribution: When a prospect converts (form fill, demo booking, purchase), SourceLoop calculates the total touchpoints in their journey and assigns equal credit to each. If the journey contained 8 touchpoints, each receives 12.5% credit.
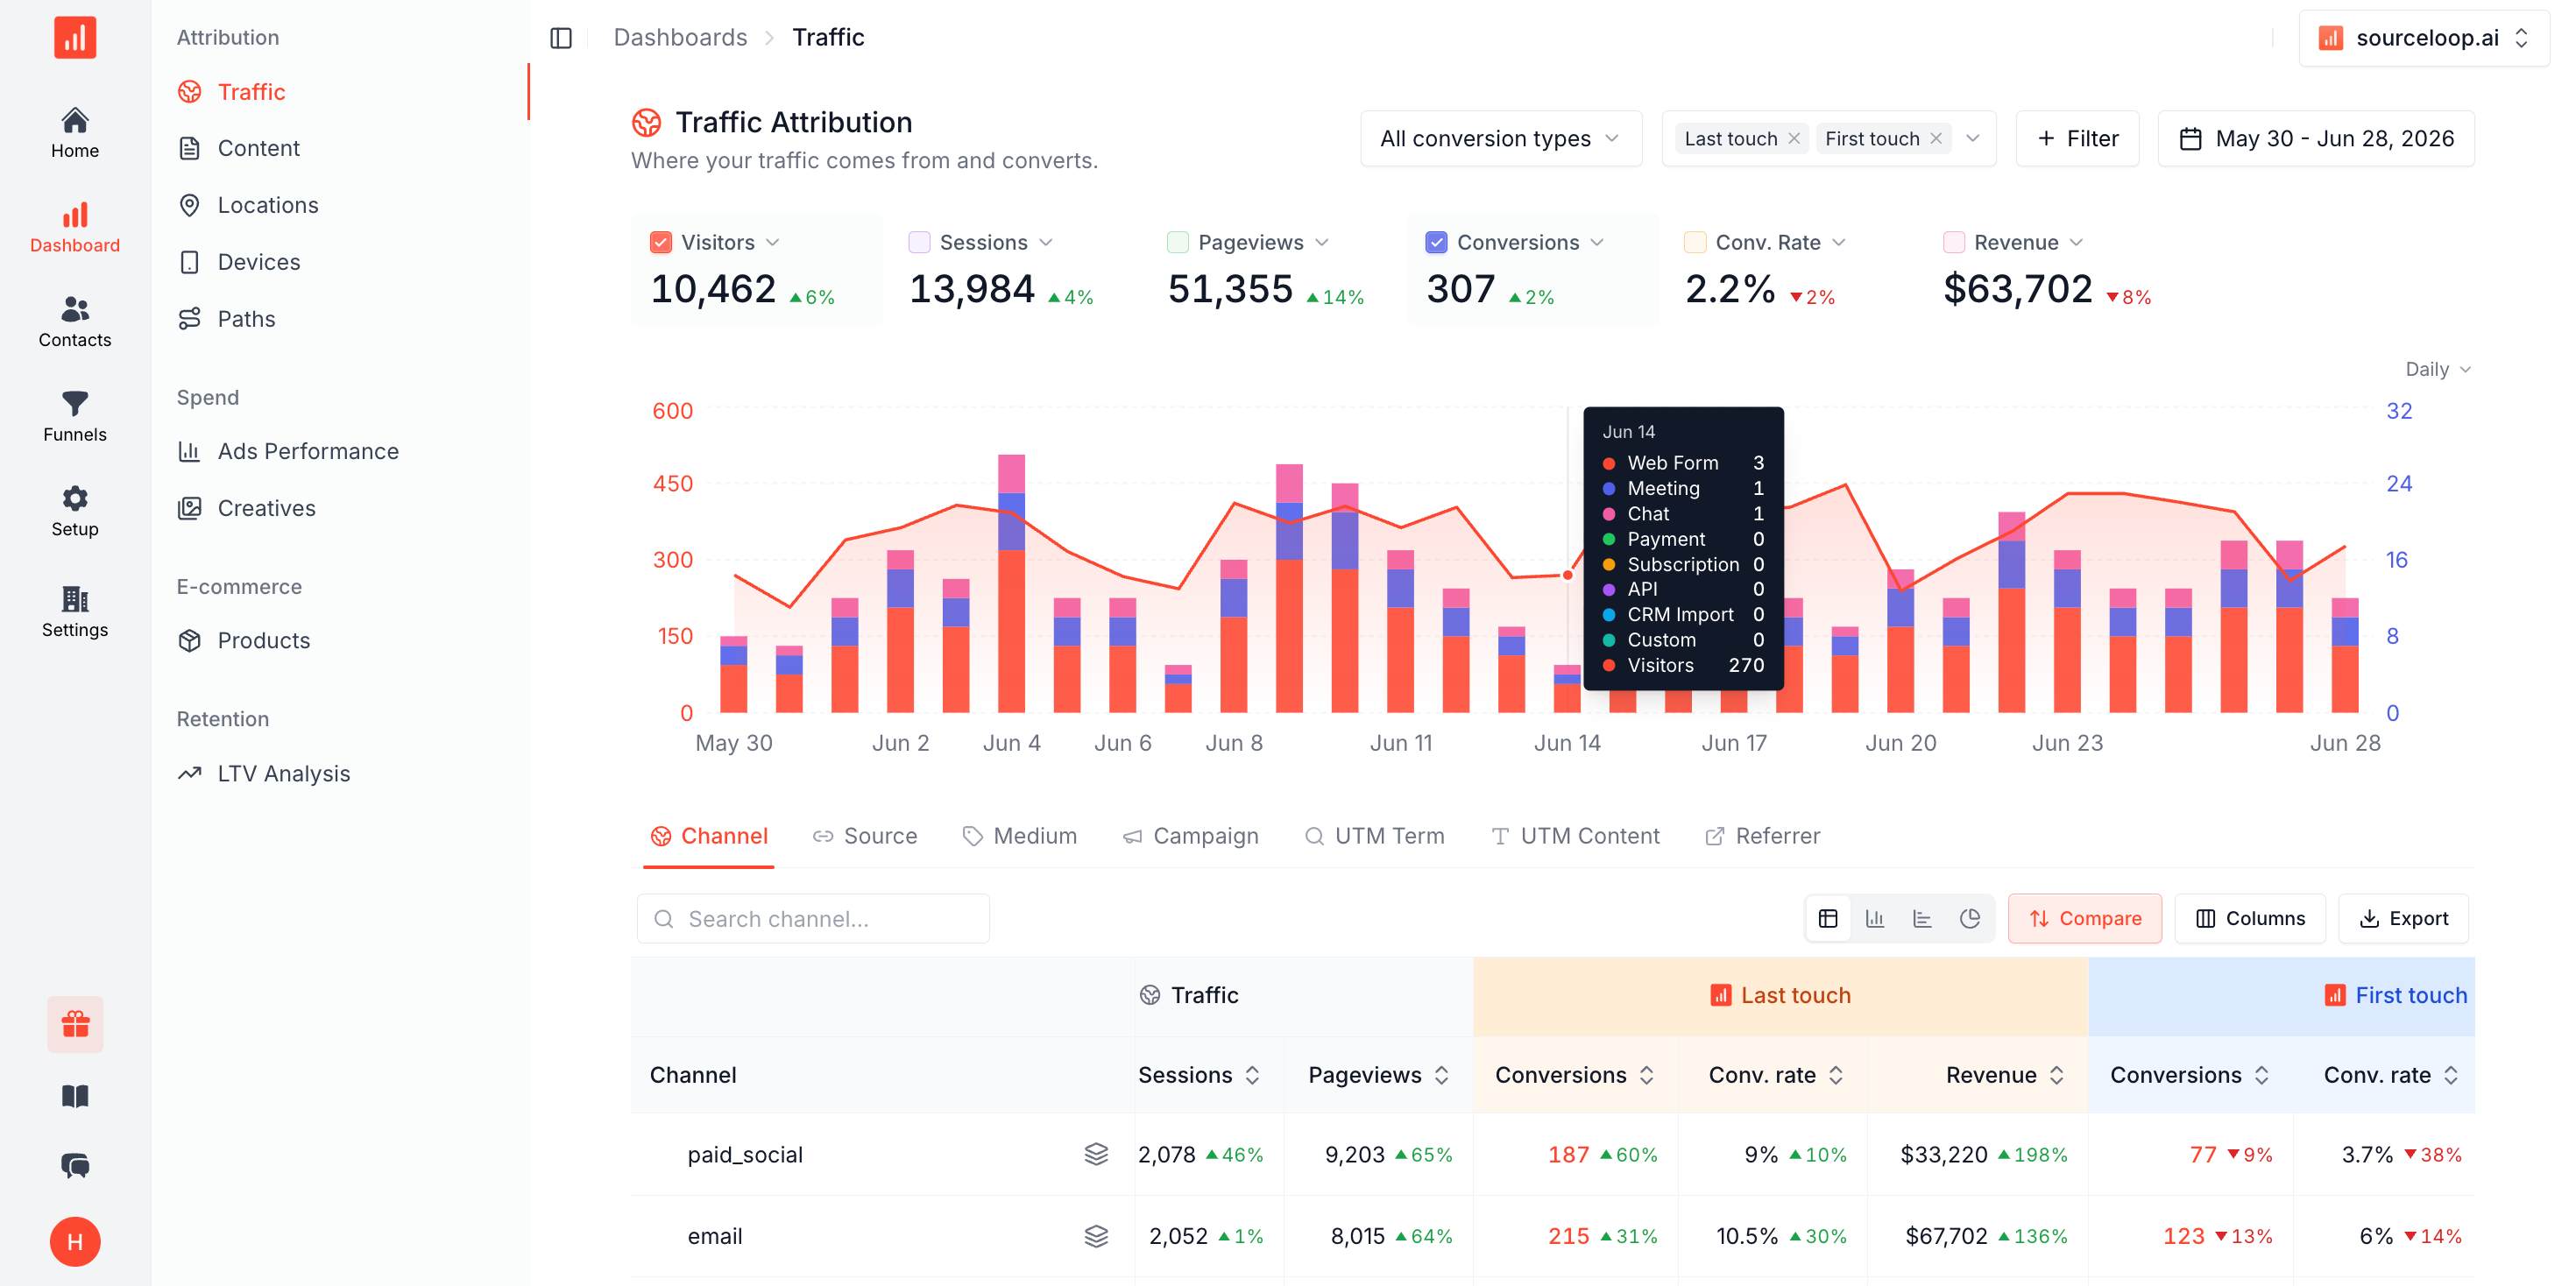
CRM sync: SourceLoop writes attribution data to your HubSpot, Salesforce, or Pipedrive CRM. You can see the full journey for every contact, including which channels they engaged with and how much credit each channel received.
Multi-model comparison: While SourceLoop applies linear attribution, it also calculates first-touch, last-touch, time-decay, and position-based attribution for the same journeys. You can compare how different models allocate credit and identify which channels drive awareness versus conversion.
Implementation takes under 30 minutes. Add the SourceLoop tracking script to your website, connect your CRM, and define your conversion events. The platform handles touchpoint capture, credit calculation, and attribution reporting automatically.
Step 4: Build validation reports
Create dashboards that show linear attribution results alongside other models. Look for discrepancies:
Channels that rank high in linear but low in last-touch are awareness drivers
Channels that rank low in linear but high in last-touch are conversion drivers
Channels that rank consistently across models are balanced performers
These comparisons reveal which channels need supporting tactics (awareness channels need nurture sequences) and which channels deserve more budget (conversion channels need scale).
Step 5: Run parallel attribution models
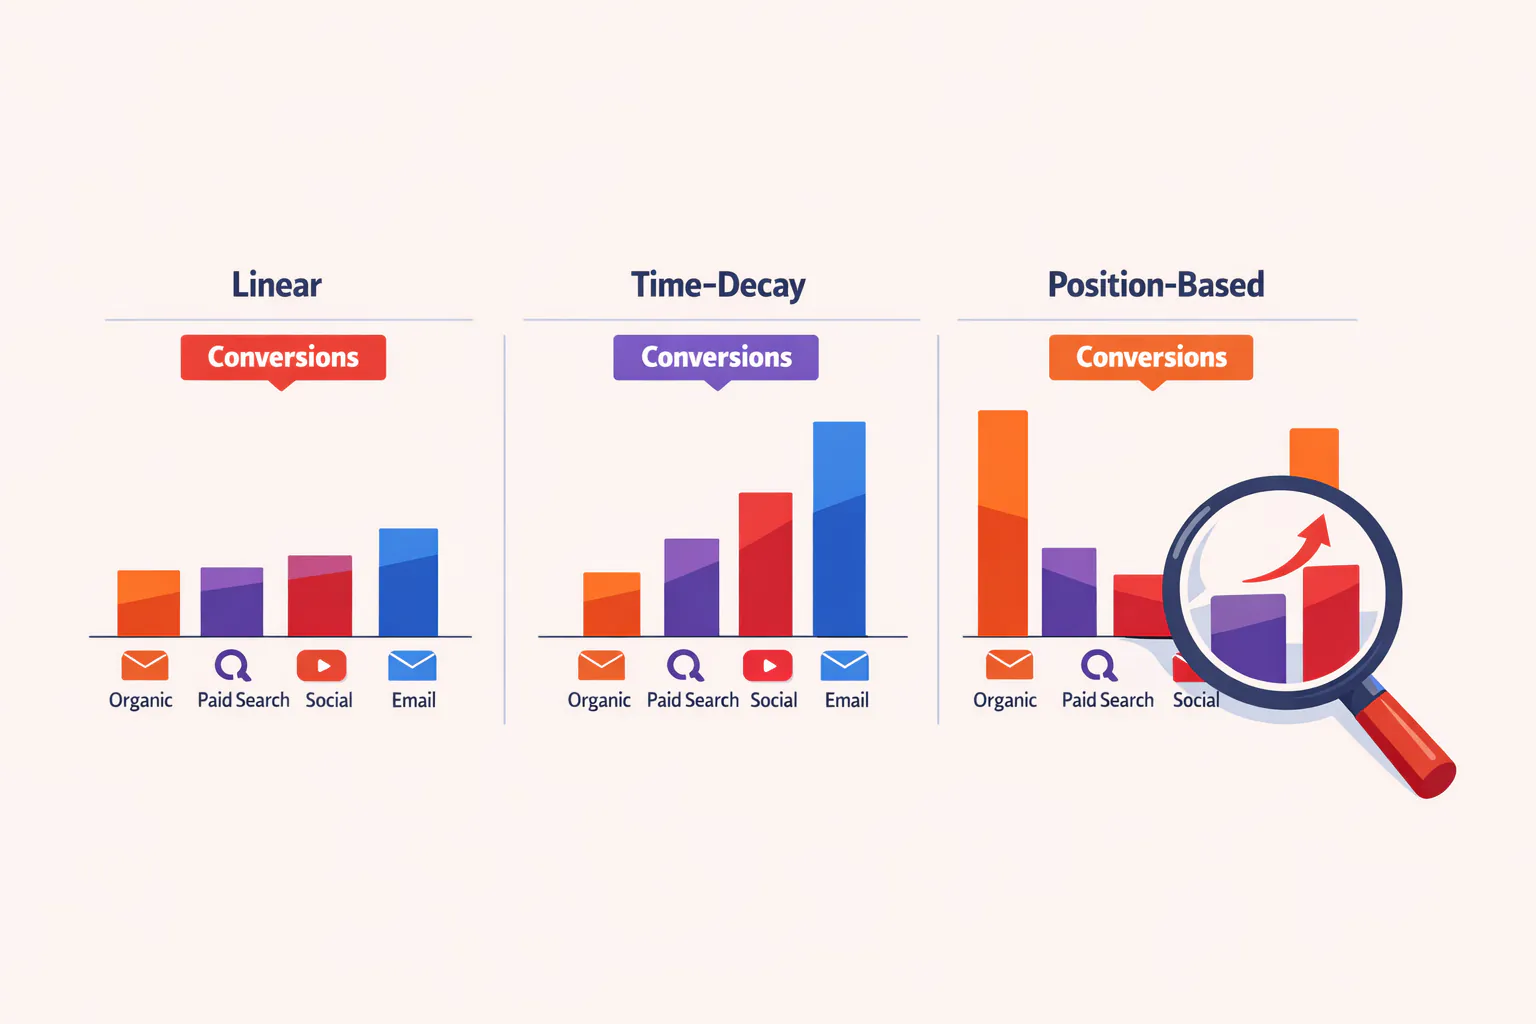
Never rely exclusively on linear attribution. Run time-decay, position-based, and data-driven models in parallel. Compare the results monthly.
Time-decay attribution gives more credit to touchpoints closer to conversion. This model reveals which channels drive final decisions rather than early awareness.
Position-based attribution (U-shaped) gives most credit to the first and last touchpoints, with remaining credit distributed among middle interactions. This model highlights channels that generate awareness and close deals while acknowledging mid-funnel nurture.
Data-driven attribution uses machine learning to weight touchpoints based on observed conversion patterns. Google Analytics 4's data-driven model increases accuracy by 25-40% for B2B organizations compared to rules-based models like linear attribution.
Marketing teams should use linear attribution to understand full-journey participation, time-decay to optimize conversion tactics, and position-based to balance awareness and closing investments.
Linear vs. Time-Decay Attribution
Time-decay attribution assigns more credit to touchpoints closer to the conversion. The most recent interaction might receive 40% credit, while the first touchpoint receives only 5%.
Dimension | Linear Attribution | Time-Decay Attribution |
|---|---|---|
Credit distribution | Equal across all touchpoints | Weighted toward recent touchpoints |
What it measures | Full-journey participation | Conversion influence |
Best for | Understanding channel mix | Optimizing bottom-of-funnel tactics |
Weakness | Over-credits awareness touchpoints | Under-credits early awareness activities |
Time-decay reveals which channels close deals. Linear reveals which channels participate in journeys. Use both to understand the full funnel.
Linear vs. Position-Based Attribution (U-Shaped)
Position-based attribution assigns the most credit to the first and last touchpoints (typically 40% each), with the remaining 20% distributed among middle interactions.
Dimension | Linear Attribution | Position-Based Attribution |
|---|---|---|
Credit distribution | Equal across all touchpoints | Weighted to first and last touchpoints |
What it measures | Full-journey participation | Awareness generation and conversion |
Best for | Balanced channel analysis | Optimizing awareness and closing tactics |
Weakness | Ignores touchpoint importance | Under-credits mid-funnel nurture |
Position-based attribution acknowledges that the first touchpoint (awareness) and last touchpoint (conversion) matter most. Linear attribution treats all touchpoints identically.
Linear vs. W-Shaped Attribution
W-shaped attribution extends position-based by giving significant credit to three key touchpoints: first interaction, a critical mid-funnel milestone (often a demo or trial signup), and the last interaction.
Dimension | Linear Attribution | W-Shaped Attribution |
|---|---|---|
Credit distribution | Equal across all touchpoints | Weighted to first, middle milestone, and last |
What it measures | Full-journey participation | Awareness, engagement, and conversion |
Best for | Simple channel analysis | Complex B2B sales cycles with clear milestones |
Weakness | Ignores milestone importance | Requires defining the mid-funnel milestone |
W-shaped attribution works well for B2B organizations with clear conversion milestones (trial signup, demo attendance, pricing discussion). Linear attribution works better when no single mid-funnel event stands out.
Linear vs. Data-Driven Attribution
Data-driven attribution uses machine learning to analyze thousands of conversion paths and assign credit based on observed patterns. It identifies which touchpoints statistically increase conversion probability.
Dimension | Linear Attribution | Data-Driven Attribution |
|---|---|---|
Credit distribution | Equal across all touchpoints | Weighted by statistical influence |
What it measures | Full-journey participation | Actual conversion impact |
Best for | Early-stage analysis, political neutrality | Mature organizations with large data sets |
Weakness | Ignores actual influence | Requires 1,000+ conversions per month |
Data-driven attribution is the most accurate model but requires significant conversion volume. Linear attribution works with smaller data sets but sacrifices accuracy for simplicity.
Real-World Linear Attribution Examples
Here's how different types of businesses use linear attribution in practice.
Example 1: Mid-Market B2B SaaS (Project Management Software)
Business model: B2B SaaS, $199/month starting price, 30-45 day sales cycle, 6-9 touchpoints before conversion.
Linear attribution implementation: SourceLoop tracking integrated with HubSpot CRM, running linear, time-decay, and position-based models in parallel.
Key insight: Linear attribution showed that blog content generated 35% of attributed conversions, while product demos generated only 18%. Time-decay attribution showed the opposite: demos generated 42% of attributed conversions, while blog content generated only 12%.
Action taken: The team recognized that blog content drives awareness (high linear attribution) but demos drive conversions (high time-decay attribution). They maintained blog investment for top-of-funnel but increased demo capacity and sales follow-up resources.
Result: Conversion rate from demo to paid customer increased from 22% to 38% by optimizing for time-decay attribution rather than linear attribution alone.
Example 2: Professional Services Firm (Marketing Consulting)
Business model: B2B consulting, $25,000 average project size, 60-90 day sales cycle, 12-15 touchpoints before conversion.
Linear attribution implementation: Google Analytics 4 linear model plus manual tracking of offline touchpoints (conference meetings, phone calls).
Key insight: Linear attribution showed that webinars generated 28% of attributed conversions, LinkedIn content generated 24%, and case studies generated 18%. All three channels participated heavily in conversions, but the team couldn't determine which ones actually closed deals.
Action taken: They implemented position-based attribution (U-shaped) to give more credit to first and last touchpoints. This revealed that LinkedIn content drove awareness (first touch) while case studies and sales calls drove conversions (last touch). Webinars participated in journeys but rarely initiated or closed them.
Result: The team shifted budget from webinar production to case study development and sales enablement. Close rate increased from 15% to 23%.
Example 3: E-Commerce Brand (Home Fitness Equipment)
Business model: Direct-to-consumer e-commerce, $400 average order value, 7-14 day sales cycle, 4-6 touchpoints before purchase.
Linear attribution implementation: SourceLoop tracking integrated with Shopify, running linear and last-touch models.
Key insight: Linear attribution showed that Instagram ads generated 32% of attributed revenue, email campaigns generated 26%, and retargeting ads generated 22%. Last-touch attribution showed that retargeting ads generated 48% of attributed revenue, while Instagram ads generated only 18%.
Action taken: The team recognized that Instagram ads drive awareness (high linear attribution) but retargeting ads drive purchases (high last-touch attribution). They maintained Instagram spend for new customer acquisition but increased retargeting budget and frequency.
Result: Overall revenue increased 31% while maintaining the same total ad spend. The shift from linear to last-touch optimization improved ROI by focusing budget on conversion channels.
Frequently Asked Questions
What is a linear attribution model?
A linear attribution model is a multi-touch attribution approach that assigns equal credit to every marketing touchpoint in the customer journey. If a prospect interacts with five channels before converting, each channel receives 20% of the conversion credit. This model acknowledges the full journey but assumes all touchpoints have equal influence.
How does linear attribution differ from first-touch and last-touch models?
First-touch attribution credits only the initial interaction, last-touch credits only the final interaction, and linear attribution credits all interactions equally. First-touch measures awareness generation, last-touch measures conversion effectiveness, and linear measures full-journey participation. Linear provides a more complete view than single-touch models but cannot distinguish between high-impact and low-impact touchpoints.
When should I use linear attribution instead of other models?
Use linear attribution when your sales cycle is under 30 days with 3-7 touchpoints, when you're building a baseline understanding of channel participation, or when you need a politically neutral model that credits every team's contributions. For sales cycles exceeding 90 days or when touchpoint quality varies significantly, use time-decay, position-based, or data-driven attribution models instead.
What are the main limitations of linear attribution?
Linear attribution over-credits high-frequency, low-impact channels (social media impressions, display ads) and under-credits low-frequency, high-impact channels (product demos, sales calls). It ignores touchpoint timing and sequence, treats all customer segments identically, and can lead to budget misallocation in long sales cycles. Organizations using linear attribution as their primary model misallocate 40-50% of marketing spend in sales cycles exceeding 90 days.
How do I implement linear attribution with my CRM?
Use an attribution platform like SourceLoop that captures every touchpoint (ad clicks, content downloads, email clicks, webinar attendance) and syncs the data to your HubSpot, Salesforce, or Pipedrive CRM. SourceLoop automatically calculates linear attribution by dividing conversion credit equally across all touchpoints in each prospect's journey and writes the results to custom CRM fields.
Can I run multiple attribution models at the same time?
Yes, and you should. Run linear attribution alongside time-decay, position-based, and last-touch models. Compare how different models allocate credit across channels. Channels that rank high in linear but low in time-decay are awareness drivers. Channels that rank low in linear but high in time-decay are conversion drivers. This comparison reveals which channels need supporting tactics versus which deserve more budget.
Why do my linear attribution results differ from Google Analytics?
Discrepancies occur due to different attribution windows (GA4 uses 90 days by default), different touchpoint definitions (GA4 counts sessions, your CRM might count specific events), cookie deletion or blocking (prospects appear as new users when they return), and cross-device journeys (mobile and desktop visits tracked separately). Reduce discrepancies by using a unified attribution platform like SourceLoop that applies consistent logic across all data sources.
How does linear attribution handle offline touchpoints?
Most linear attribution implementations focus on digital touchpoints because they're easier to track. To include offline interactions (conference meetings, phone calls, direct mail), add manual tracking fields to your CRM or use call tracking software that integrates with your attribution platform. SourceLoop integrates with call tracking tools to include phone conversations in linear attribution calculations.
Conclusion: Use Linear Attribution as a Starting Point, Not the Final Answer
Linear attribution provides a balanced view of how marketing channels participate in conversions. For businesses with short sales cycles, balanced touchpoint influence, or early-stage attribution analysis, this model offers useful insights without the complexity of advanced approaches.
But linear attribution cannot measure actual influence. It treats a three-second social media impression the same as a 30-minute product demo. Marketing teams optimizing solely for linear attribution risk over-investing in high-frequency channels that generate touchpoints but not revenue.
The solution is not to abandon linear attribution. It's to use it as one input in a broader attribution strategy. Run linear attribution to understand full-journey participation. Add time-decay models to measure conversion influence. Use position-based models to optimize awareness and closing tactics. Compare how different frameworks allocate credit and build marketing strategies that optimize across the full customer journey.
For implementation, tools like SourceLoop make it simple to track linear attribution across all channels, sync the data to your CRM, and run multiple attribution models in parallel. You get the full-journey insights from linear attribution plus the conversion intelligence from time-decay and position-based models, all in one platform.
Start with linear attribution to understand where your channels participate. Graduate to advanced models to understand where they actually drive revenue. That combination gives you the complete picture you need to allocate marketing spend effectively.


 Paid Social


