
User Behavior Analytics Guide for Marketing Teams
Learn how user behavior analytics empowers marketing teams to optimize campaigns, integrate with attribution, and drive revenue through actionable insights.
User behavior analytics (UBA) is the process of tracking, collecting, and analyzing how users interact with your systems, applications, or websites to identify patterns, detect anomalies, and improve outcomes. It reveals what users do, why they do it, and which actions lead to security threats, product engagement, or revenue.
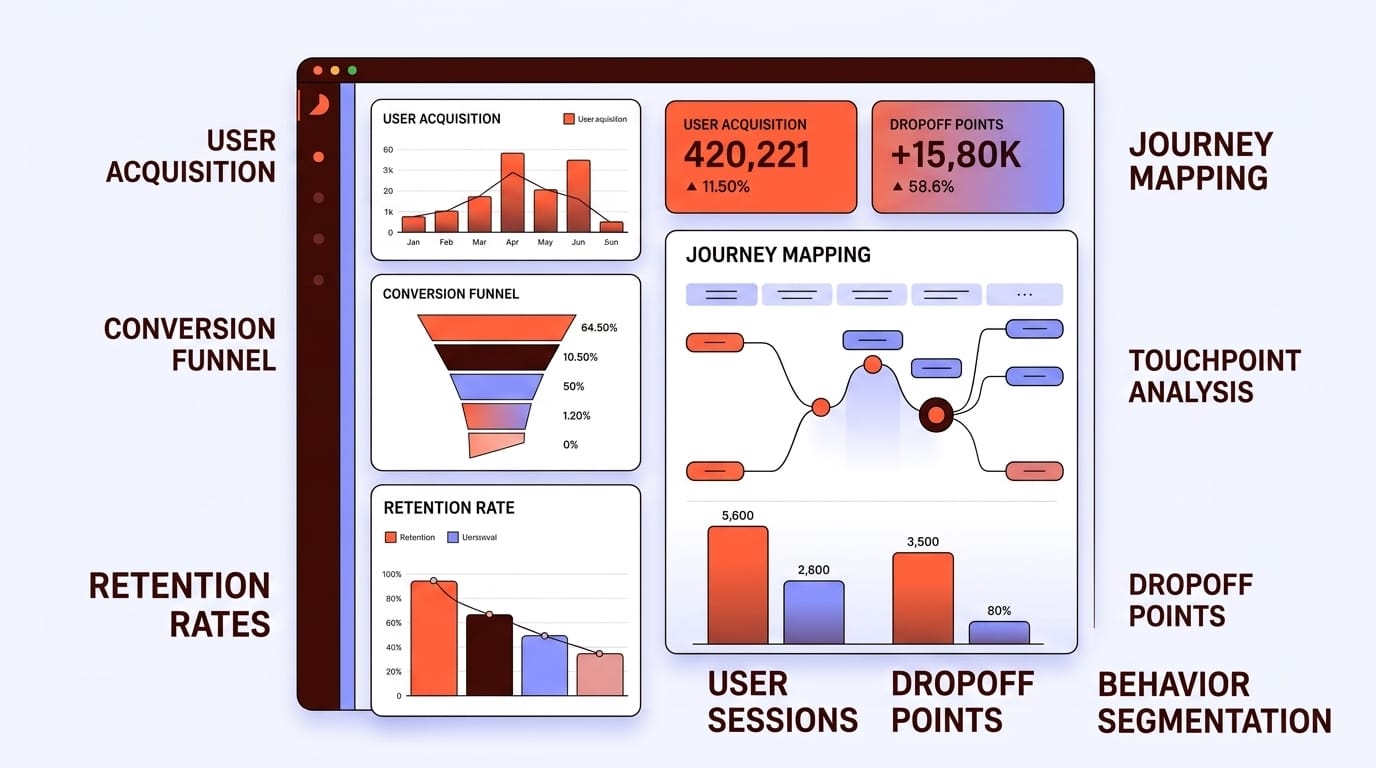
What is User Behavior Analytics?
User behavior analytics is a method for monitoring and analyzing how people interact with digital systems. Organizations collect data on user actions (events like clicks, logins, purchases, or file access), then use that data to understand patterns, spot deviations from normal behavior, and make informed decisions.
The term "user behavior analytics" applies across multiple disciplines. In cybersecurity, it means tracking user activity to detect insider threats and compromised accounts. In product analytics, it means understanding feature usage and engagement to improve customer experience. In marketing, it connects user actions across touchpoints to revenue outcomes.
According to Amplitude's research on user behavior, tracking behavioral data enables companies to anticipate customer needs, create tailored experiences, and make data-driven product decisions rather than relying on assumptions.
UBA vs UEBA: Understanding the Difference
While the terms sound similar, UBA and UEBA serve different purposes:
User Behavior Analytics (UBA) focuses specifically on human user activity. It tracks what people do inside applications, on websites, or within products. Product teams and marketers use UBA to understand engagement, optimize features, and improve conversion rates.
User and Entity Behavior Analytics (UEBA) expands the scope beyond people. UEBA monitors users and entities like network devices, applications, servers, and IoT devices. Security teams use UEBA to detect threats that traditional security tools miss.
The key distinction: UEBA incorporates machine learning algorithms to establish behavioral baselines and identify anomalies that indicate security risks. UBA in product and marketing contexts focuses on understanding engagement patterns and conversion behaviors.
Aspect | UBA | UEBA |
|---|---|---|
Primary focus | Human user interactions | Users and network entities |
Main use case | Product optimization, marketing attribution | Threat detection, security monitoring |
Technology | Event tracking, analytics platforms | Machine learning, anomaly detection |
Data sources | Application logs, clickstream, forms | Logs, network traffic, access systems |
Typical users | Product managers, marketers | Security teams, SOC analysts |
Why User Behavior Analytics Matters
Organizations track user behavior for three critical reasons: security, product improvement, and revenue optimization.
1. Security and Threat Detection
Insider-related incidents cost organizations an average of $19.5 million annually as of 2026. User behavior analytics detects anomalies that signal compromised credentials, data exfiltration, or malicious insider activity. When someone accesses systems at unusual hours, downloads excessive files, or shows geo-velocity inconsistencies (logging in from two distant locations within minutes), UEBA flags the risk.
Traditional security tools monitor the perimeter. Behavioral analytics monitors what happens after someone gets inside.
2. Product Experience and Engagement
Companies that understand how users interact with their products build better experiences. DoorDash uses cross-platform behavioral tracking to create seamless experiences between its website and mobile app. Users can start orders on one platform and receive real-time updates on another because DoorDash connects behavioral data across touchpoints.
Product teams analyze behavior to discover which features drive retention, where users drop off during onboarding, and what actions predict long-term engagement. Under Armour's Connected Fitness team discovered through behavioral analytics that its race training plans needed more variety. After revamping the feature based on user behavior data, the training plans feature tripled in use among paid users.
3. Marketing Attribution and Revenue
For businesses that sell through forms, demos, and sales conversations, user behavior analytics connects marketing touchpoints to qualified leads and revenue. Every interaction (ad click, website visit, content download, form submission) contributes to the customer journey.
Marketing attribution software uses behavioral tracking to answer questions traditional web analytics can't: Which campaign influenced the $40,000 deal? Which keyword led to the booked demo? What sequence of touchpoints produces customers instead of just traffic?
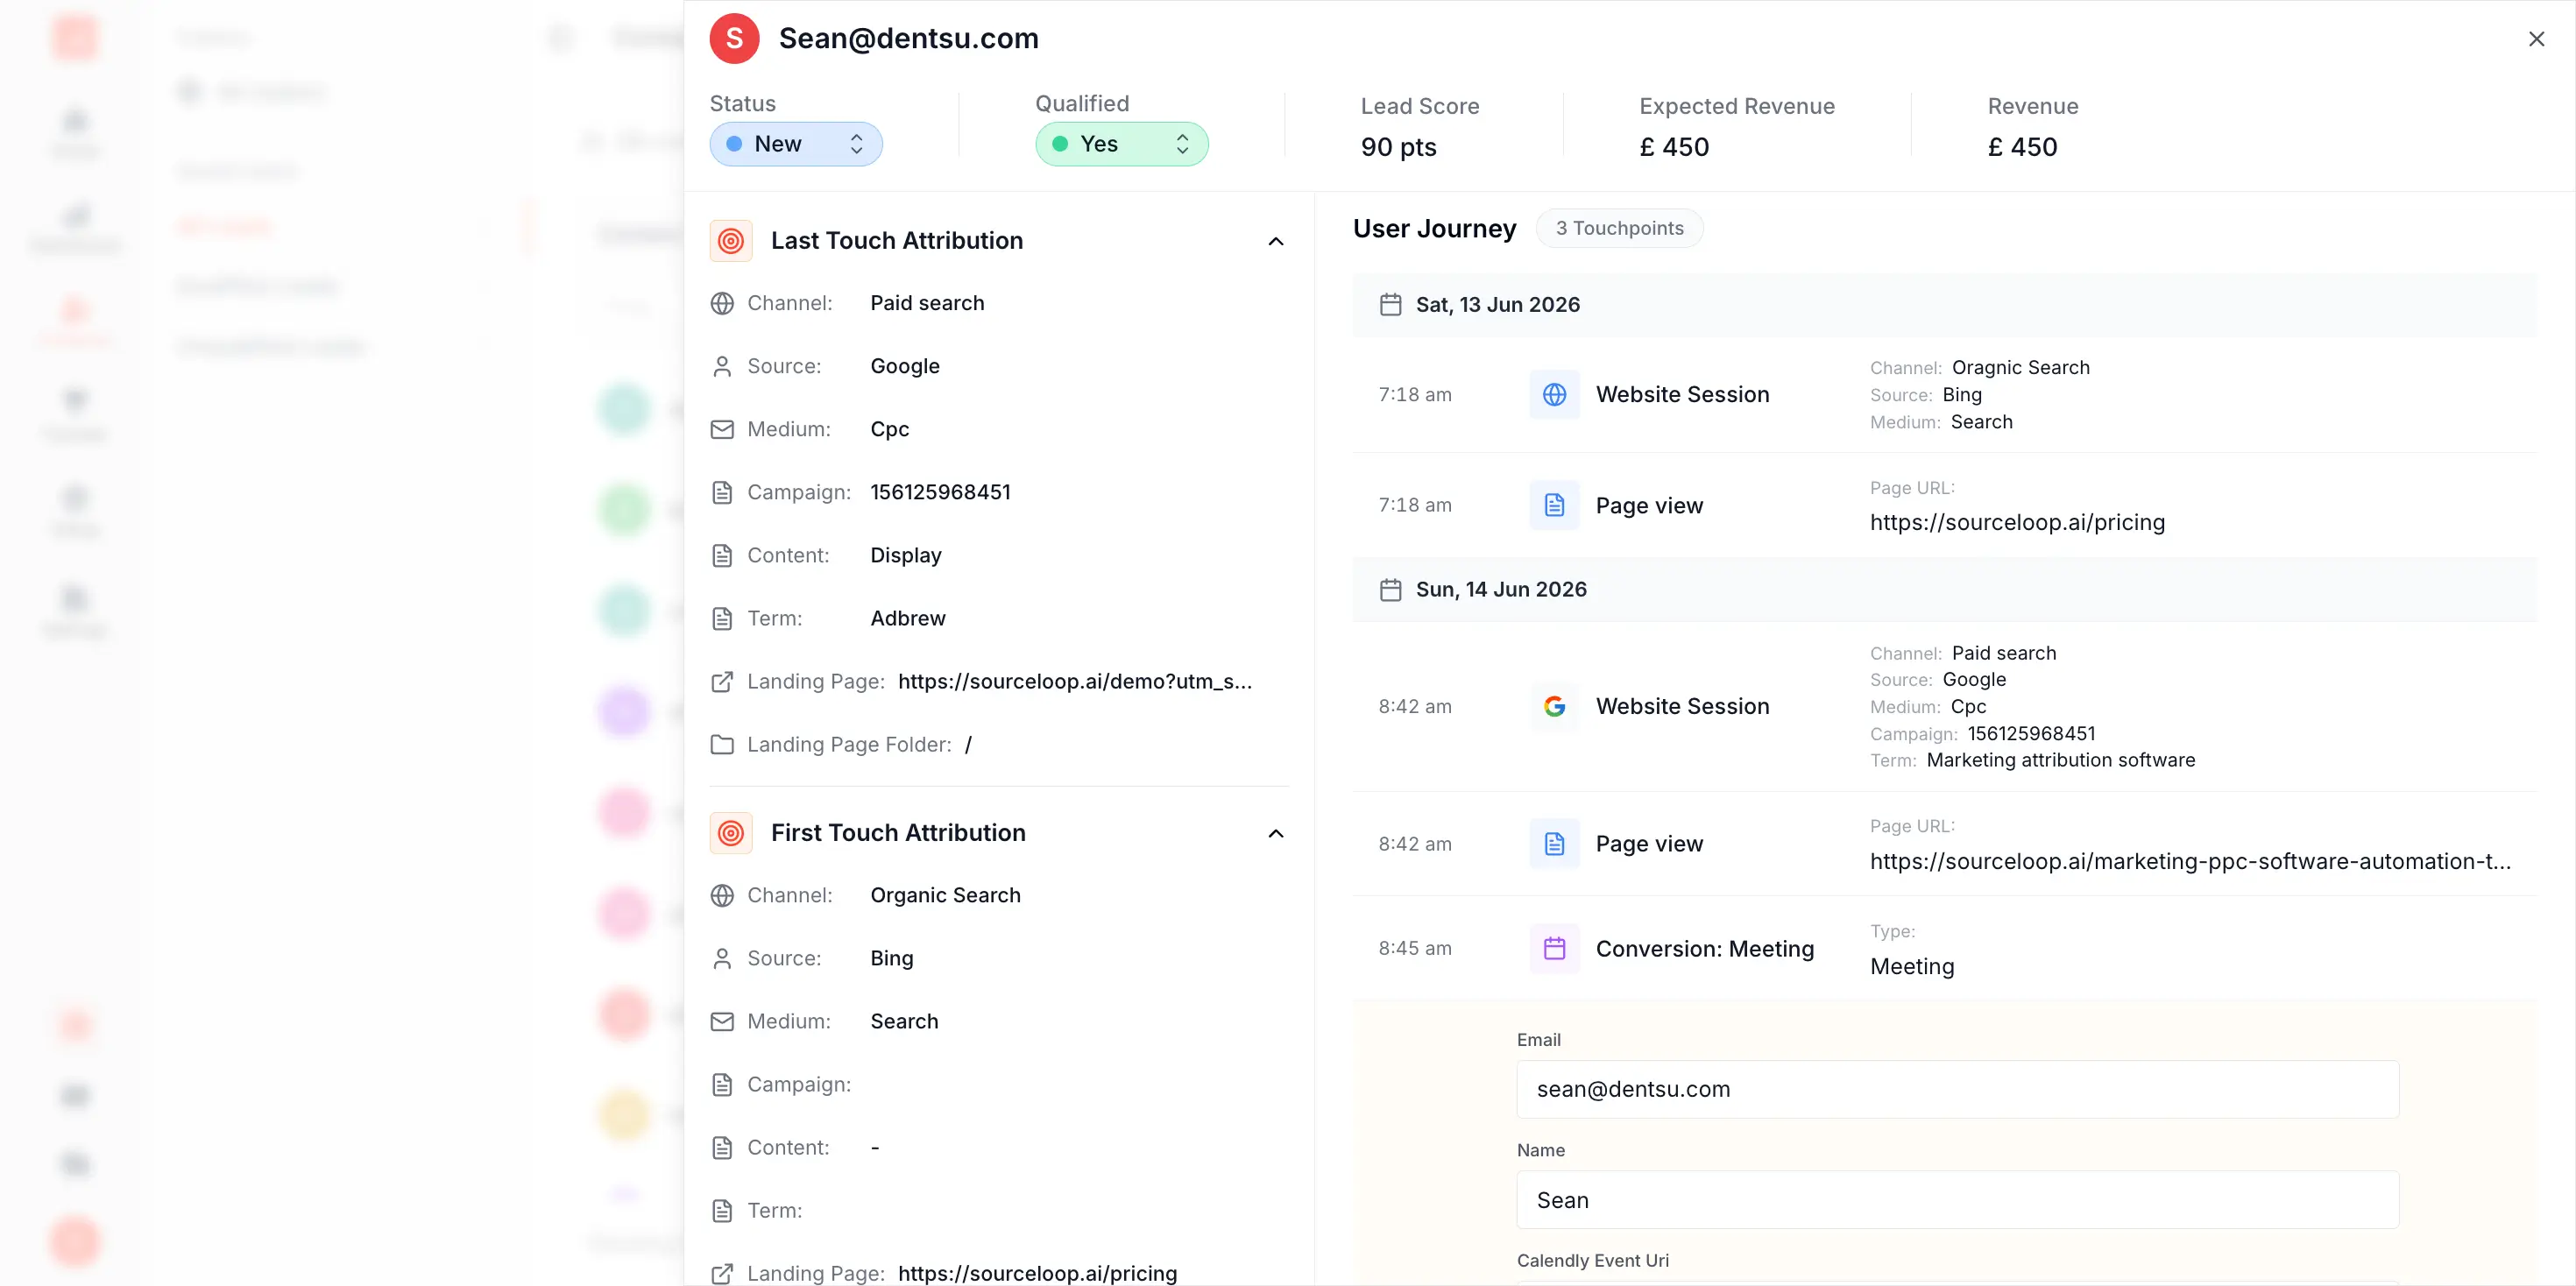
Sourceloop captures this full user journey across ads, landing pages, forms, and CRM records, connecting first-party behavioral data to revenue outcomes. This level of tracking reveals which marketing efforts produce qualified leads versus which generate empty clicks.
How User Behavior Analytics Works
The UBA process follows four stages regardless of whether you're tracking security threats, product engagement, or marketing attribution.
1. Data Collection
Systems collect information about user actions. This includes login times, IP addresses, pages visited, features used, forms submitted, files accessed, and API calls made. The data comes from application logs, clickstream tracking, form submissions, CRM systems, and network activity.
Modern behavioral tracking uses first-party data collection to maintain accuracy despite privacy changes. Tools like Sourceloop's tracking SDK capture visitor behavior on your own domain, ensuring data persists even as third-party cookies disappear.
2. Baseline Establishment
Analytics systems establish what "normal" behavior looks like for each user and across user segments. Machine learning algorithms in UEBA platforms analyze historical data to understand typical access patterns, usual work hours, common file types accessed, and standard network connections.
In product analytics, baselines identify typical user paths, average session lengths, and expected feature usage patterns. Marketing attribution establishes normal conversion timeframes and touchpoint sequences.
3. Anomaly Detection
Once baselines exist, the system identifies deviations. A user who typically accesses the system Monday through Friday from 9 AM to 5 PM suddenly logs in at 3 AM on Sunday. A feature that normally sees steady usage shows a sudden spike or drop. A lead converts after a single touchpoint when the average customer journey includes seven interactions.
Palo Alto Networks explains that behavioral analytics detects patterns traditional rule-based systems miss. Instead of looking for known attack signatures, UBA identifies unusual behavior that warrants investigation.
4. Risk Scoring and Alerting
Systems assign risk scores based on the severity and context of anomalies. A security platform might score a user's behavior on a 0-100 scale, with higher scores triggering automated responses or analyst review. Product analytics tools flag engagement drops that predict churn. Marketing attribution identifies high-intent behaviors that signal sales readiness.
The scoring enables prioritization. Security teams address the highest-risk anomalies first. Product managers focus on the friction points affecting the most users. Marketing teams target accounts showing buyer-intent signals.
Key Types of User Behavior Analytics
Organizations apply behavioral analytics in different ways depending on their goals.
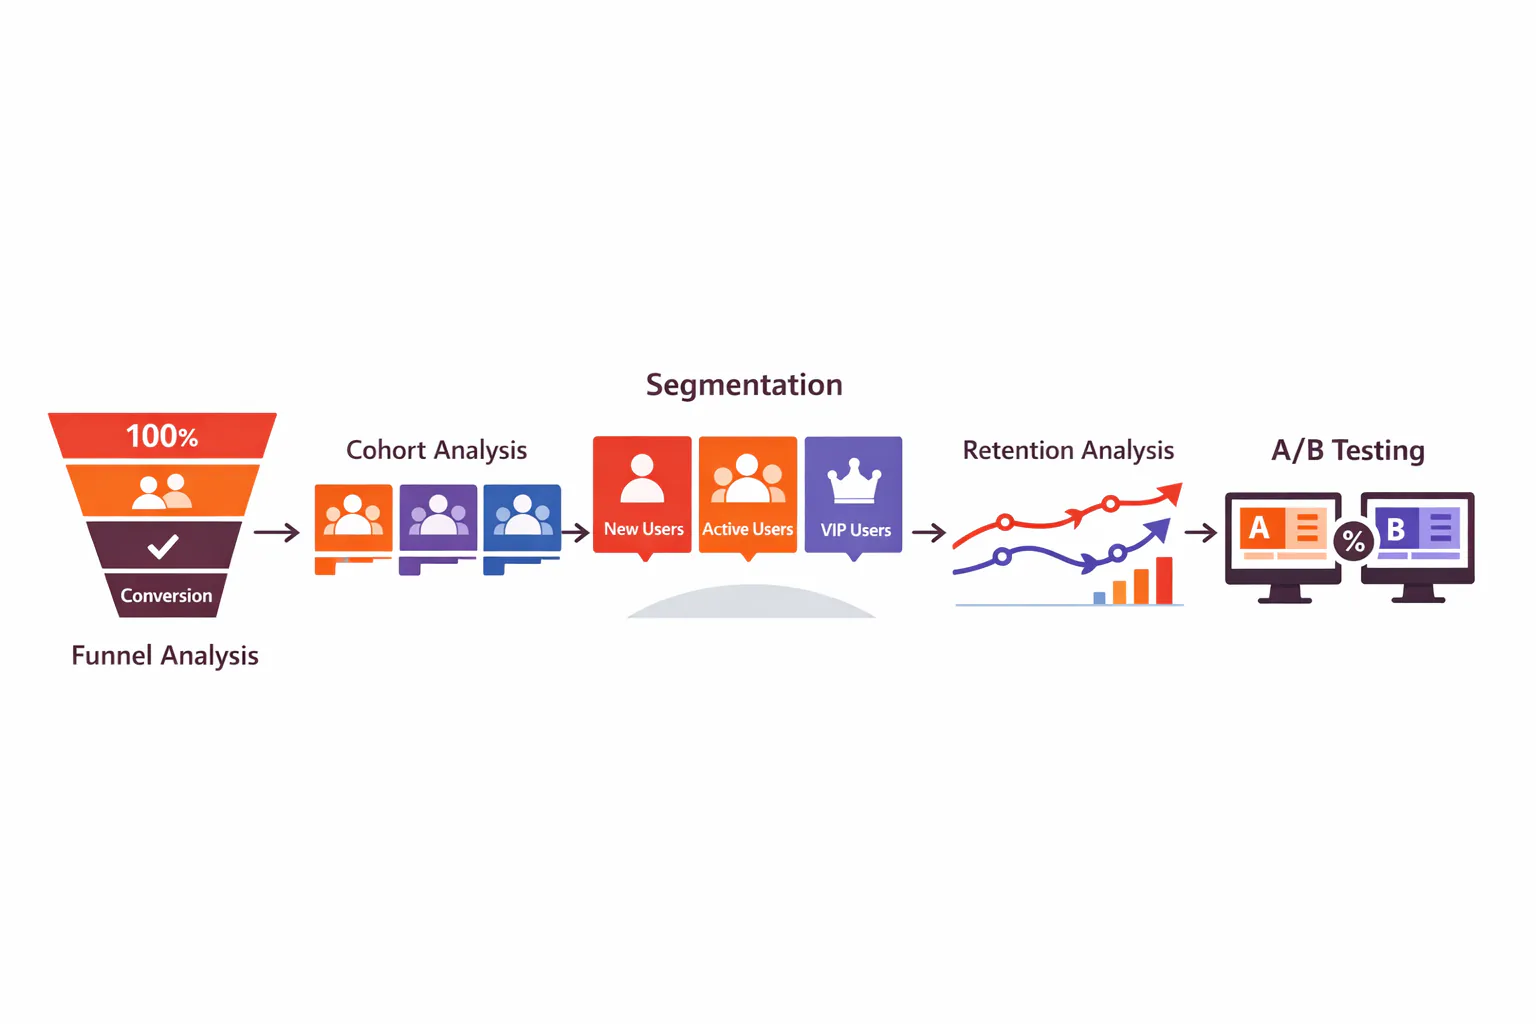
1. Funnel Analysis
Funnel analysis tracks how users move through a sequence of steps toward a desired outcome. Product teams use funnels to monitor onboarding completion, feature adoption, and purchase flows. Marketing teams track funnel progression from ad click to lead to opportunity to customer.
Funnel analysis reveals where users drop off so teams can remove obstacles. If 60% of users abandon during step three of onboarding, you know exactly where to focus improvement efforts.
2. Cohort Analysis
Cohort analysis groups users based on shared characteristics or behaviors, then compares outcomes across cohorts. You might compare users who signed up in January versus February, or users who adopted a specific feature versus those who didn't.
Behavioral cohorts uncover insights like "users who complete onboarding in under 10 minutes have 3x higher retention" or "customers who engage with both email and SMS campaigns convert 40% faster."
3. Segmentation Analysis
Segmentation divides users into groups for targeted analysis and personalization. Segments might be based on demographics, usage patterns, lifecycle stage, or behavioral signals.
For marketing attribution, segmentation reveals which channels and campaigns work for different audience types. Enterprise buyers follow different paths than small business customers. Understanding these behavioral segments enables more precise attribution and budget allocation.
4. Retention and Engagement Analysis
This analysis type measures how often users return and which actions drive ongoing engagement. Product teams track daily active users, weekly retention rates, and feature stickiness. Marketing teams monitor how behavioral engagement predicts customer lifetime value.
Retention analysis identifies the actions that separate power users from those likely to churn. According to behavioral analytics research, companies that act on retention insights reduce churn rates and increase customer lifetime value.
5. A/B Testing and Experimentation
Behavioral analytics powers experimentation by tracking how users respond to different versions of features, designs, or campaigns. A/B testing compares user behavior across variants to determine which performs better for specific goals.
Teams test everything from button colors to pricing models to email subject lines, using behavioral data to measure impact on conversion, engagement, and revenue.
Essential Metrics for User Behavior Analysis
The metrics you track depend on your objectives, but several behavioral indicators matter across contexts.
Security-Focused Metrics
Risk score: Calculated based on behavioral anomalies and threat indicators
Geo-velocity violations: Impossible travel between locations in short timeframes
Access anomalies: Unusual access patterns, times, or locations
Data movement: File downloads, uploads, and transfers outside normal patterns
Failed authentication attempts: Unusual numbers of failed login attempts
Product-Focused Metrics
Activation rate: Percentage of new users who complete key initial actions
Feature usage: Which features users engage with and how frequently
Session frequency: How often users return to the product
Stickiness ratio: Daily active users divided by monthly active users
Funnel drop-off: Where users abandon during key flows
Retention rate: Percentage of users who return after initial signup
Marketing-Focused Metrics
Touchpoints to conversion: Average number of interactions before purchase
Channel contribution: How different channels influence outcomes
Lead score: Behavioral signals indicating buyer readiness
Multi-touch attribution: Value assigned to each touchpoint in the journey
Conversion paths: Common sequences of actions leading to goals
According to Amplitude's product metrics guide, companies should focus on a North Star Metric that connects customer value to business revenue, supported by 2-3 contributing behavioral indicators.
How to Implement User Behavior Analytics
Implementing behavioral analytics requires planning, proper instrumentation, and cross-functional alignment.
1. Define Your Goals
Start with clear objectives. Are you trying to detect security threats? Improve product engagement? Optimize marketing spend? Your goals determine which events to track, what baselines to establish, and which metrics matter.
Security teams might prioritize anomaly detection and risk scoring. Product teams focus on engagement and retention. Marketing teams need attribution and conversion tracking.
2. Identify Events to Track
Events are the building blocks of behavioral analytics. An event is any user action you want to measure: clicking a button, submitting a form, viewing a page, accessing a file, or booking a meeting.
Best practice suggests starting with 20-30 core events rather than tracking everything. Focus on events that directly relate to your goals. You can always add more events later based on what you learn.
For marketing attribution, track events across the customer journey: ad clicks, page views, form submissions, demo bookings, proposal sent, and deal closed.
3. Establish Taxonomy and Standards
Create a consistent naming convention for events and properties. Document what each event means, when it fires, and what properties it includes. This taxonomy prevents duplicate events, ensures data quality, and enables meaningful analysis.
Event properties add context. A "form_submitted" event might include properties like form_name, page_url, utm_source, and utm_campaign. These properties enable segmentation and attribution.
4. Implement Tracking
Choose tracking methods appropriate for your use case:
First-party tracking: JavaScript SDK on your website captures user behavior on your domain
CRM integration: Syncs user data and events with your CRM system
API events: Server-side tracking for important backend events
Ad platform integration: Connects ad interactions to downstream behaviors
Sourceloop provides tracking implementation guides for various platforms, from website tracking to CRM syncing to ad platform connections.
5. Set Up Cross-Platform Tracking
Users interact with businesses across multiple devices and platforms. Cross-platform tracking stitches these interactions into unified user profiles. Someone might visit your website on mobile, return on desktop, and convert via a sales call.
Identity stitching connects anonymous sessions to identified users once they provide information. This creates accurate journey maps showing the complete behavior pattern.
6. Configure Analysis and Monitoring
Set up dashboards, alerts, and analysis workflows:
Security teams configure risk thresholds that trigger alerts
Product teams create retention dashboards and funnel visualizations
Marketing teams build attribution reports showing channel performance
Automate where possible. Anomaly detection algorithms should flag unusual patterns automatically rather than requiring manual monitoring.
7. Enable Cross-Functional Access
Behavioral data benefits multiple teams. Data democratization removes bottlenecks by giving product, marketing, customer success, and leadership teams access to relevant behavioral insights.
Product analytics isn't just for data scientists. Customer-facing teams need behavioral context to serve customers better. Sales teams benefit from seeing which marketing touchpoints influenced their opportunities.
User Behavior Analytics Tools and Platforms
The right tools depend on your use case and existing technology stack.
Security-Focused UEBA Platforms
Splunk Enterprise Security: Includes native UEBA capabilities for threat detection
Palo Alto Networks Cortex XSIAM: Combines UBA with automated incident response
Elastic Security: UEBA features for detecting insider threats and compromised accounts
Exabeam: Machine learning-based UEBA for security operations centers
Product Analytics Platforms
Amplitude: Comprehensive product analytics with behavioral cohorts and journey mapping
Mixpanel: Event-based analytics focused on conversion and retention
Heap: Autocapture approach to behavioral tracking
Pendo: Product analytics combined with in-app guidance
Marketing Attribution and Lead Tracking
Sourceloop: First-party lead source tracking and marketing attribution with CRM integration
Ruler Analytics: Multi-touch attribution connecting marketing to revenue
Dreamdata: B2B revenue attribution with account-level tracking
HockeyStack: Multi-touch attribution focused on B2B SaaS
When evaluating tools, consider:
Integration with your existing stack (CRM, ad platforms, data warehouse)
Data collection methods (first-party, server-side, API)
Analysis capabilities (cohorts, funnels, attribution models)
Privacy compliance features
Pricing model (per-user, per-event, flat monthly)
For businesses that generate leads through forms and sales conversations, lead source tracking software captures the behavioral data that connects marketing spend to revenue outcomes.
FAQ
What is user behavior analytics (UBA)?
User behavior analytics is the process of tracking, collecting, and analyzing how users interact with digital systems to identify patterns, detect anomalies, and improve outcomes. It monitors user actions like logins, clicks, form submissions, and feature usage to understand what users do and why.
Why is it important for companies to track user behavior analytics?
Companies track user behavior for three main reasons: detecting security threats like insider attacks and compromised accounts, improving product experiences by understanding engagement and friction points, and connecting marketing touchpoints to revenue outcomes. Behavioral insights enable data-driven decisions instead of guesswork.
How does UBA differ from SIEM?
UBA focuses on monitoring and analyzing user and entity behavior patterns to detect anomalies, while SIEM (Security Information and Event Management) collects and analyzes security event data from logs and network traffic. UEBA uses machine learning for behavioral baselines, while SIEM uses rule-based correlation. They complement each other in security stacks.
Can UBA detect zero-day attacks?
Yes. UBA detects zero-day attacks and unknown threats by identifying unusual behavior patterns rather than matching known attack signatures. If a user suddenly accesses systems at odd hours, downloads excessive files, or shows other anomalous behaviors, UBA flags the risk even if it doesn't match any known threat profile.
Does UBA require a lot of manual tuning?
Modern UBA and UEBA platforms use machine learning to automatically establish behavioral baselines and reduce manual tuning. Initial setup requires defining goals and instrumenting event tracking, but anomaly detection and risk scoring become increasingly automated over time as algorithms learn what normal behavior looks like.
What is "geo-velocity" in UBA?
Geo-velocity refers to impossible travel scenarios where a user appears to log in from two geographically distant locations within an impossibly short timeframe. For example, if someone logs in from New York at 9 AM and Tokyo at 9:30 AM the same day, this geo-velocity violation suggests credential compromise since no one can physically travel that fast.
Is UBA useful for cloud-only environments?
Yes. UBA works in cloud environments by monitoring user access to cloud applications, data movement within cloud storage, API usage, and interactions with cloud-based systems. Many modern UBA and UEBA platforms are designed specifically for hybrid and cloud-native architectures, tracking behavior across SaaS applications and cloud infrastructure.



 Paid Social


