
Marketing Attribution Software Cost Explained for 2026
Marketing attribution software cost explained — pricing tiers, hidden fees and how to budget for attribution without overpaying in 2026.
Marketing attribution software usually starts around $0 to $500 per month for entry-level tools, $500 to $2,000 per month for mid-market platforms, and $2,000 per month and above for enterprise setups, with some implementations going past $10,000 monthly. The cost almost never comes from the sticker price alone. It rises with your data volume, the number of journeys you track, your CRM and ad platform integrations, and how much setup work your team has to absorb.
If you're reading this, there's a good chance you're in a familiar spot. Google Ads says it drove the lead. Meta says it assisted the same deal. LinkedIn wants credit too. Sales closed revenue in the CRM, but marketing can't cleanly prove which channel started the journey or which one moved it forward.
That's where attribution software enters the conversation, and where cost gets confusing fast.
One vendor looks cheap because the monthly plan is low. Another looks expensive because it includes CRM sync, offline conversion imports, and multi-touch reporting. Then RevOps gets involved and finds out the “cheap” option needs weeks of cleanup work before it can produce numbers anyone trusts. Suddenly the lower subscription isn't the lower cost.
A better way to think about marketing attribution software cost is this: you're not buying a dashboard. You're buying a measurement system that has to fit your funnel, your media spend, and your data reality.
Table of Contents
- Introduction Why Attribution Cost Confuses Every Team
- Understanding the Customer Acquisition Funnel From Awareness to Revenue
- How Much Marketing Attribution Software Really Costs
- How Attribution Models and Measurement Methods Affect Price
- Key Funnel Metrics and Channel Impact at Every Stage
- Choosing the Right Attribution Platform Without Overpaying
- Conclusion Your Next Steps to Budget and Optimize With Confidence
Introduction Why Attribution Cost Confuses Every Team
The confusion usually starts before anyone talks to vendors.
A team runs paid search, paid social, maybe LinkedIn for demand gen, maybe branded search to catch existing intent. Every platform reports success. Each one can show conversions. None of them agree. Finance asks a fair question: if all three channels claim the same pipeline, where should the next budget dollar go?
That's when attribution software sounds simple, until pricing enters the room.
One problem, very different price tags
Some teams only need to answer a narrow question. They want to know which campaign drove a form fill. Others need to connect first touch, demo request, opportunity creation, and closed revenue across a long sales cycle. Those are not the same buying situations, so they shouldn't have the same budget.
A small team with a short path from click to purchase can often work with a lighter setup. A B2B team with handoffs between marketing, SDRs, AEs, and a CRM full of messy fields usually needs more than a pixel and a chart.
Practical rule: Attribution gets more expensive when your funnel has more handoffs than your website has pages.
That's why pricing spreads so widely. Independent 2026 pricing coverage shows common monthly bands from entry-level to enterprise, plus very different charging models such as flat fees and per-user pricing, all shaped by tracked journeys, integrations, support, and data volume (Costbench pricing summary).
Why a cheap tool can become the expensive option
The most common buying mistake is comparing subscription fees without comparing operational work.
If a tool costs less each month but forces your RevOps lead to manually reconcile CRM fields, import offline conversions, and patch broken source tracking, your company is still paying. It's just paying in labor, slower decisions, and lower confidence.
Three questions usually reveal budget range:
- How complex is the journey? A same-day ecommerce purchase is easier to track than a long B2B buying cycle.
- How many systems need to talk? Website, CRM, ad platforms, revenue system, and call tracking all add work.
- Who will maintain it? A self-serve tool can be efficient, or it can become an internal side job.
The rest of the buying decision gets clearer once you map cost to funnel complexity instead of treating attribution like a generic SaaS subscription.
Understanding the Customer Acquisition Funnel From Awareness to Revenue
Attribution makes more sense when you stop thinking about channels first and start thinking about the customer journey.
The easiest analogy is a physical store.
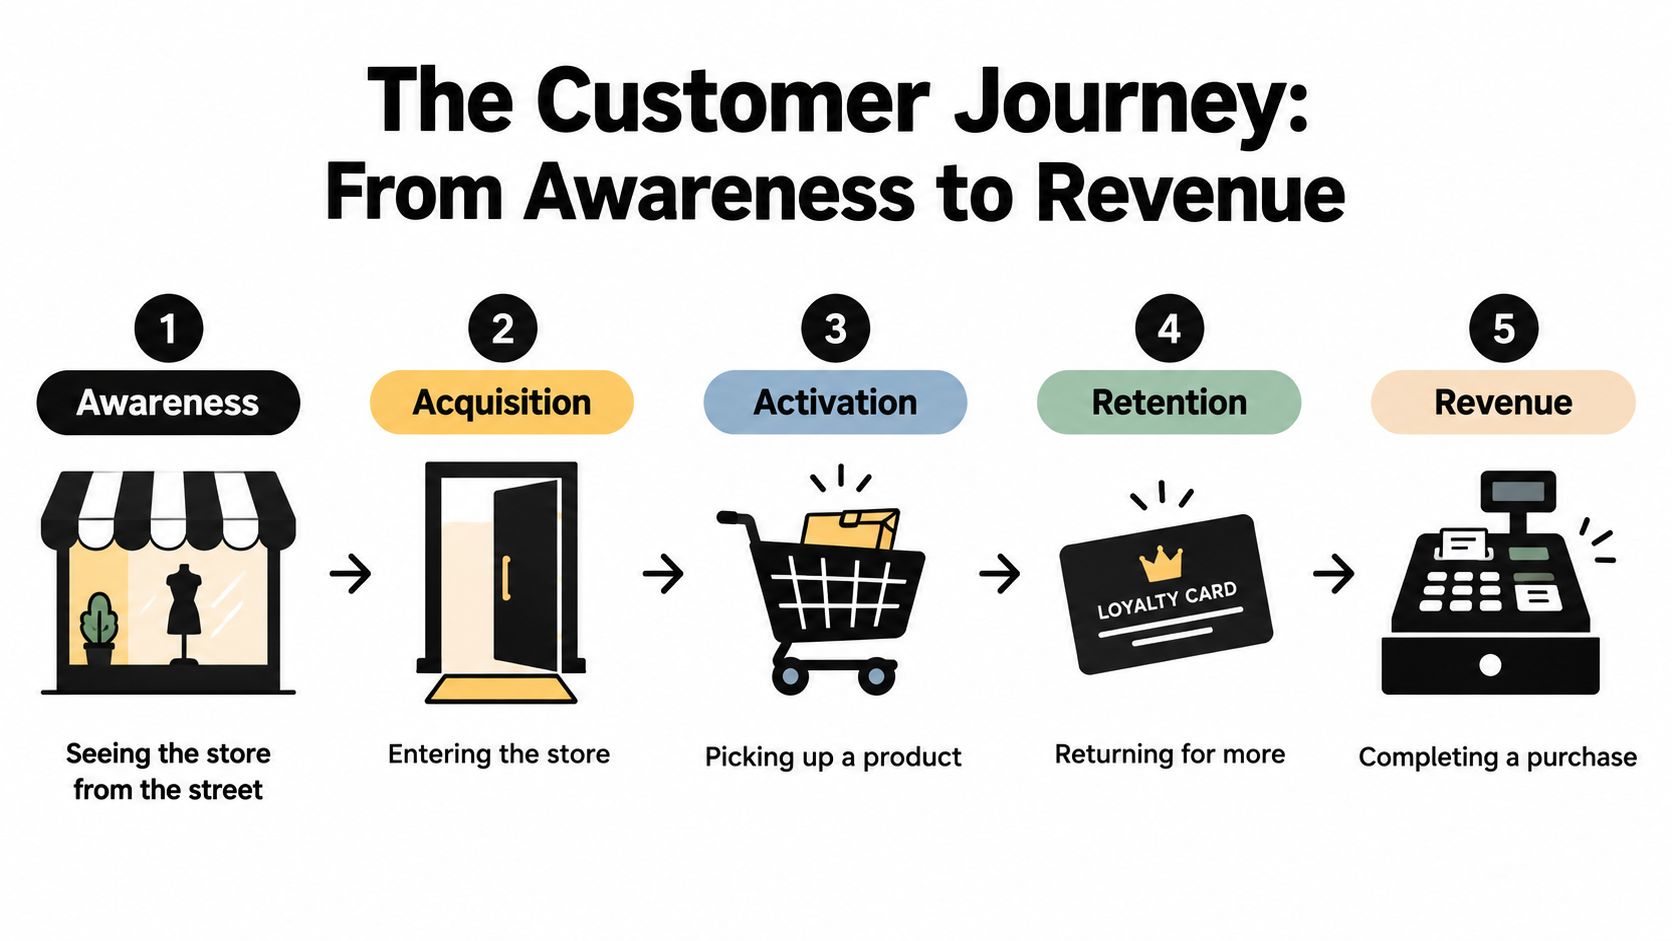
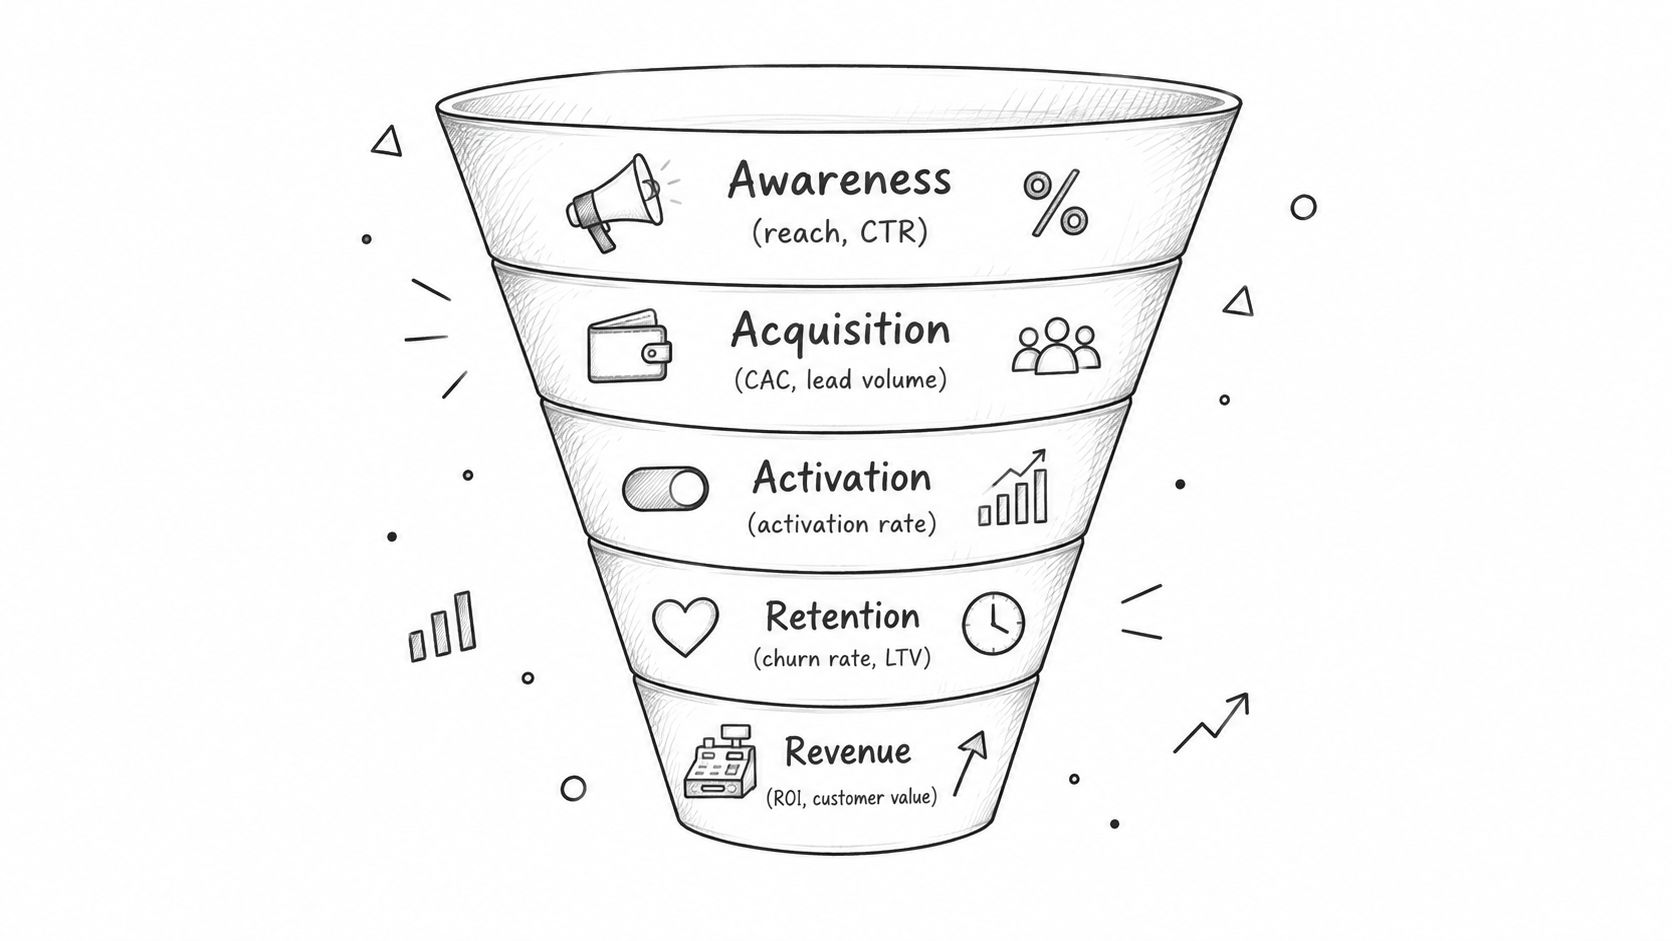
Awareness, acquisition, activation, retention, revenue
A person walks down the street and notices your shop window. That's awareness. They haven't done anything measurable beyond noticing you, but the first impression matters.
They open the door and step inside. That's acquisition. In digital terms, this could be a site visit from Google, Meta, LinkedIn, email, or direct traffic.
They pick up a product and start examining it. That's activation. For a SaaS company, this might be a trial signup, a booked demo, or a completed onboarding step. For ecommerce, it could be adding an item to cart or reaching checkout.
They come back later because the first experience was useful. That's retention. The customer didn't just appear once. They returned, engaged again, or stayed active.
Then they buy. That's revenue.
Why the funnel narrows
Not everyone who sees the store walks in. Not everyone who walks in picks something up. Not everyone who picks something up buys.
That narrowing is the funnel. Attribution exists because every stage can be influenced by a different channel. A LinkedIn ad might create awareness. A Google search might bring the person back. A direct visit might be where they finally convert. If you only credit the final touch, you often undervalue the earlier channel that started the journey.
Here's the simple version:
- Visits are not leads
- Leads are not qualified opportunities
- Opportunities are not revenue
That sounds obvious, but plenty of teams still budget as if all conversions are equal.
Revenue changes the decision
When you connect actual revenue back to the original source, channel decisions get sharper.
A campaign that produces lots of low-intent form fills can look great in surface-level reporting. Another campaign might generate fewer leads but more real pipeline. If your attribution system can connect revenue in Stripe or closed-won data in your CRM back to the first and supporting touches, your budget conversations change from “which ad got the most conversions?” to “which journey produced customers?”
A funnel is not just a reporting shape. It's a chain of evidence from attention to cash.
A useful mental model is a five-step path: see, visit, engage, return, buy. If your software only measures the last step, it can't explain the full journey that created the result.
How Much Marketing Attribution Software Really Costs
The cleanest answer is that there isn't one market price.
Independent 2026 pricing guides place entry-level tools at $0 to $500 per month, mid-market solutions at $500 to $2,000 per month, and enterprise platforms at $2,000 per month and above, with some implementations exceeding $10,000 monthly (2026 pricing bands).
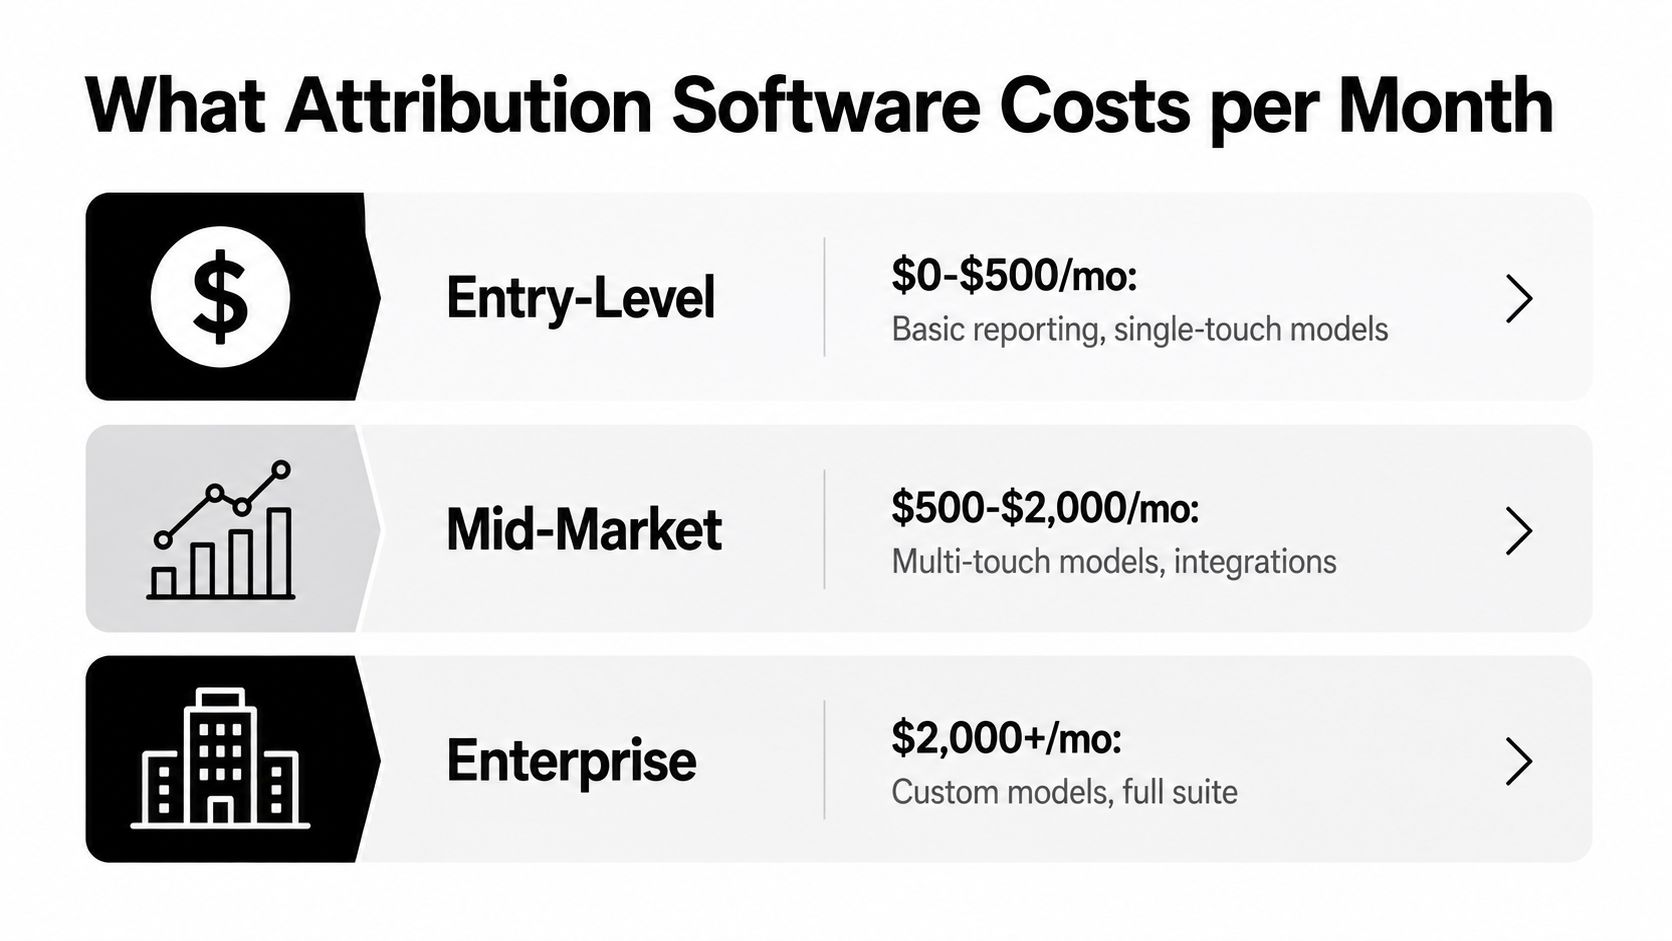
The three pricing bands
Those bands are useful because they line up with different business situations.
| Tier | Typical Monthly Cost | Primary Cost Drivers |
|---|---|---|
| Entry-level | $0 to $500 | Basic tracking, fewer integrations, simpler models |
| Mid-market | $500 to $2,000 | Multi-touch reporting, CRM sync, more tracked journeys |
| Enterprise | $2,000+ | High data volume, deeper integrations, support, custom measurement needs |
Another independent review found sampled tools using flat monthly fees from $0 to $2,000, while per-user pricing ranged from $25 to $20,000 per user per month across the tools reviewed (pricing model spread). That range looks wild because vendors price for very different use cases.
A better benchmark is percentage of media spend
For many teams, attribution software is easier to budget as a share of media spend rather than as a standalone software line.
One 2026 guide places self-service tools for brands spending $500K to $2M annually on media at about 2% to 4% of spend, while mid-market platforms for brands spending $2M to $10M annually come in around 1.5% to 3% (media-spend benchmark).
That framework helps because software cost tends to rise with the same thing your ad budget creates: more sessions, more paths to conversion, more event volume, and more systems to reconcile.
If your ad spend grows, your attribution problem usually gets wider before it gets easier.
What actually drives the bill
Subscription plans rarely tell the whole story. Cost usually follows these variables:
- Tracked journeys: More touchpoints per customer means more identity stitching and more reporting logic.
- Integration depth: Connecting ad platforms is one thing. Syncing CRM stages, offline conversions, and revenue is another.
- Support model: Self-serve plans cost less upfront. Hands-on support costs more, but may save internal labor.
- Data volume: More visits, leads, opportunities, and purchases create more processing work.
A practical budgeting exercise is to line up your own funnel before you line up vendors. Count the channels that matter, the systems involved, and the conversion steps you need to trust.
If you also want to benchmark software cost against agency economics, managed ads service pricing details can be useful context. It helps teams see attribution cost in relation to the media management cost sitting beside it.
For rough planning, a free marketing attribution calculator can help you pressure-test what a realistic budget might look like before you enter demos.
How Attribution Models and Measurement Methods Affect Price
Two tools can sit in the same broad price band and still produce very different answers.
That usually comes down to the attribution model and the measurement method underneath it.
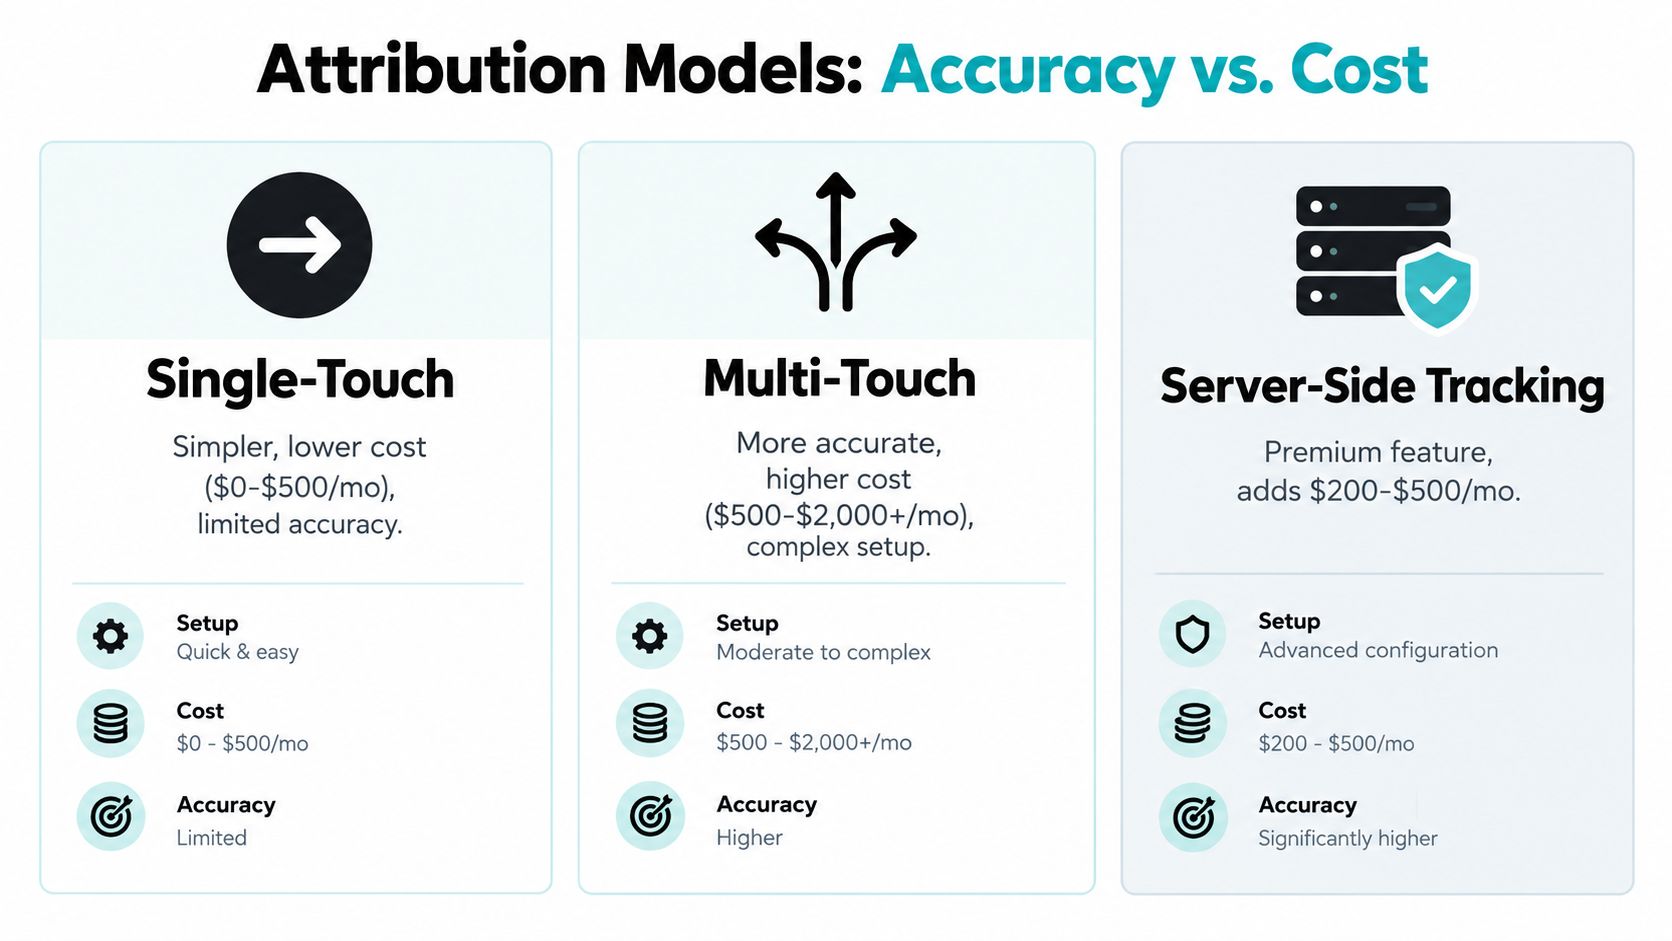
Single-touch costs less because it asks less of the system
A single-touch model gives all credit to one interaction, often the first or the last. It's simpler to implement because the software doesn't need to distribute value across many steps in the journey.
That simplicity often keeps cost lower. It also keeps the answer narrower.
If someone sees a paid social ad, returns via organic search, clicks a brand search ad, then books a demo, a last-click model may credit only the final search ad. That's easy to report, but it can distort where demand came from.
Multi-touch costs more because it tracks the whole path
A multi-touch setup tries to measure several interactions across the journey. That means more event capture, more identity matching, and usually more integrations into CRM or revenue systems.
For teams with long sales cycles or heavy channel mix, that added complexity is often worth it. If you want a deeper primer on full-funnel attribution, it helps to see how channel influence changes at different stages instead of only at conversion.
This walkthrough helps make the tradeoff easier to visualize.
Measurement method changes setup work
The model is only part of the story. The method matters too.
A lightweight pixel can capture some website activity. A more capable setup may also sync offline conversions, map CRM stages, and push qualified events back into ad platforms. Once you start stitching web, ad, CRM, and revenue data across longer journeys, implementation work grows.
That's why “cheap” last-click tools often stay cheap. They're measuring a smaller slice of reality.
By contrast, a more complete system has to answer harder questions:
- Did this lead become an opportunity?
- Did the opportunity close?
- Which earlier touches influenced the outcome?
- Can ad platforms optimize toward qualified customers instead of raw form fills?
A lower-cost model can save money upfront and lose money in budgeting decisions later.
If you're evaluating whether a multi-touch setup fits your sales cycle, this guide on how to implement multi-touch attribution is a useful next step because the implementation burden is often what separates a good purchase from a frustrating one.
Key Funnel Metrics and Channel Impact at Every Stage
Attribution software earns its keep when it helps you improve decisions at each stage of the funnel, not when it adds another dashboard.
The metrics that matter by stage
Different channels tend to influence different moments.
- Awareness: Reach, impressions, and click-through patterns help you understand whether people are noticing you at all.
- Acquisition: Visits, lead volume, and customer acquisition cost show whether traffic is turning into identifiable demand.
- Activation: Demo bookings, trials, qualified conversations, or meaningful product actions tell you whether interest is becoming intent.
- Retention: Repeat purchases, returning usage, and expansion signals show whether the first conversion led to an ongoing relationship.
- Revenue: Pipeline contribution, closed-won outcomes, and revenue by source help you see which journeys create business value.
The key is not to treat all metrics as equal.
A campaign can be strong at awareness and weak at revenue. Another can look average at top-of-funnel but consistently influence qualified pipeline. Good attribution helps you spot that difference before you overfund the wrong channel.
Why channels get over-credited
Without attribution, channels often get credit for the part they can see.
Paid search often captures high-intent demand near conversion. Paid social may influence earlier discovery. LinkedIn may help with account awareness before someone ever fills out a form. Email may reactivate people who were already warmed up by paid media.
If each platform reports in isolation, double-counting shows up fast. Teams end up defending channels based on platform dashboards instead of shared funnel evidence.
A better operating habit is to look at channels by stage contribution, not just by final conversion count. Teams that manage several ad accounts often also need cleaner cross-account reporting, and resources on how to optimize multi-account ad workflows can help keep channel analysis from turning into spreadsheet sprawl.
How teams use this in practice
Lean teams usually get the most value from three views:
- A funnel view to spot where drop-off is happening.
- A contacts or lead journey view to inspect real paths, not just averages.
- A channel-to-revenue view to guide budget changes.
When attribution is working, budget conversations get shorter because the evidence is easier to trust.
That's the return. Not prettier reports. Better budget movement.
Choosing the Right Attribution Platform Without Overpaying
The smartest buying question isn't “which tool is cheapest?”
It's “which tool gives us reliable revenue attribution with the least operational drag?”
Start with total cost of ownership
Independent 2026 breakdowns note that companies spending under $25,000 per month on ads should budget roughly $500 to $1,500 per month for software plus $1,000 to $3,000 for initial implementation, while larger B2B deployments can add £20,000 to £50,000 in one-time costs for CRM cleanup, integration engineering, and rollout support (implementation cost breakdown).
Separate 2026 coverage on B2B attribution software also says annual software cost can range from £1,000 to £150,000+ per year, with the same £20,000 to £50,000 one-time implementation range appearing in mid-to-enterprise rollouts (B2B attribution TCO guide).
Those numbers explain why many teams regret buying on monthly price alone.
What to check before you sign
Use this checklist when a vendor demo goes well and you're tempted to move fast:
- Implementation burden: Ask who handles CRM field mapping, offline conversion setup, and source normalization.
- Data cleanup needs: If your CRM stages or campaign naming are messy, expect more work before reports become trustworthy.
- Maintenance load: Find out whether your team must manually maintain mappings and reconciliation rules.
- Conversion depth: Check whether the platform tracks just form fills, or also meetings, qualified pipeline, and revenue.
- Ad platform feedback loops: Ask if qualified offline conversions can sync back to Google Ads, Meta, and LinkedIn.
- Compliance requirements: If you operate in regulated regions, make sure privacy controls are not an afterthought.
A lean-team lens
For small and mid-sized teams, practical fit matters more than enterprise theater.
You usually want a platform with a lightweight snippet, automatic capture of forms and bookings, two-way CRM sync, and clean reporting that marketing and RevOps can both use. One example is SourceLoop, which is designed to tie visits, leads, bookings, and payments back to source while syncing with CRMs and ad platforms. If you're comparing that category against other options, this breakdown of Ruler Analytics pricing is useful because it highlights where plan cost and rollout effort can diverge.
The expensive mistake isn't overbuying features alone. It's underestimating the labor required to make a cheaper tool usable.
That's the contrarian part of attribution pricing. A higher subscription can still be the lower-cost decision if it removes cleanup, engineering, and manual reporting work.
Conclusion Your Next Steps to Budget and Optimize With Confidence
Many start by asking, “What does attribution software cost?”
The better question is, “What level of attribution can our funnel support, and what will it cost to make that data trustworthy?”
That shift changes the whole buying process.
A practical way to budget
Start with your funnel, not the vendor list.
- Audit your current journey: Note where leads come in, where they get qualified, and where revenue is recorded.
- List your systems: Website, CRM, ad platforms, booking tools, payment tools, and any offline steps.
- Estimate complexity: Short ecommerce path, long B2B cycle, or something in between.
- Benchmark budget: Use the monthly bands and media-spend lens to place your company in a realistic range.
- Pressure-test rollout effort: Ask how much cleanup and maintenance your team will own after implementation.
What confidence looks like
A good attribution setup doesn't need to be perfect on day one. It needs to be useful, trusted, and maintainable.
If a platform helps you connect source to qualified outcomes and revenue without turning RevOps into a full-time repair function, it's probably in the right zone. If the tool looks affordable but creates ongoing manual work, the true cost is already higher than it appears.
Start small if you need to. Measure channel influence on pipeline, not just surface conversions. Then scale budget toward the sources that repeatedly create real revenue.
The goal isn't the cheapest tool. It's the tool that gives your team defensible answers when budget decisions matter.

 Paid Social


