
8 Best Cross Channel Analytics Tools [Compared & Ranked]
Find the best cross channel analytics tools for 2026. Compare top platforms, models, and pricing to tie every channel to real pipeline and revenue.
Table of contents
- Best Cross Channel Analytics Tools Comparison
- 1. SourceLoop: Best for B2B Marketing Attribution and Revenue
- Pros
- Cons
- Pricing
- 2. Google Analytics 4: Best Free Cross-Channel Analytics Tool
- Pros
- Cons
- Pricing
- 3. HubSpot Marketing Hub: Best for CRM and Marketing Analytics
- Pros
- Cons
- Pricing
- 4. Dreamdata: Best for B2B Customer Journey Analytics
- Pros
- Cons
- Pricing
- 5. HockeyStack: Best for Advanced B2B Revenue Analytics
- Pros
- Cons
- Pricing
- 6. Ruler Analytics: Best for Lead and Call Attribution
- Pros
- Cons
- Pricing
- 7. Matomo: Best for Privacy-Focused Analytics
- Pros
- Cons
- Pricing
- 8. Adobe Analytics: Best for Enterprise Cross-Channel Analytics
- Pros
- Cons
- Pricing
Cross-channel analytics helps you see how different marketing channels work together to drive leads, customers, and revenue.
We researched the leading tools using official product pages, current pricing, G2 reviews, and recent Reddit discussions to find the best options for different use cases.
Best Cross Channel Analytics Tools Comparison
| Tool | Best For | G2 Rating | Starting Price |
|---|---|---|---|
| SourceLoop | B2B marketing attribution and revenue | 4.8 | $49/mo |
| Google Analytics 4 | Free cross-channel web analytics | 4.5/5 | Free |
| HubSpot Marketing Hub | CRM and marketing analytics | 4.4/5 | $7/mo/seat |
| Dreamdata | B2B customer journey analytics | 4.7/5 | Free |
| HockeyStack | Advanced B2B revenue analytics | 4.6/5 | $2,200/mo |
| Ruler Analytics | Lead and call attribution | 4.6/5 | $400/mo |
| Matomo | Privacy-focused analytics | 4.2/5 | Free |
| Adobe Analytics | Enterprise cross-channel analytics | 4.2/5 | Custom |
1. SourceLoop: Best for B2B Marketing Attribution and Revenue
Best for: B2B companies that want to connect marketing campaigns with qualified leads, pipeline, customers, and revenue.
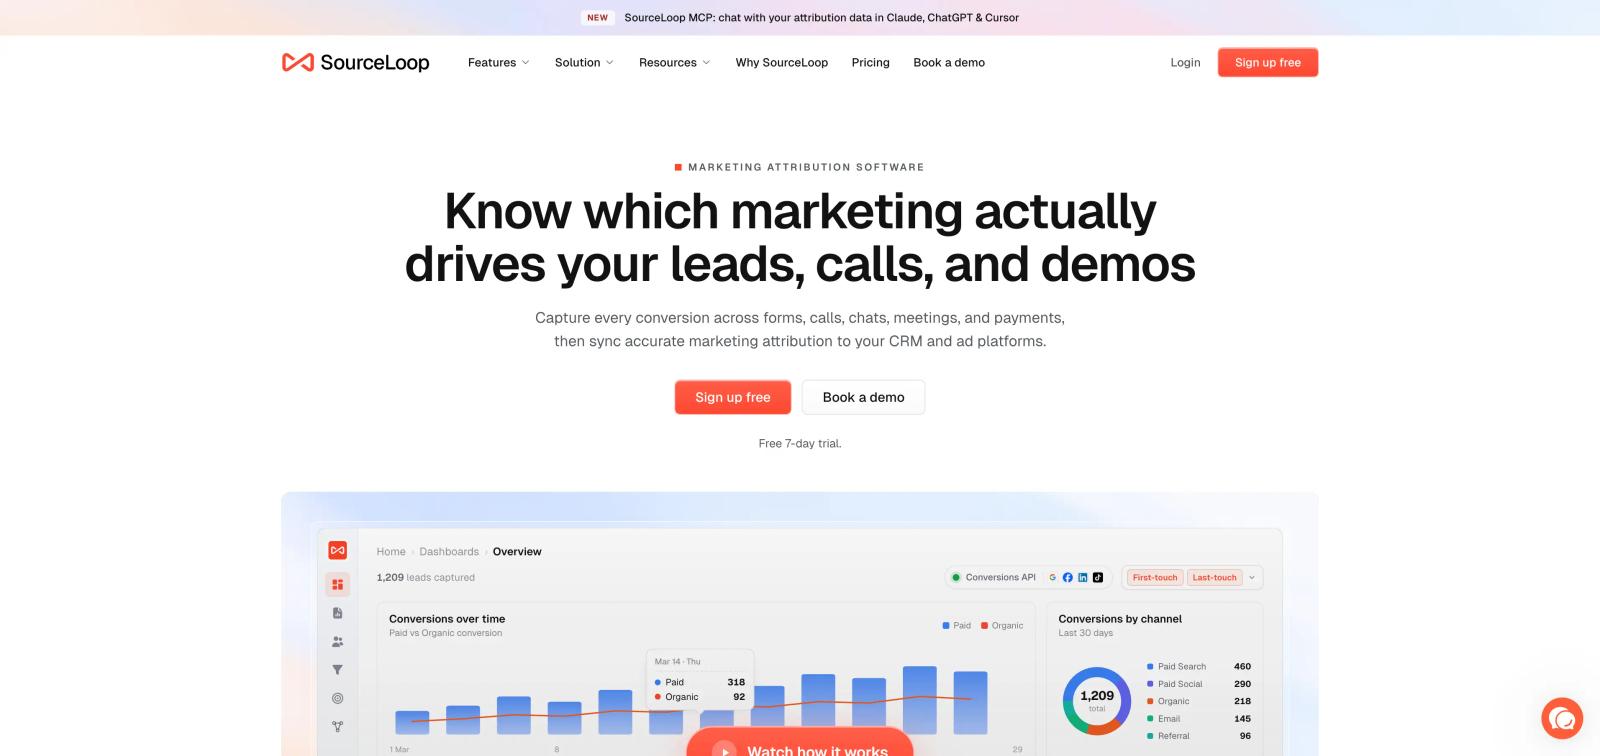
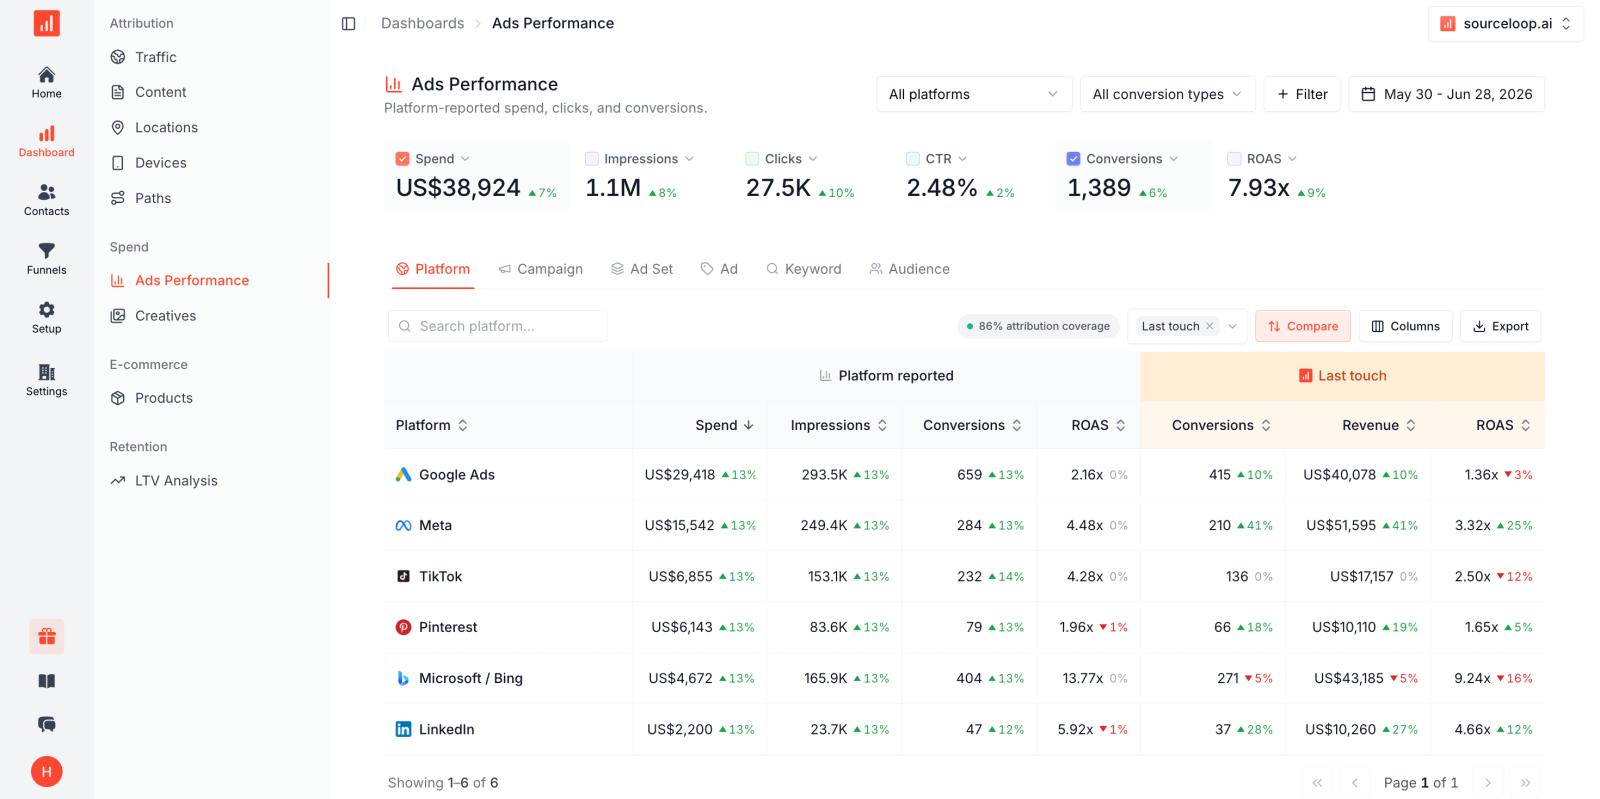
SourceLoop tracks the customer journey from the first marketing touchpoint to the final conversion. It connects data from Google Ads, Meta, LinkedIn, TikTok, GA4, CRMs, Stripe, and other sources, so you can see how different channels contribute to revenue.
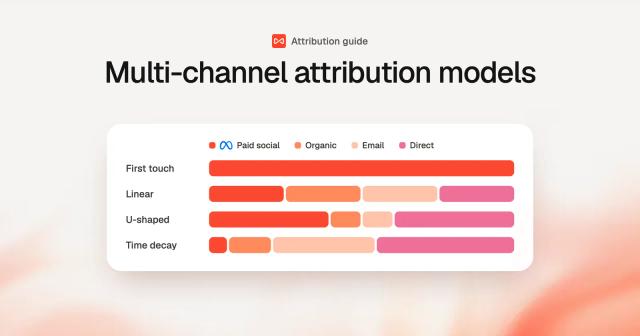
It also tracks forms, calls, chats, meetings, signups, payments, and CRM stages. You can use first-touch, last-touch, linear, U-shaped, W-shaped, and time-decay attribution models.
Pros
- Full-funnel attribution: Connects ad clicks and website visits with forms, calls, meetings, chats, CRM stages, customers, and revenue.
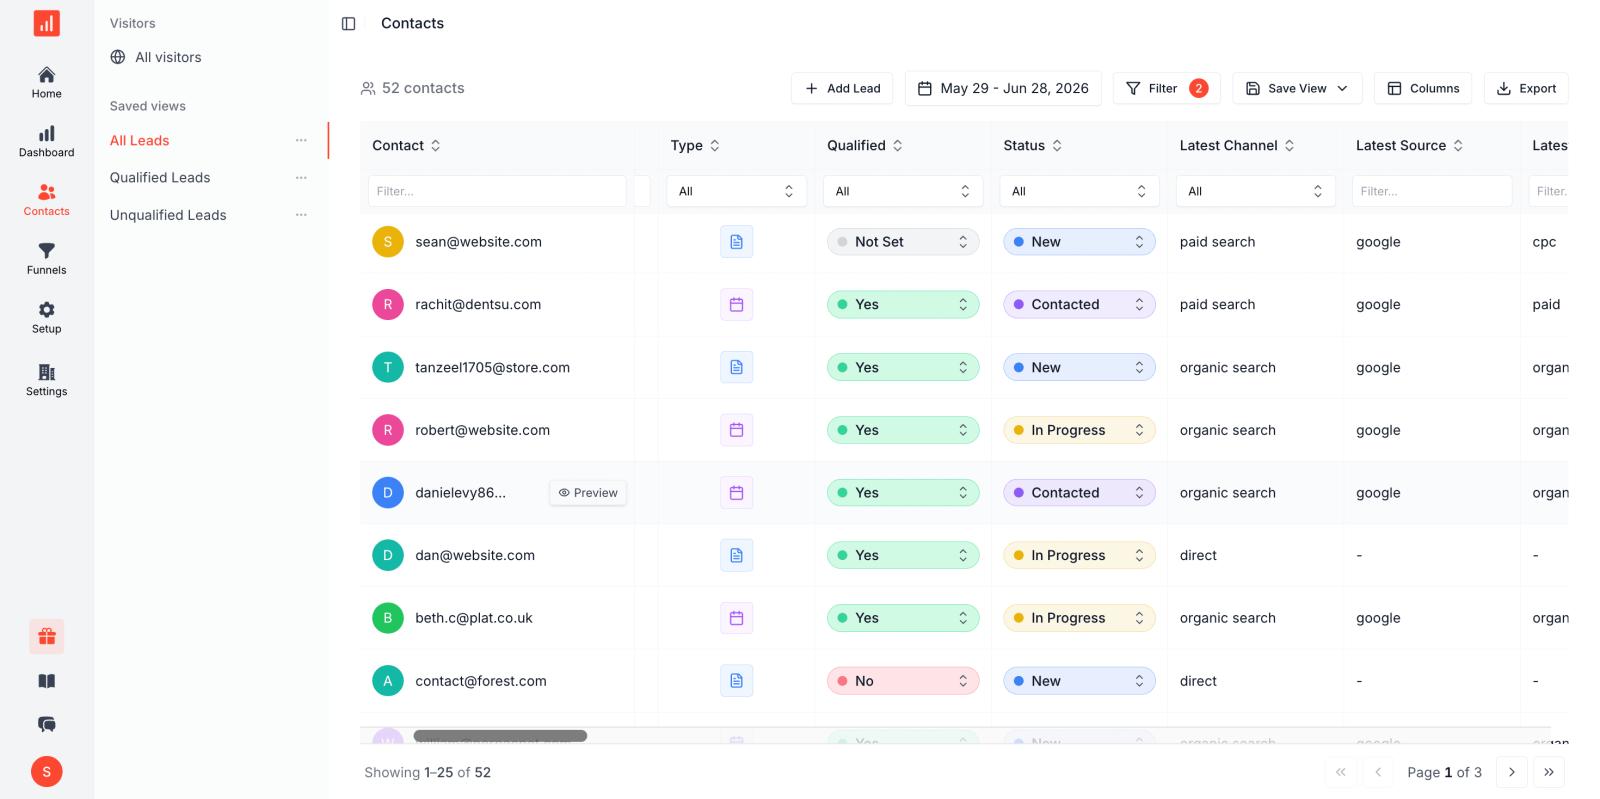
- Strong B2B tracking: Helps connect marketing sources with MQLs, SQLs, opportunities, closed-won deals, and revenue.
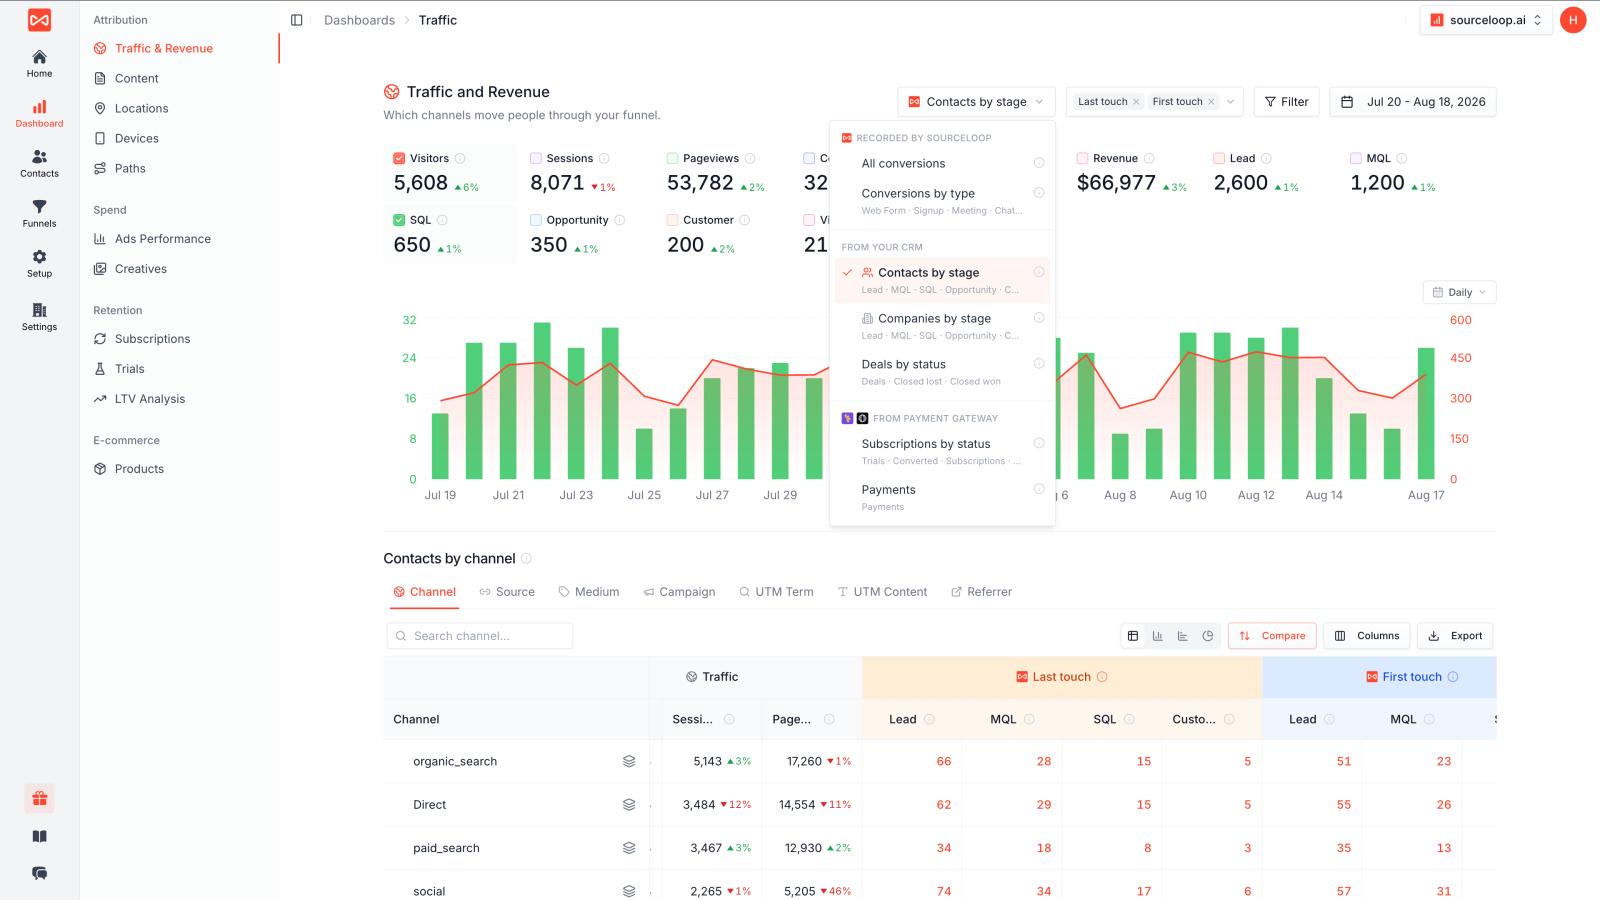
- Multiple attribution models: Supports first-touch, last-touch, linear, time-decay, U-shaped, and W-shaped models.
- Online and offline conversions: Tracks conversions such as forms, calls, meetings, chats, and payments in one journey.
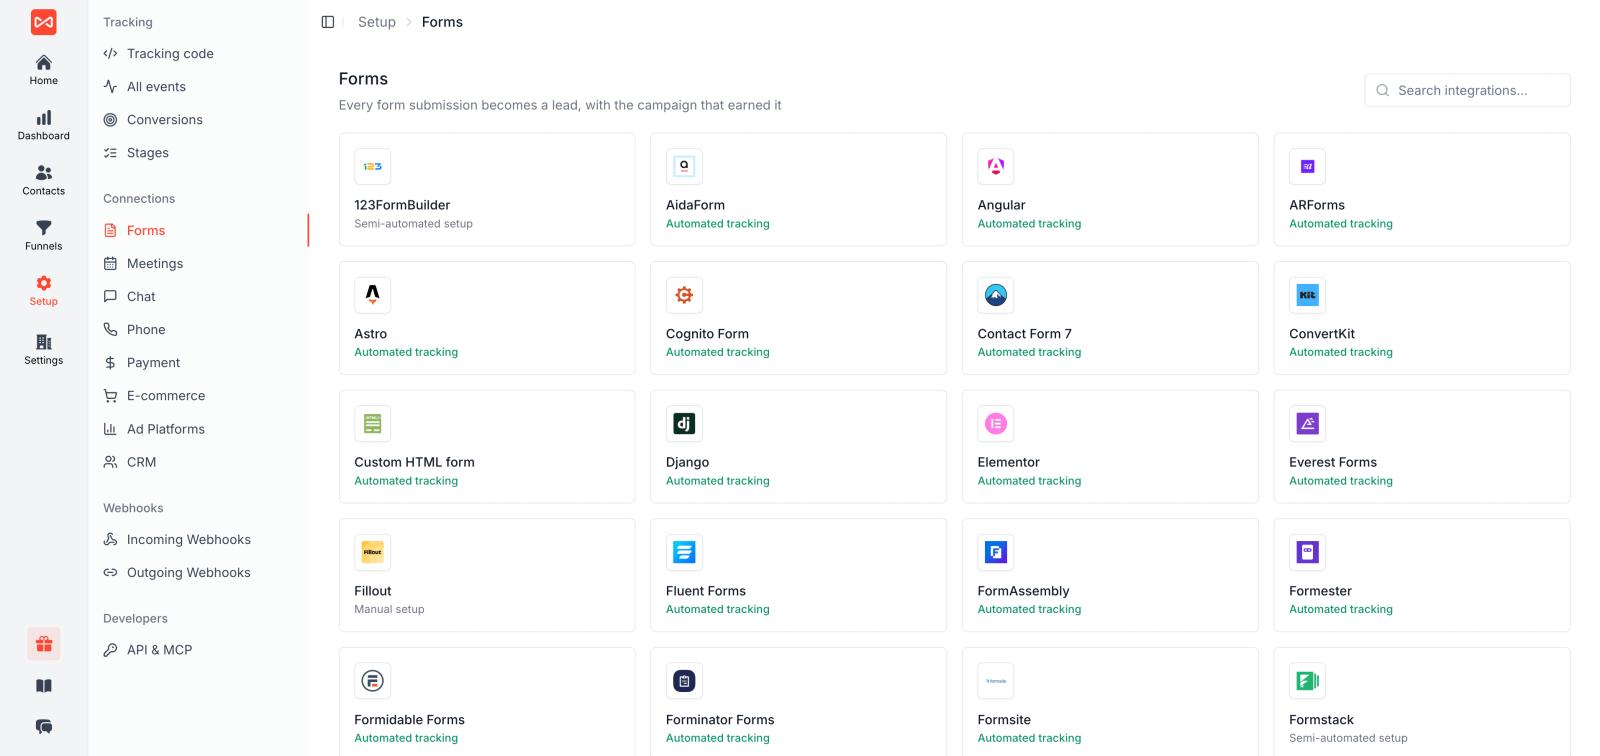
- Ad and CRM integrations: Works with Google Ads, Meta, LinkedIn, HubSpot, Salesforce, Pipedrive, Stripe, and more.
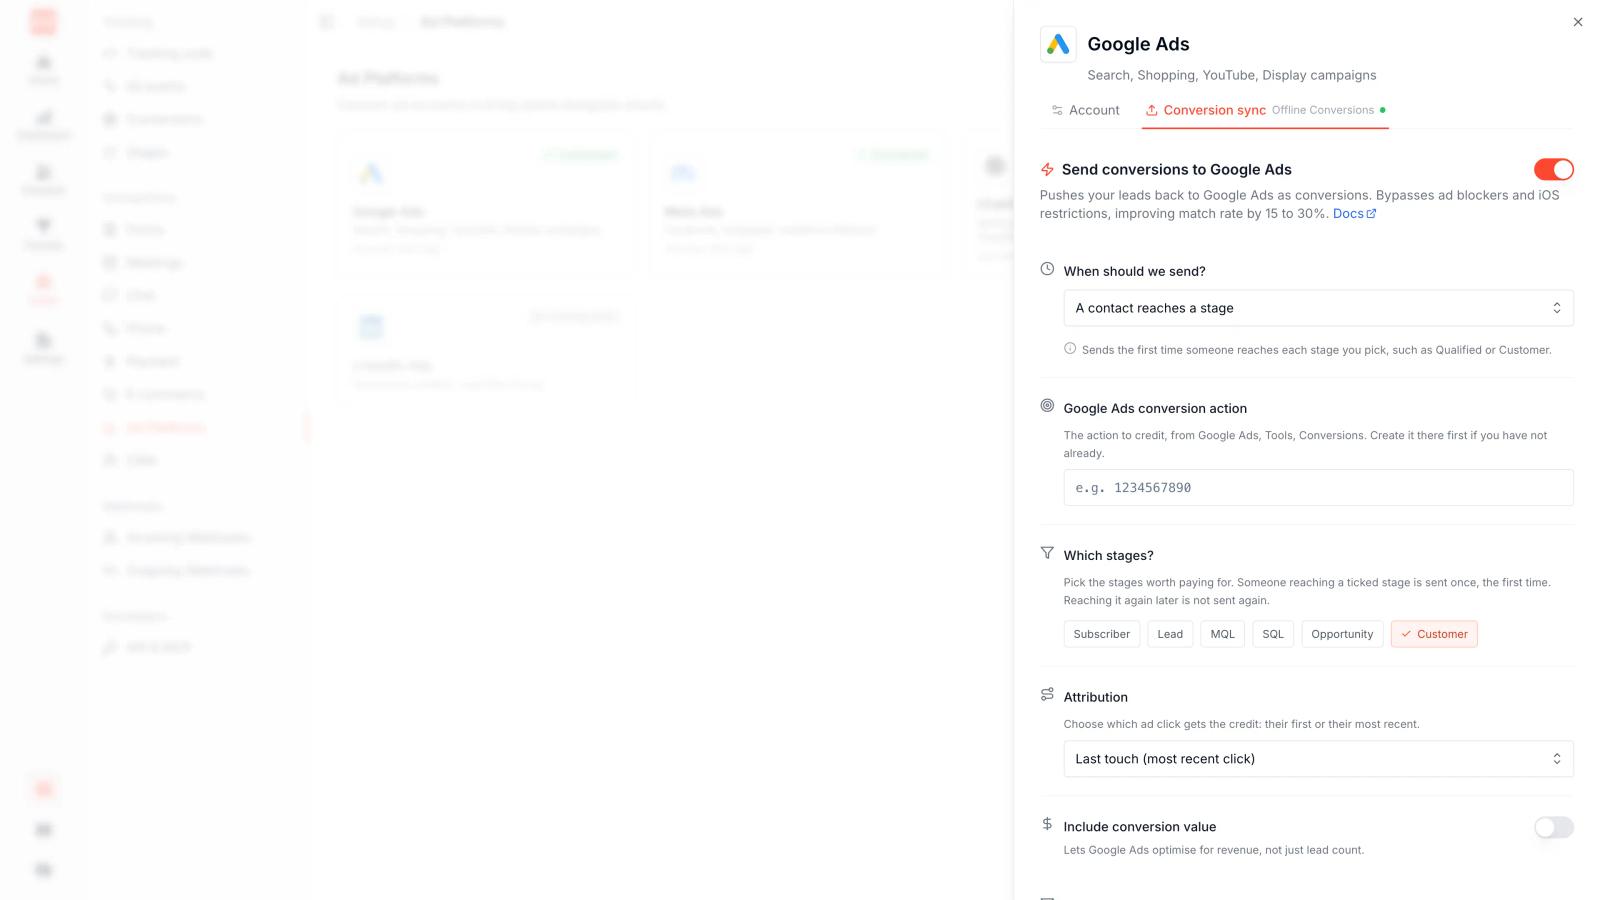
- Better ad optimization: Can send qualified conversion data back to ad platforms through server-side tracking.
Cons
- Can be more than you need if you only want basic website analytics
Pricing
Starts at $49/month. Professional is $99/month and Agency is $249/month. There is also a 7-day free trial with no credit card required.
2. Google Analytics 4: Best Free Cross-Channel Analytics Tool
Best for: Businesses that want a free way to analyze traffic, campaigns, conversions, and channel performance.
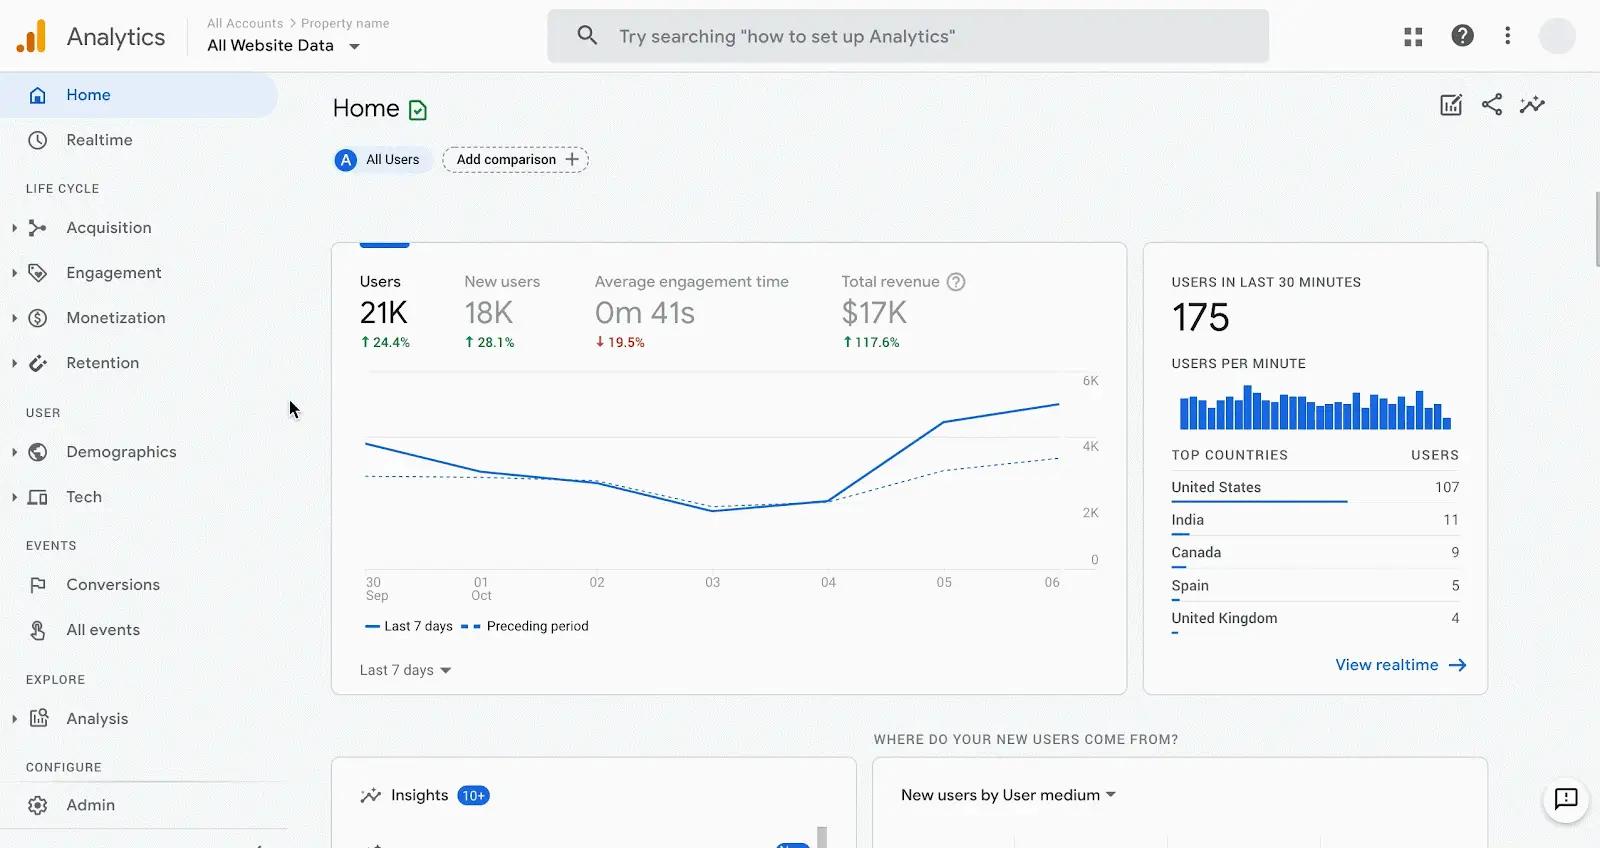
Google Analytics 4 gives you reports for paid and organic channels, campaign performance, conversions, and customer journeys. Its cross-channel reporting can bring together data from different marketing sources, although some advertising integrations require linking Google products or importing campaign data.
GA4 also supports data-driven attribution and last-click attribution. Its older first-click, linear, time-decay, and position-based models are no longer available in the current attribution settings.
Pros
- Free for most businesses
- Strong website and campaign analytics
- Excellent integration with Google Ads
- Large ecosystem of integrations
- Useful reports for channels, campaigns, and conversions
Cons
- Can take time to learn
- Attribution becomes harder for complex B2B journeys
- CRM revenue tracking requires additional setup
- Reporting can feel complicated for new users
Pricing
The standard version is free. Google Analytics 360 is available for larger enterprises with custom pricing.
3. HubSpot Marketing Hub: Best for CRM and Marketing Analytics
Best for: Companies that already use HubSpot CRM and want marketing, lead, and customer data in one system.
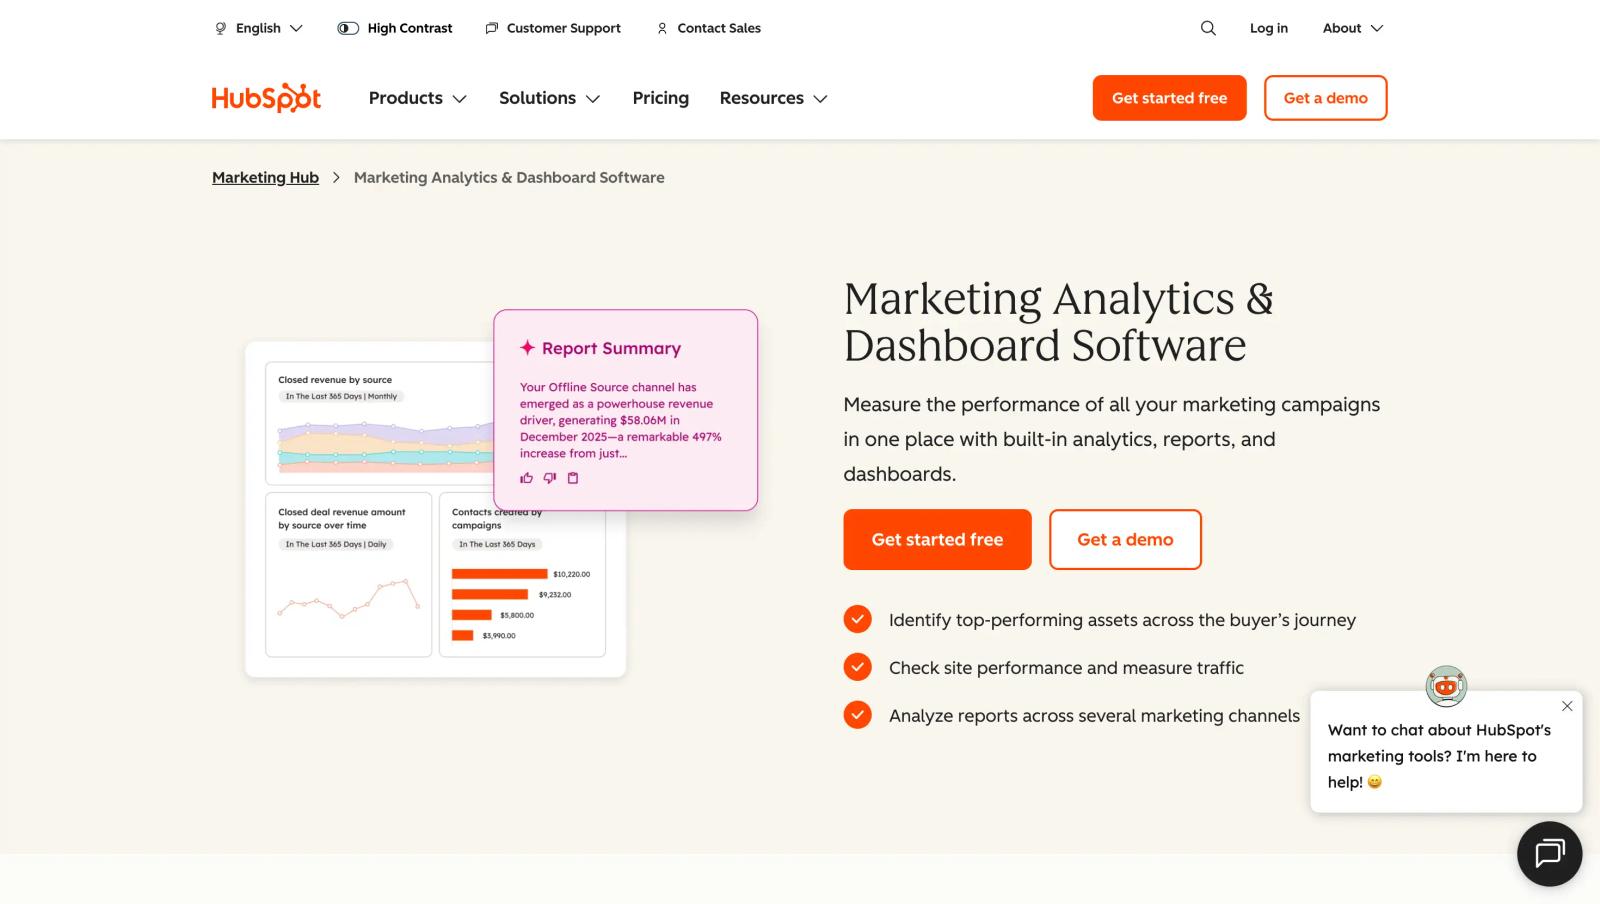
HubSpot Marketing Hub combines marketing automation, lead capture, campaigns, reporting, and CRM data. It is especially useful when your marketing team wants to follow a contact from the first interaction through lead nurturing and eventually into the sales pipeline.
Pros
- Marketing and CRM data work together: You can connect marketing activity with contacts, deals, and customer information instead of managing separate reporting systems.
- Strong marketing automation: Forms, email campaigns, landing pages, workflows, and lead nurturing are available in the same platform.
- Large integration ecosystem: HubSpot supports more than 2,000 apps and services, making it easier to bring other marketing and business data into the platform.
- Good for teams that want one platform: If you already use HubSpot for CRM and sales, adding marketing analytics does not require introducing another major system.
- Useful customer journey reporting: Higher plans include features for tracking revenue and mapping customer journeys, which makes the platform more useful as your marketing operation grows.
Cons
- Costs can increase quickly: The entry-level product is inexpensive, but Professional and Enterprise plans become significantly more expensive as you need advanced automation, reporting, contacts, and users.
- Advanced features require higher plans: Some of the more useful marketing and revenue features are not available at the lower tiers.
- Can be more than an analytics tool: If you only need cross-channel attribution, paying for a full marketing automation and CRM platform may not make sense.
- Large setups require more management: As you add workflows, contacts, campaigns, and integrations, maintaining a clean HubSpot setup becomes increasingly important.
Pricing
HubSpot has free tools, while Marketing Hub Starter starts around $20/month on the current monthly pricing page. Professional starts at $890/month and Enterprise at $3,600/month, with additional contact and onboarding costs depending on the plan.
4. Dreamdata: Best for B2B Customer Journey Analytics
Best for: B2B companies with long sales cycles and multiple marketing and sales touchpoints.
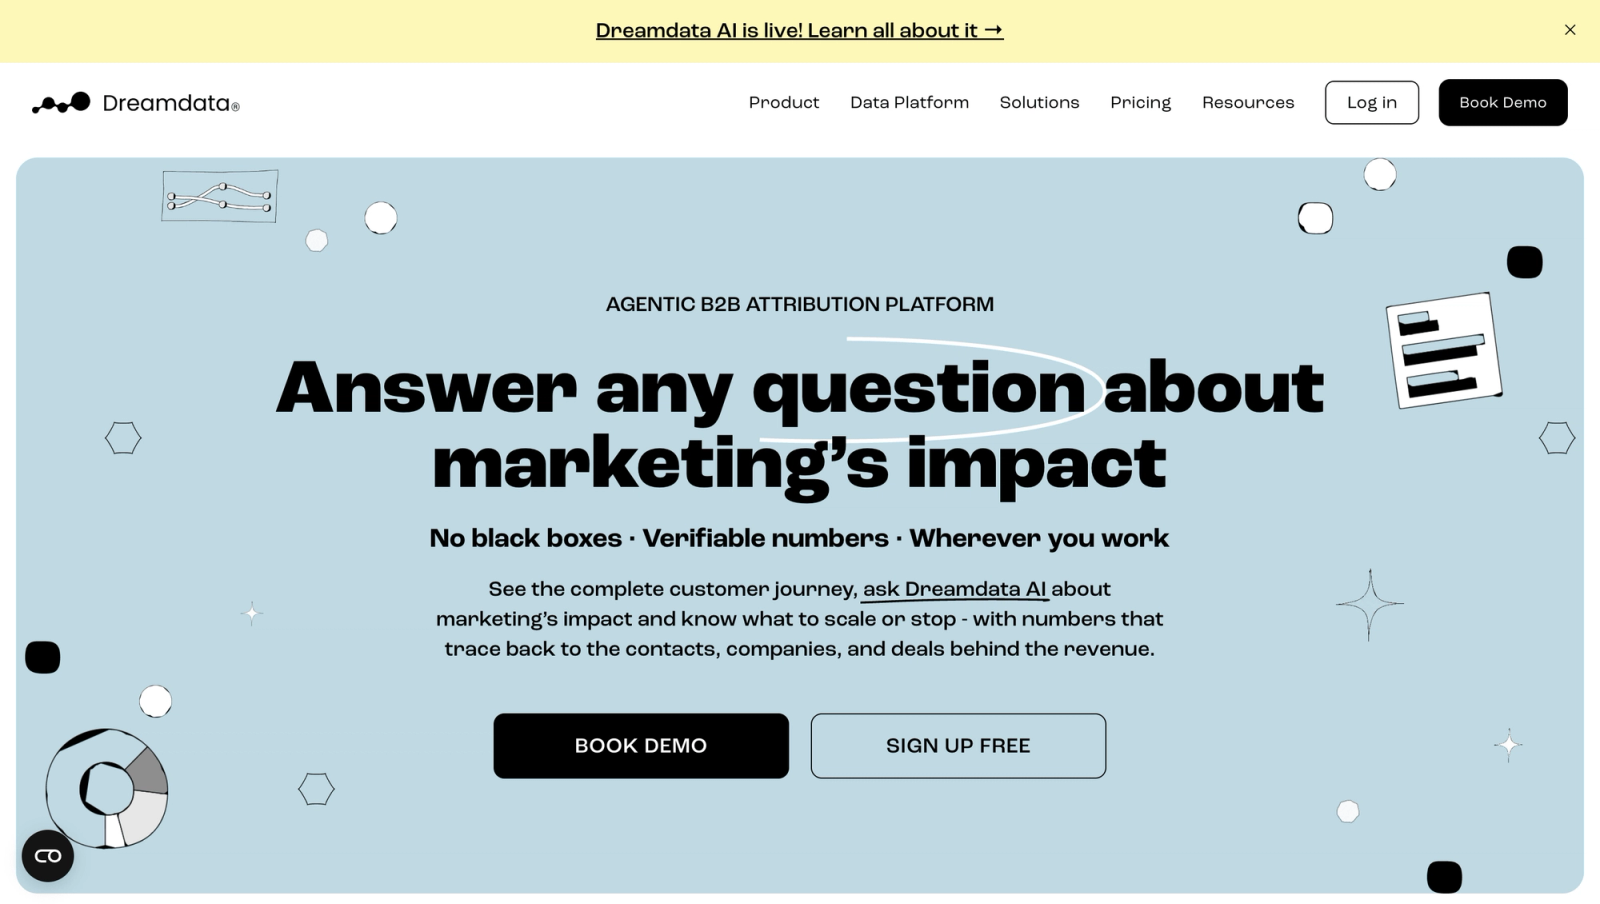
Dreamdata focuses heavily on B2B customer journeys. It helps connect marketing activity with accounts, opportunities, pipeline, and revenue, making it useful when a simple website conversion does not tell the whole story.
Pros
- Built around B2B journeys: The platform is designed for businesses where several marketing and sales interactions can happen before a deal closes.
- Strong revenue attribution: It helps connect marketing activity with pipeline and revenue rather than stopping at leads or website conversions.
- Account-level analysis: This is useful for ABM teams that need to understand engagement across multiple people from the same company.
- Useful for long sales cycles: You can analyze the different interactions that happen between the first marketing touch and the eventual deal.
- Good fit for marketing and revenue teams: The focus goes beyond campaign reporting and into the relationship between marketing activity and business outcomes.
Cons
- More setup than basic analytics: Connecting CRM, advertising, website, and revenue data takes more work than installing a standard analytics tool.
- Works best with clean data: The quality of the attribution depends heavily on how consistently your CRM and marketing systems record information.
- Can be unnecessary for simple funnels: A company with a short buying journey may not need a dedicated B2B attribution platform.
- Advanced features are sales-led: Teams looking for a simple, predictable paid plan will find fewer public pricing details than with simpler analytics products.
Pricing
Dreamdata has a free plan covering B2B web analytics, cookie and cookieless tracking, company identification, audience building, ad spend reporting, and B2B benchmarks. Advanced attribution and activation features use custom pricing.
5. HockeyStack: Best for Advanced B2B Revenue Analytics
Best for: B2B marketing and revenue teams that need deeper analysis across marketing, sales, and revenue data.
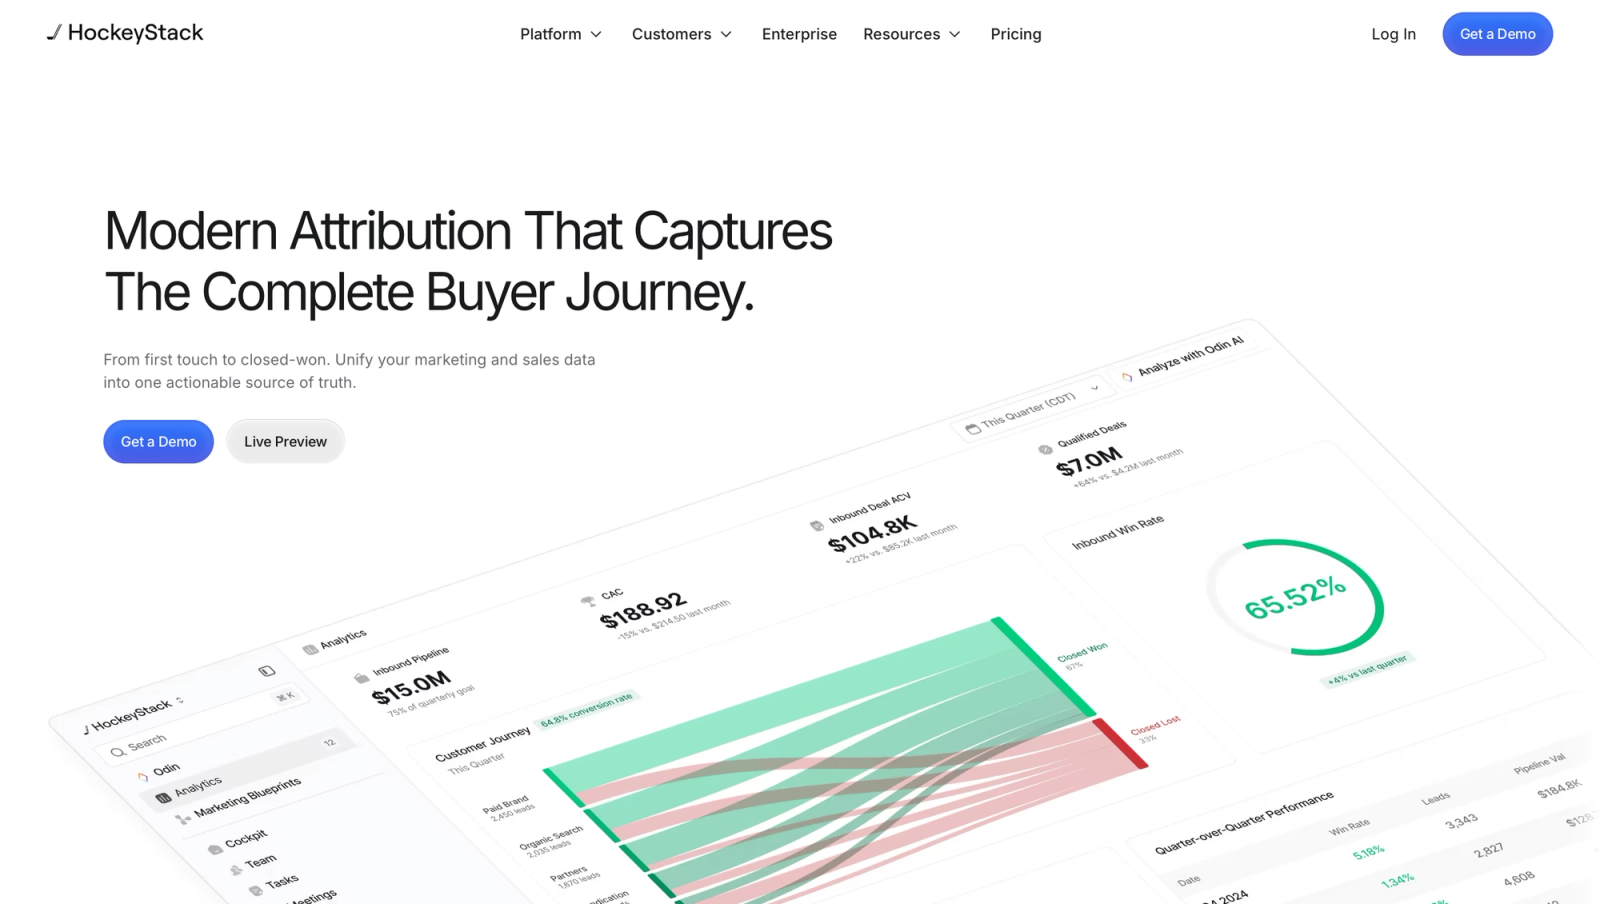
HockeyStack brings marketing, sales, and revenue data together and is designed for teams that want more than standard campaign reporting. It is particularly relevant for companies with complex B2B funnels, multiple GTM channels, and large amounts of customer and account data.
Pros
- Connects marketing and revenue data: You can analyze marketing activity alongside sales and revenue information rather than treating them as separate systems.
- Strong B2B focus: The platform is designed around the needs of revenue teams, including complex buying journeys and account-level analysis.
- Real-time reporting: HockeyStack highlights real-time ROI and performance reporting, which can be useful when teams need to monitor campaigns without waiting for manual reporting cycles.
- Handles complex data environments: The company offers custom setups and hands-on support for teams with more complicated data requirements.
- Useful for mature marketing teams: It makes more sense when you have enough channels, data, and revenue activity to justify a dedicated analytics layer.
Cons
- Not designed as a lightweight analytics tool: Smaller teams may find the platform unnecessarily complex for basic campaign and conversion reporting.
- Implementation matters: More sophisticated attribution requires careful integration between your marketing, CRM, and revenue data.
- Higher-end pricing: HockeyStack is positioned toward companies with larger analytics requirements rather than small businesses looking for inexpensive tracking.
- More specialized than GA4: If your primary requirement is general website analytics, a simpler platform will usually be easier to manage.
Pricing
HockeyStack does not currently publish standard plan prices on its official website. Pricing is handled through a sales process and can include custom setup and support for complex data environments.
6. Ruler Analytics: Best for Lead and Call Attribution
Best for: Lead-generation businesses that need to connect marketing campaigns with forms, phone calls, opportunities, and revenue.
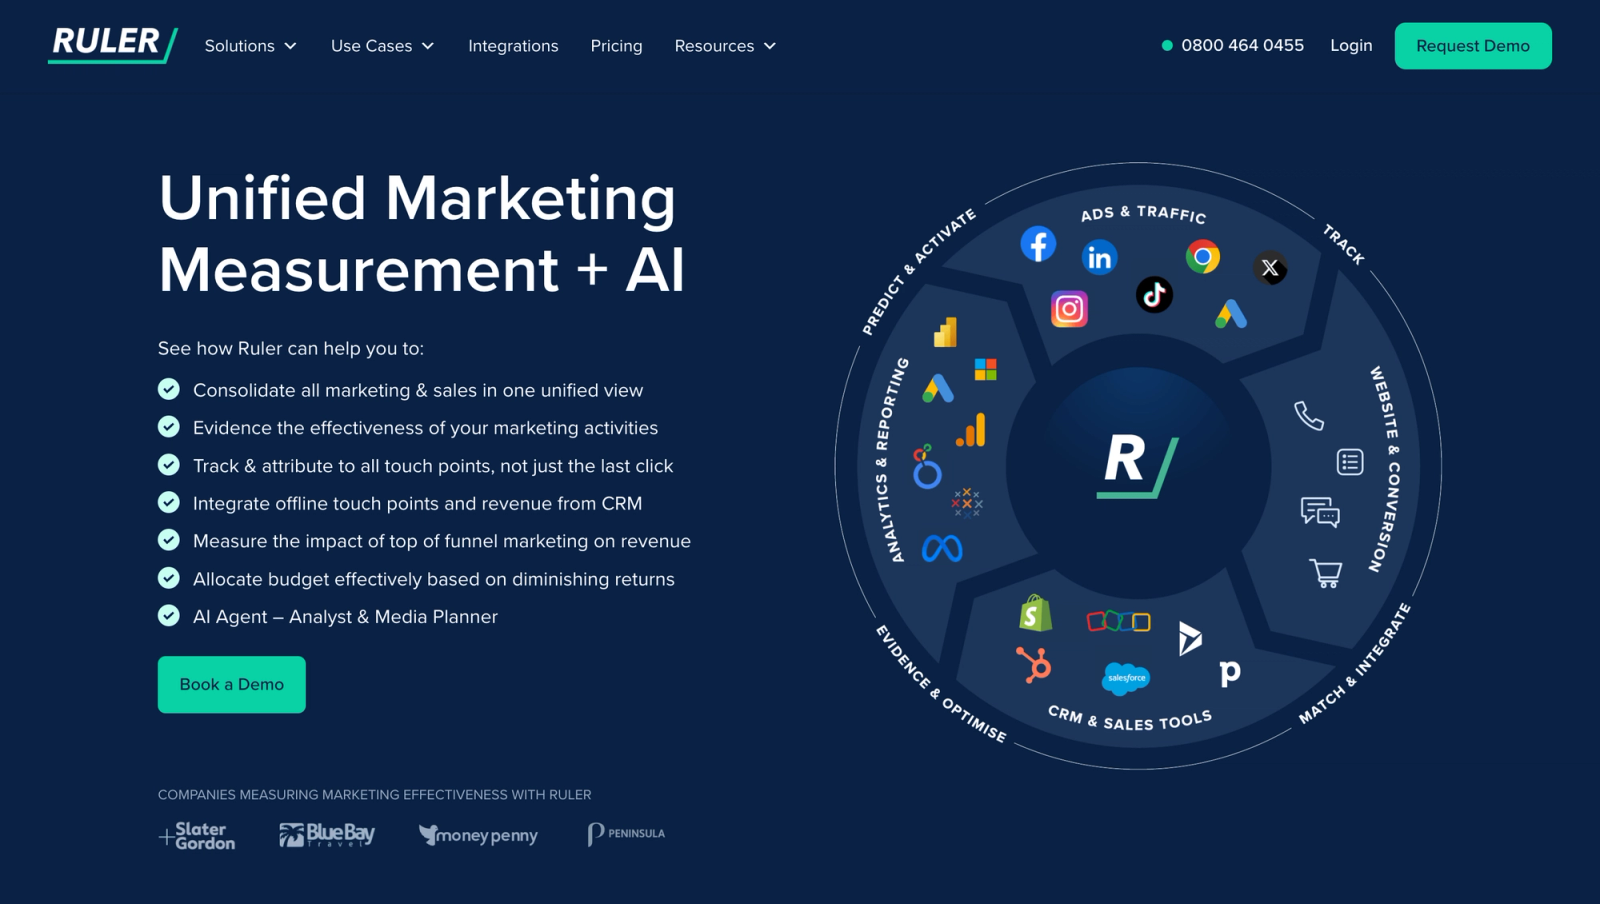
Ruler Analytics is especially useful when a conversion does not always happen online. A visitor might click an ad, fill out part of a form, call the business, speak with sales, and become a customer later. Ruler is built around connecting those steps.
Pros
- Strong lead attribution: It connects marketing activity with leads and customer journeys instead of only reporting website sessions.
- Useful for phone-driven businesses: Call tracking makes it a good option when phone calls are an important part of the conversion process.
- Multi-touch attribution: You can analyze multiple interactions rather than giving all credit to the final visit.
- Connects marketing and sales data: Ruler can bring CRM opportunity and revenue stages into the reporting layer.
- More advanced plans add deeper analysis: Higher tiers include advanced segmentation, data-driven attribution, impression attribution, and marketing mix modelling.
Cons
- Expensive for smaller businesses: The entry price is much higher than tools such as GA4 or SourceLoop.
- Pricing scales with traffic: As website traffic grows, the monthly cost can increase significantly.
- Setup requires planning: Connecting marketing sources, CRM data, calls, and revenue takes more work than basic analytics.
- More focused on acquisition: Teams looking for deep product analytics or broader behavioral analytics may need another platform alongside it.
Pricing
Ruler starts at $400/month for up to 10,000 monthly visits. Medium is $668/month, Large is $1,326/month, and Advanced starts at $2,000/month. Annual billing provides a 10% discount.
7. Matomo: Best for Privacy-Focused Analytics
Best for: Companies that want strong analytics while keeping more control over their data.
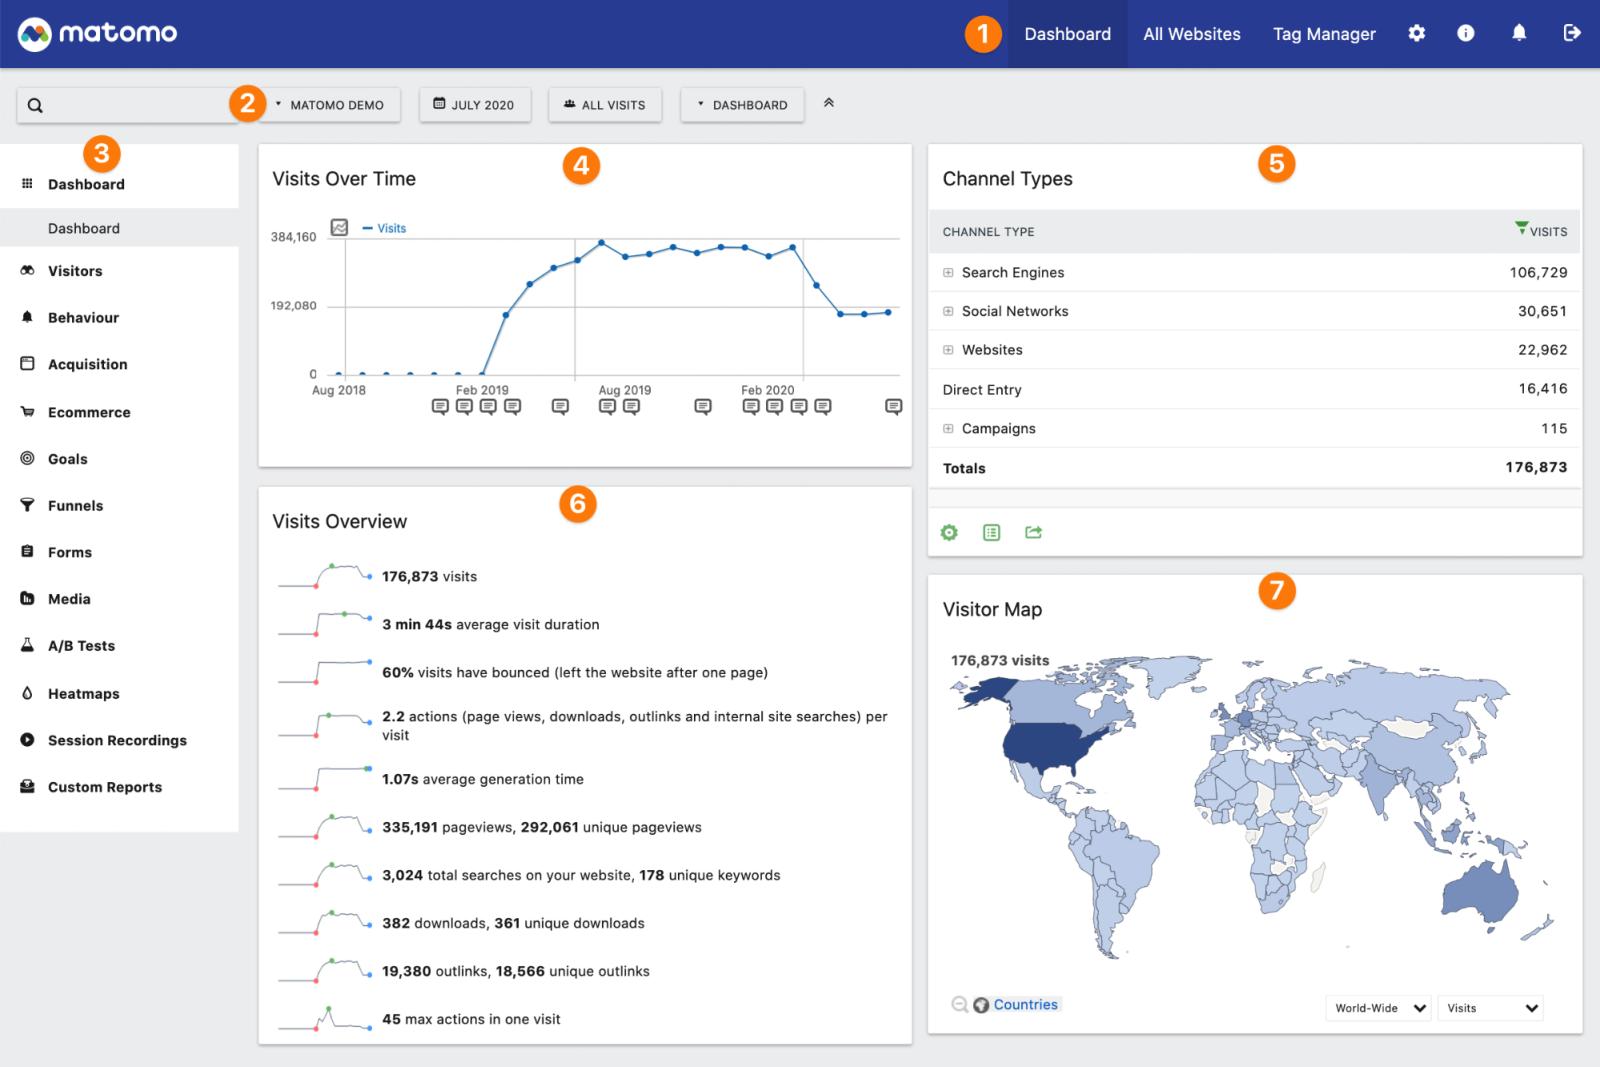
Matomo is a strong alternative to Google Analytics for organizations that care about privacy, data ownership, and self-hosting. It includes standard analytics features as well as campaign tracking, funnels, conversion tracking, and multi-channel attribution.
Pros
- Strong privacy and data ownership: Matomo allows organizations to keep control of their analytics data, including through its self-hosted option.
- Multi-channel attribution: You can compare how different marketing channels contribute to conversions rather than relying only on the final interaction.
- Multiple attribution models: Matomo supports first interaction, last interaction, linear, position-based, time decay, and other attribution approaches.
- Good campaign reporting: It can track campaigns across sources such as paid search, social media, email, and other marketing channels.
- Flexible deployment: You can use Matomo Cloud if you want managed hosting or self-host the open-source platform when data control is more important.
Cons
- Self-hosting needs technical resources: Managing your own Matomo installation means handling infrastructure, updates, security, and maintenance.
- Some attribution features are paid: Multi-channel attribution is a premium feature rather than part of the free on-premise core.
- Less connected to advertising ecosystems: Compared with Google's ecosystem, some advertising workflows require more configuration.
- Can feel heavier than basic analytics: Businesses that only need page views and simple conversion reports may not need all of Matomo's capabilities.
Pricing
Matomo's core on-premise product is available as a free open-source platform. Matomo Cloud is priced based on traffic, while premium on-premise features are available separately.
8. Adobe Analytics: Best for Enterprise Cross-Channel Analytics
Best for: Large companies that need to combine web, mobile, offline, CRM, and other customer data.
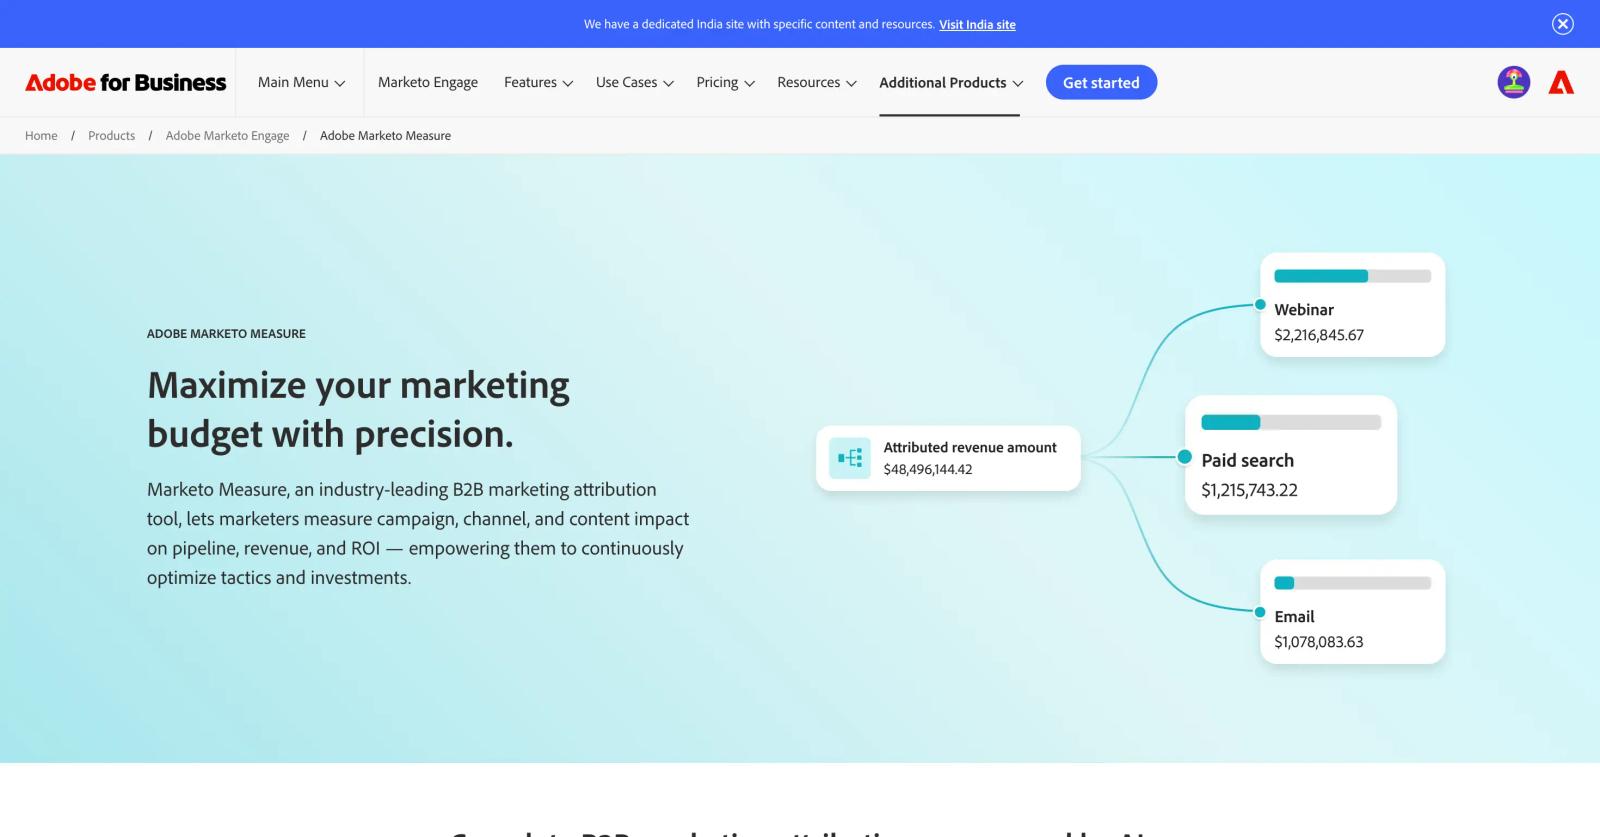
Adobe Analytics is designed for organizations with complex data environments. Its Customer Journey Analytics product can bring online and offline datasets into the same analysis environment and connect them using common customer identifiers.
Pros
- Handles many data sources: Customer Journey Analytics can combine web, mobile, offline, call center, and other customer data into a single analysis environment.
- Strong identity stitching: Common customer IDs can be used to connect activity across different datasets, devices, and channels.
- Deep analysis capabilities: Teams can build segmentation, attribution, flow, fallout, cohort, and other advanced analyses from the same customer data.
- Built for enterprise data: Adobe is a better fit when analytics needs to span multiple business systems and large datasets.
- Strong journey analysis: Its journey tools can analyze touchpoints across channels and devices rather than treating each interaction separately.
Cons
- Complex implementation: Getting useful cross-channel reporting requires properly structured datasets and consistent customer identifiers.
- Higher technical requirements: Adobe is better suited to organizations with analytics, data, and engineering resources than small marketing teams.
- Enterprise pricing: There is no simple low-cost plan for smaller companies.
- Can take time to manage: Building a reliable Adobe analytics setup requires more planning than installing a standard web analytics tool.
Pricing
Adobe uses custom enterprise pricing for Adobe Analytics and Customer Journey Analytics. Adobe provides pricing guidance based on the specific product, data requirements, and deployment rather than publishing a simple monthly plan.
Frequently asked questions
-
FAQs
-
What is cross-channel analytics?
Cross-channel analytics combines data from multiple marketing and customer channels so you can understand how they work together.
-
What is the best cross-channel analytics tool?
It depends on the use case. GA4 is a strong free option, while SourceLoop, Dreamdata, and HockeyStack are better suited to B2B attribution and revenue analytics.
-
Can Google Analytics track multiple channels?
Yes. GA4 can report traffic and conversion performance across paid and organic channels and break performance down by source, medium, campaign, and channel. (Google Analytics Help )
-
What is the difference between cross-channel analytics and attribution?
Cross-channel analytics compares activity and performance across channels. Attribution assigns credit to one or more interactions in the customer journey.
-
Can cross-channel analytics track revenue?
Yes, but the depth varies by tool. Ecommerce platforms can track online revenue, while dedicated attribution platforms can connect marketing activity with CRM deals, pipeline, subscriptions, and closed-won revenue.
-
Can SourceLoop track cross-channel attribution?
Yes. SourceLoop connects advertising platforms, website conversions, CRM data, and revenue to show how different marketing channels contribute to business outcomes.
-
Why do Google Ads, Meta, GA4, and my CRM show different numbers?
Each platform can use different attribution models, conversion windows, identity rules, and tracking methods. Privacy restrictions and missing tracking signals can also create differences.
-
Is multi-touch attribution always accurate?
No. Attribution depends on the quality of the underlying data and the model being used. Missing UTMs, cross-device behavior, privacy restrictions, offline interactions, and long sales cycles can all create gaps.
-
Do I need a dedicated cross-channel analytics tool?
Not always. GA4 may be enough for basic website and campaign analytics. If you need to connect marketing channels with leads, CRM stages, pipeline, customers, and revenue, a dedicated attribution platform can provide much deeper reporting.


 Paid Social


