
Advertising Effectiveness Measurement Guide
Master advertising effectiveness measurement with causal testing, multi-touch attribution, and SourceLoop to prove true ROI and optimize ad spend.

The most popular advice in digital marketing is also the most dangerous: open the platform dashboard, compare ROAS, and move budget toward the winner. That approach treats an observed conversion as proof that advertising caused the sale. It doesn't.
Advertising effectiveness measurement has to answer a harder question: what would have happened if the audience hadn't received the ad? Platform reports, last-click dashboards, and multi-touch models can describe customer journeys or predict likely outcomes. Only a properly designed experiment can estimate incremental lift, the additional outcome created by exposure.
That distinction changes how teams tag campaigns, interpret conflicting reports, and defend budget decisions. Attribution remains useful, but as a diagnostic layer. Causal measurement should determine whether a channel created demand, captured demand that already existed, or produced little measurable business impact.
Table of Contents
- The Illusion of Platform-Reported Conversions
- Tracing the Shift from Exposure to Causal Lift
- Comparing Core Measurement Methodologies
- Building a Resilient Tagging and Data Foundation
- Navigating Privacy Controls and Signal Loss
- Reconciling Conflicting Data for Budget Decisions
- Operationalizing a Causal Measurement Culture
The Illusion of Platform-Reported Conversions
A platform-reported conversion is an event recorded after an ad interaction or exposure. It isn't automatically a sale caused by that ad.
Someone may already be searching for your brand, planning to buy, returning through a retargeting audience, or responding to another channel. If an ad appears shortly before the purchase, an attribution system may assign credit to it because the system can observe the sequence. It usually can't observe the counterfactual, the purchase that would have occurred without the ad.
Attribution describes association
Last-click attribution answers a useful operational question: which tracked touchpoint appeared before the conversion? Multi-touch attribution goes further by distributing credit across a recorded journey. Both can help identify broken landing pages, weak creative, expensive keywords, or channels that introduce qualified visitors.
Neither method, by itself, establishes causation.
Platform dashboards also have a structural incentive to report value. Each advertising platform evaluates activity through its own tracking rules, conversion windows, identity graph, and modeled data. When several platforms claim the same customer, adding their reported conversions can create an inflated view of total demand.
Practical rule: Treat platform conversions as reported outcomes, not as proof of incremental revenue.
The problem becomes more severe with branded search and retargeting. These tactics often reach people who have already shown intent. Their reported ROAS may look efficient because the campaigns intercept demand near the point of purchase, while prospecting activity that created awareness receives less visible credit.
Make incrementality the budget KPI
Incrementality measures the difference between outcomes for an advertising-exposed group and a comparable group that wasn't exposed. A randomized holdout, matched-market test, geo experiment, or synthetic control can estimate that difference.
For budget shifts, prioritize:
- Incremental conversions: Additional conversions associated with exposure beyond the counterfactual.
- Incremental revenue: Additional revenue attributable to the advertising treatment.
- Incremental ROAS: Incremental revenue divided by the relevant media investment.
- Uncertainty: Confidence intervals or another clear expression of statistical uncertainty.
Keep attributed conversions for path analysis and campaign diagnostics. Don't use them alone to decide whether to scale, cut, or reallocate spend when organic demand, retargeting, cross-device exposure, or channel overlap is material. The goal isn't to discard useful data. It's to stop confusing captured demand with created demand.
Tracing the Shift from Exposure to Causal Lift
Advertising measurement has moved through distinct stages. In the 1950s, television evaluation largely relied on audience exposure collected through interviews, diaries, and early electronic meters. During the 1970s, continuous brand tracking expanded the conversation to awareness, consideration, and attitudes. Marketing-mix modeling became common in the 1980s and 1990s, linking aggregate advertising investment with sales over time. The American Marketing Association traces this evolution toward causal effectiveness measurement.
Modern studies increasingly compare randomized exposed and control groups. That shift matters because exposure is an input, while incremental sales or qualified pipeline are business outcomes. A person can see an ad and convert, but the conversion may reflect baseline demand rather than advertising impact.
The evidence against exposure equals impact
A 2019 study of 15 Facebook advertising campaigns found statistically significant sales lift in only 8 campaigns, roughly 53%. The result doesn't mean the other campaigns produced no value of any kind. It does show that measurable exposure and platform-recorded activity don't guarantee measurable incremental revenue. The study and related review also describe randomized field experiments, including “ghost ads,” as an important way to test advertising effects. Read the AMA's discussion of the study and the history of advertising effectiveness.
The practical lesson is uncomfortable for teams accustomed to abundant dashboards. A campaign can deliver impressions, clicks, and attributed conversions while failing to move sales beyond what would have happened naturally. Conversely, a campaign that produces few immediate clicks may influence later demand that event-level attribution doesn't capture cleanly.
Why the distinction changes optimization
Attribution is observational. It records what happened among people who received identifiable touchpoints. An experiment introduces a control condition and estimates the difference between treatment and counterfactual outcomes.
That difference should guide decisions about causality. Attribution can still explain why a campaign performed as it did, but lift testing tells you whether the campaign earned the right to receive more budget. For practical background on why attributed revenue misleads, look for frameworks that separate reported credit from additional business impact.
Comparing Core Measurement Methodologies
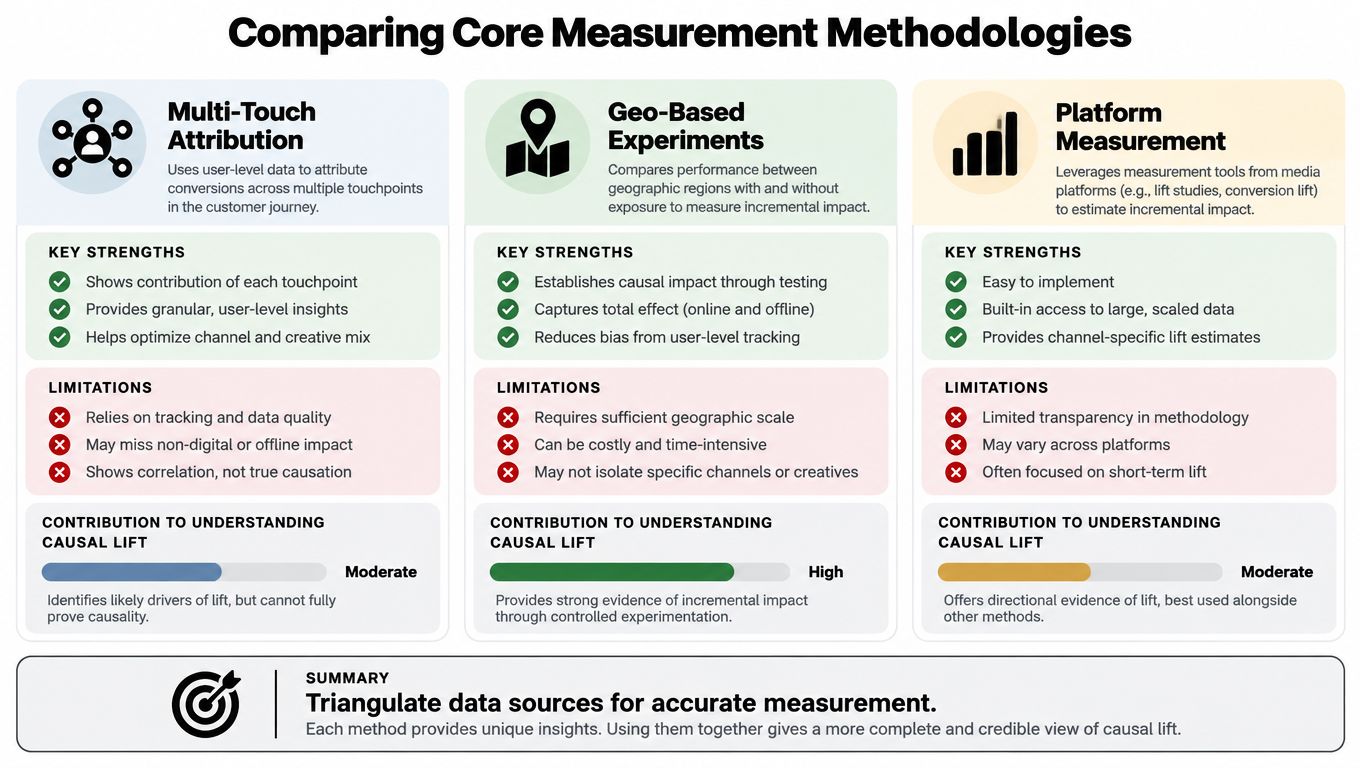
No measurement method sees the entire system. The strongest programs use each method for the question it can answer, then compare the outputs instead of forcing one model to carry every decision.
Multi-touch attribution
MTA maps individual journeys across touchpoints and assigns fractional or model-based credit. It works well for tactical questions such as which creative appears in qualified journeys, whether a campaign assists conversion, and where a visitor drops out of the funnel.
Its weakness is identity and selection bias. Cross-device activity, consent loss, walled gardens, offline conversions, and incomplete exposure records can distort the journey. An advanced model may predict which users are likely to convert without proving that advertising caused the conversion.
Use MTA to diagnose paths and prioritize operational tests. Don't use it as the sole causal authority for budget allocation.
Media-mix modeling
MMM works at an aggregate level. It relates media investment and other business variables to sales or revenue over time, making it useful for broad budget planning across online, offline, seasonal, and geographic activity.
MMM can account for channels that don't expose user-level data, but it trades granularity for coverage. It isn't the right tool for minute-by-minute campaign optimization, and its results require external validation before you treat them as causal. A model can fit historical data convincingly while remaining sensitive to assumptions about seasonality, pricing, distribution, and demand.
Lift testing
Incrementality testing creates the clearest causal question. Randomized holdouts, geo experiments, matched markets, and synthetic controls compare outcomes with advertising against an estimate of outcomes without it.
The trade-off is operational. Tests need a suitable eligible population, uncontaminated treatment and control units, a pre-specified outcome, and a measurement window long enough to capture the relevant response. Small or poorly designed tests can produce inconclusive results, especially when audiences overlap across channels.
| Method | Strongest use | Main limitation | Decision role |
|---|---|---|---|
| MTA | Journey diagnostics and tactical optimization | Incomplete identity and causal ambiguity | Explain performance |
| MMM | Aggregate, cross-channel budget planning | Low granularity and dependence on assumptions | Plan investment |
| Lift testing | Estimating incremental outcomes | Requires experimental design and clean controls | Defend budget shifts |
| Platform analytics | Fast in-platform monitoring | Single-platform reporting bias | Tune live delivery |
A resilient data layer improves all three methods. This comparison of multi-touch attribution and marketing-mix modeling is useful when deciding which questions belong in each framework.
The strategic principle is simple: triangulate, don't average blindly. If MTA says a channel contributes to many conversions, MMM says the relationship is weak, and a holdout finds no lift, the disagreement is a signal to investigate identity coverage, overlap, demand capture, and test power.
Building a Resilient Tagging and Data Foundation
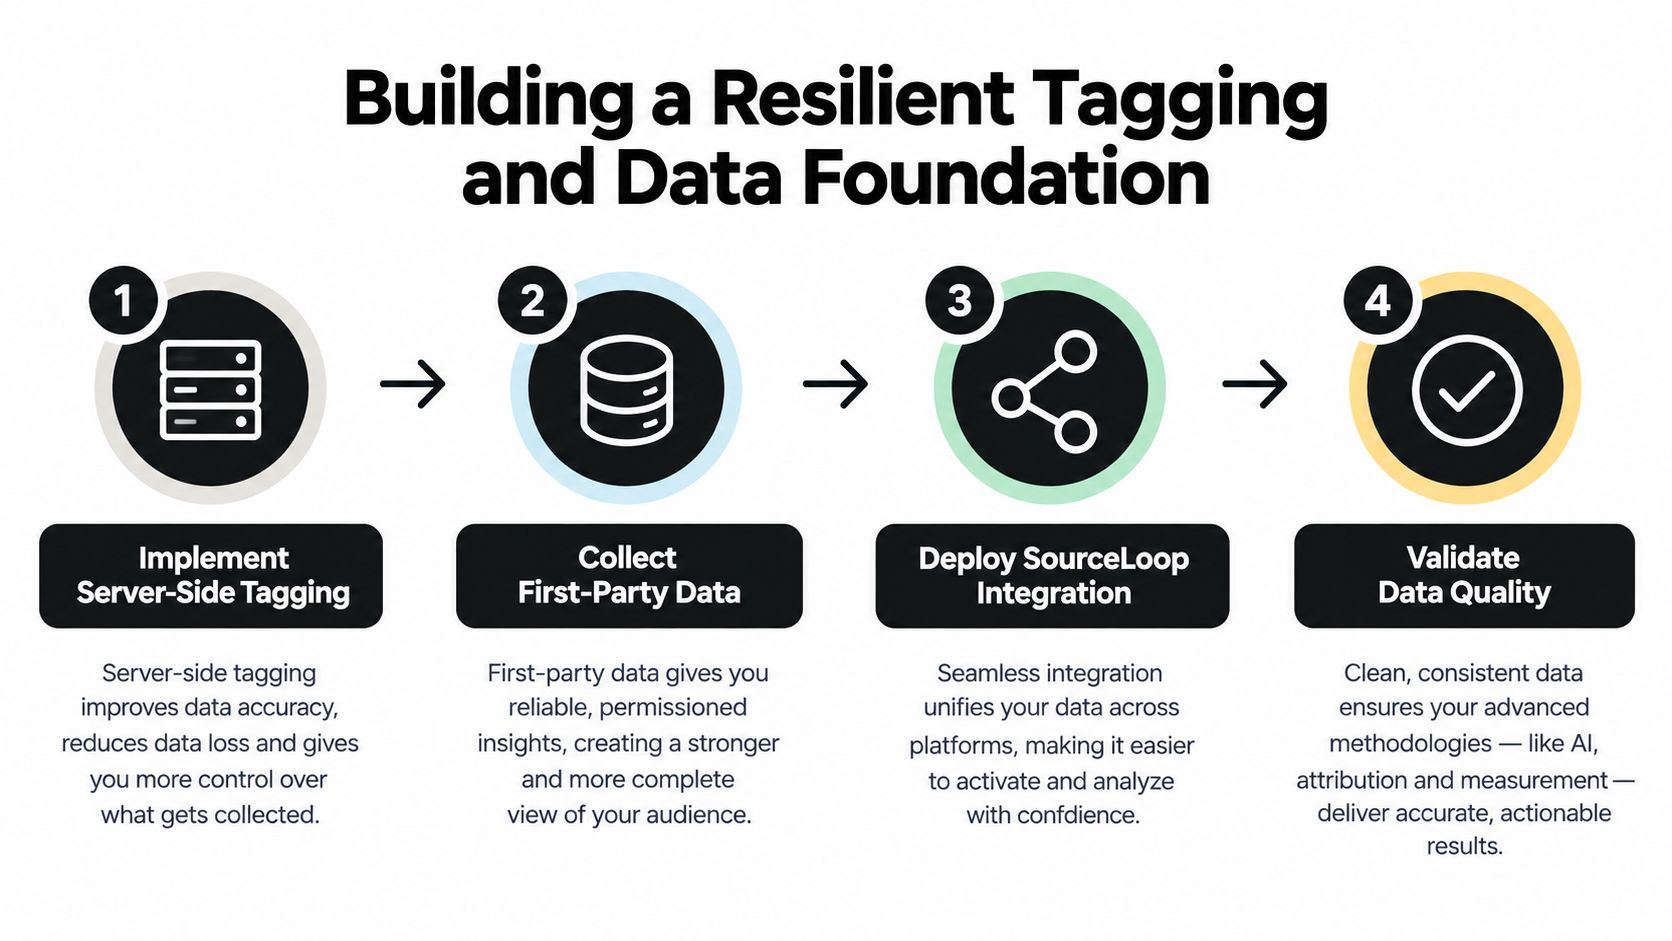
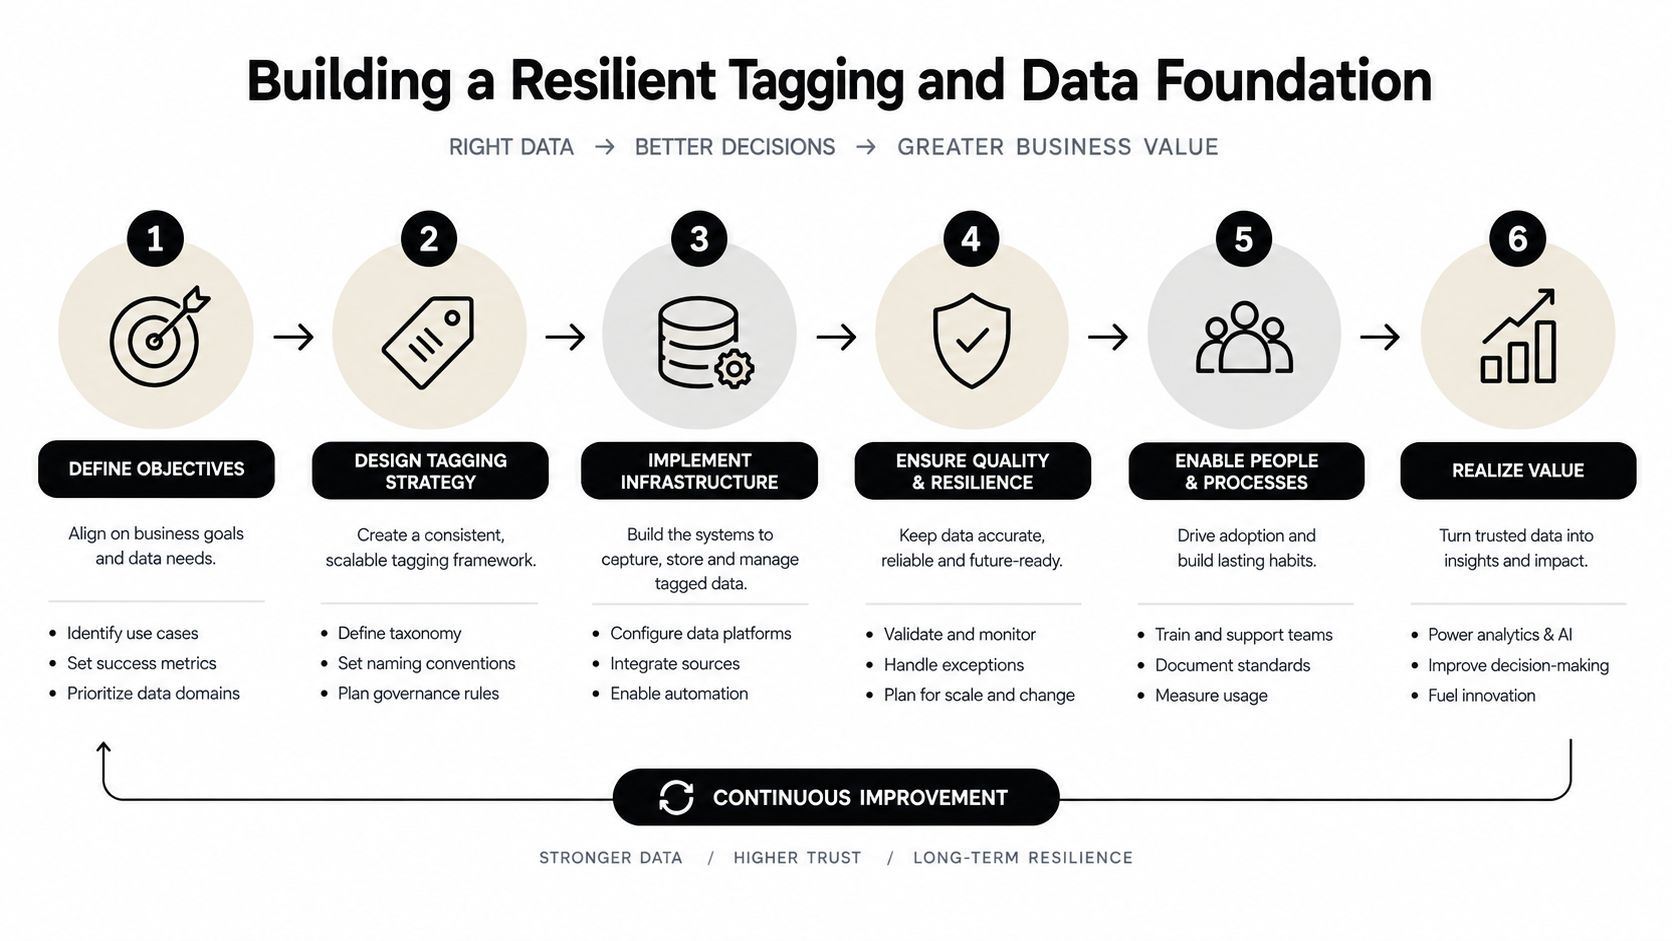
Causal measurement can't rescue unreliable inputs. Before launching a holdout or comparing attribution models, establish exactly how visits, campaign parameters, conversions, pipeline stages, and revenue enter the system.
Capture the journey at the first visit
Preserve UTM parameters and click identifiers when a visitor arrives. Store them with the first-party contact record, then retain subsequent campaign touches rather than overwriting the original source. Apply a consistent naming convention for source, medium, campaign, audience, creative, and placement.
A useful implementation maps:
- Entry data: Landing page, timestamp, referrer, UTM values, and platform click identifiers.
- Engagement data: Forms, chat interactions, booked meetings, product events, and meaningful qualification actions.
- Commercial data: CRM stage changes, closed-won status, transaction value, refunds, and recurring revenue where relevant.
- Experiment data: Treatment assignment, holdout status, geography, eligibility, exposure status, and test dates.
If a form fill is the only event sent back to Google Ads or Meta, the algorithm may optimize for cheap submissions rather than qualified customers. Feed back the later business outcome through server-side conversion APIs or offline event uploads, subject to consent and platform requirements.
Join online activity to offline value
For a sales-led business, the important conversion may happen after the website session. Connect the original journey to a CRM record, then connect the CRM record to revenue. For ecommerce, reconcile browser or server events with the order system, including cancellations and refunds.
SourceLoop is one option for this workflow. It captures multi-touch visits and conversion events, connects journeys to CRM and Stripe revenue, and can sync qualified offline conversions to platforms such as Google Ads, Meta, and LinkedIn. Review conversion API tracking tools before selecting an implementation.
Validate before trusting the dashboard
Run routine checks for duplicate events, missing campaign parameters, inconsistent time zones, broken redirects, unattributed sessions, and mismatches between platform conversions and the source of truth. Reconcile spend from each platform against invoices or billing exports. Check whether CRM revenue appears once, in the correct period, and under the intended conversion definition.
Data-quality test: If your finance team can't reproduce the revenue total used in the advertising report, the report isn't ready to support a budget decision.
Tagging hygiene also protects experiments. Treatment and holdout assignments need durable identifiers, and exposure logs must distinguish eligibility from actual delivery. Without that separation, a “control” group may contain exposed users or a treatment group may never receive the campaign.
Navigating Privacy Controls and Signal Loss
Privacy-preserving measurement does not remove data evenly. It can reduce match rates, weaken linkability, shorten attribution windows, suppress small segments through aggregation thresholds, add reporting noise, and affect audiences differently across devices, markets, and channels.
That creates a subtle reporting risk. A campaign may appear to lose efficiency because its measurable signal deteriorated faster than a competing channel's signal. A lower tracked ROAS can reflect weaker observability rather than lower incremental impact.
Separate performance from visibility
Track the measurement system as carefully as the media system. Monitor match rates, consent coverage, modeled versus consented populations, event latency, deduplication status, and the share of conversions linked to a stable first-party record.
Don't collapse those indicators into one blended score. Report observed revenue separately from modeled or estimated revenue, and attach uncertainty ranges when identity coverage or aggregation changes. Comparisons across periods should flag changes in tracking conditions before anyone interprets a movement as a demand shift.
A 2025 global marketing-data report found that 66% of marketers worried about cross-channel user tracking, while 57% expected targeted advertising to become less effective and 57% anticipated greater difficulty with attribution and measurement. The technical study discussing privacy-related measurement distortion places those concerns in the context of match-rate loss, linkability loss, shorter windows, suppression, and randomized noise.
Use controlled outcomes as the anchor
When signal quality changes, market-level outcomes and controlled tests become more valuable. A geo experiment doesn't depend on recovering every individual browser journey, although it still requires careful control over audience spillover, delivery, seasonality, and other concurrent changes.
First-party data helps connect consented interactions to CRM and revenue, but it doesn't make missing identifiers disappear. Offline conversion uploads can improve optimization, yet teams should document which records are deterministic, which are modeled, and which remain unobservable.
For teams evaluating cookieless approaches, this guide to cookieless tracking solutions can help frame the implementation choices. The measurement standard should remain consistent: disclose what the system can see, what it estimates, and what has been validated independently.
Reconciling Conflicting Data for Budget Decisions
Conflicting results are normal. A multi-touch model may recommend scaling a campaign because it appears throughout high-value journeys, while a geo experiment may show no measurable incremental lift. The answer isn't to select the report that supports the preferred budget.
Start by classifying the disagreement.
| Signal | What it can tell you | What it can't prove |
|---|---|---|
| Platform conversions | Recorded or modeled outcomes under platform rules | That the ad caused the outcome |
| MTA contribution | Position and association within observed journeys | That credited conversions were incremental |
| MMM contribution | Relationship between aggregate investment and outcomes | That the relationship is free from confounding |
| Lift result | Difference between treatment and counterfactual outcomes | That an underpowered or contaminated test is conclusive |
Investigate the test before overruling it
When attribution is positive and lift is flat, audit the experiment first. Confirm that the eligible population was defined before launch, treatment and holdout units were assigned correctly, and the primary outcome and window were pre-specified. Then check for contamination from overlapping campaigns, brand spillovers, uneven delivery, audience leakage, and major changes in price, availability, sales coverage, or tracking.
A null result isn't automatically proof of zero effect. It may indicate insufficient signal, poor randomization, contamination, or a small effect. Report the estimate with its confidence interval and explain which interpretation the design supports.
Use experiments to calibrate prediction
The most practical approach for lean teams is not to run a full randomized test on every campaign. Sample experiments across objectives, audiences, geographies, and spend levels, then use the results to calibrate a predictive model. Keep event-level data as explanatory features, but don't let prediction become causation without evidence.
A recent NBER study used 2,226 Meta ad experiments. Its Predicted Incrementality by Experimentation method achieved an out-of-sample R² of 0.88 for incremental conversions per dollar, compared with 0.19 for industry-standard seven-day last-click attribution. Read the NBER paper on predicted incrementality by experimentation.
The implication is operational: use experimentally measured lift to teach a scalable model where lift tends to occur, but don't extrapolate beyond the conditions represented in the calibration data. For a practical perspective on scaling campaigns with real performance data, focus on how reported platform performance is reconciled with broader cross-channel evidence.
Make the decision explicit
For quarterly planning, document the action rule before reviewing the result:
- Positive lift with reliable data: Consider increasing investment, then monitor marginal performance rather than assuming unlimited scale.
- Positive attribution with inconclusive lift: Hold the budget steady, improve the test, and gather another causal read.
- Positive attribution with a credible null lift: Reduce or redesign the campaign unless it serves a separate validated brand objective.
- Negative lift: Investigate creative, frequency, targeting, and spillovers before scaling down blindly, then protect against continued waste.
This process keeps prediction useful without allowing it to overrule causal evidence casually.
Operationalizing a Causal Measurement Culture
Causal measurement becomes useful when marketing, sales, finance, and analytics use the same definitions. Agree on what counts as an eligible conversion, qualified pipeline, revenue, treatment exposure, holdout status, and an acceptable uncertainty range.
Keep three outputs separate:
- Descriptive contribution: Which touchpoints appeared in the journey?
- Predictive likelihood: Which campaigns resemble journeys that often convert?
- Incremental lift: Which outcomes occurred because advertising changed behavior?
Use attribution for the first two. Use experiments and validated causal models for the third.
Set a recurring calibration cycle. Review test results, compare them with platform and MTA outputs, record where the models diverged, and update assumptions only when the evidence supports it. Configure Slack, email, or webhook alerts for major changes in spend, conversion quality, revenue, match rate, or experiment integrity, but send people to investigate rather than automating budget shifts from a single noisy metric.
Operating principle: A dashboard should start the budget conversation, not end it.
Lean teams don't need an elaborate measurement department. They need clean event definitions, durable first-party records, disciplined holdouts, transparent uncertainty, and the willingness to reject attractive attribution when causal evidence disagrees. That combination turns advertising effectiveness measurement from a reporting exercise into a defensible growth system.
Audit your current advertising reports this week. List every conversion definition, identify which metrics are merely attributed, check whether offline revenue reaches your optimization platforms, and select one channel or market for a properly designed holdout. Then use the result to set your next budget decision around incremental revenue, not the ROAS figure that a platform awards itself.




 Paid Social


