
Multi Touch Attribution Reporting That Actually Works
Build multi touch attribution reporting you can defend in budget meetings. Step-by-step setup, models, dashboards, and CRM and ads sync that hold up.

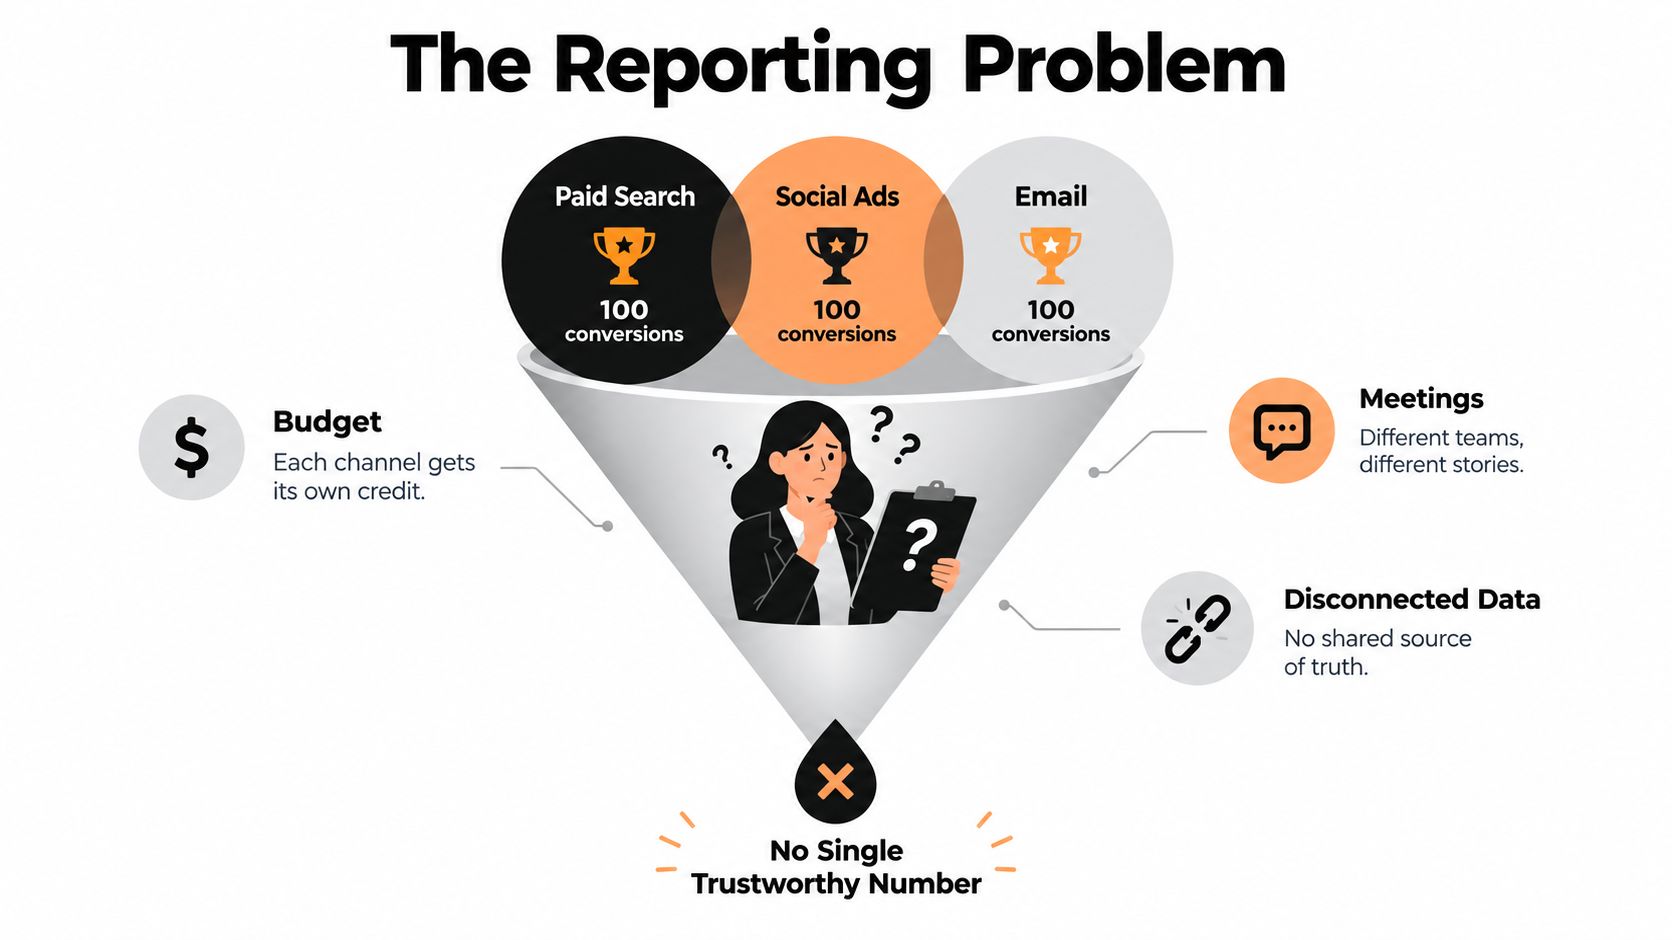
Friday's budget review is close, and the dashboards don't agree. Google Ads claims conversions, Meta claims some of the same customers, and your CRM shows a different set of closed deals. Someone asks which channel deserves more spend. The honest answer is that your reports are counting different things, using different rules, and missing parts of the customer journey.
Multi touch attribution reporting can give the team a shared view of how recorded interactions relate to conversions. But it won't turn incomplete tracking into ground truth, and a model's credit allocation isn't proof that a channel caused a sale. The reporting layer needs to show both the journey and the limits of the data behind it.
Table of Contents
- The Reporting Problem That Multi Touch Attribution Is Built to Solve
- What Multi Touch Attribution Reporting Actually Measures
- Setting Up the Data Foundations Your Reports Depend On
- Comparing the Models You Will See in Any Reporting Tool
- Building Dashboards and Funnels That Drive Decisions
- Wiring CRM Sync and Ad Platform Conversions Into the Loop
- Knowing When Multi Touch Attribution Reporting Is the Wrong Tool
The Reporting Problem That Multi Touch Attribution Is Built to Solve
The problem in that meeting isn't that every platform is necessarily wrong. It's that each platform reports from its own perspective, while the CRM records the business outcome. Add different channel definitions, overlapping claims, and untracked visits, and a team can't add platform totals together and call the result revenue attribution.
Traditional last-click attribution assigns all conversion credit to the final interaction. Multi-touch attribution instead distributes credit across several interactions in the customer journey. That changes the question from “Who got the last click?” to “Which recorded channels introduced, assisted, and closed the path?” The distinction matters when someone discovers your company through search, returns through email, and later converts after a direct visit.
This isn't a new problem created by vendors selling more complex models. A systematic review identified 345 initial publications from 2011–2024, then narrowed them to 62 original empirical studies, comprising 29 conference papers and 33 journal articles. The research reflects a shift from fixed rules, such as first-touch, last-touch, linear, time-decay, and position-based models, toward data-driven methods that estimate touchpoint contributions (systematic review of attribution research).
Give the team one reporting layer
A useful reporting layer doesn't erase platform reports. It puts them beside a consistent view of recorded customer paths, shared conversion definitions, and CRM outcomes. That lets a team distinguish a channel that often closes a conversion from one that appears earlier and assists it.
For a practical overview of the underlying approach, Grou's multi touch attribution guide offers useful context on distributing credit across customer interactions. The operational recommendation is simple: keep platform self-reporting for channel-level execution, but don't let it be the only lens in a budget meeting.
Meeting rule: If the team can't explain which conversions are observed, which are modeled, and which touchpoints are missing, don't use the dashboard to justify a budget shift.
What Multi Touch Attribution Reporting Actually Measures
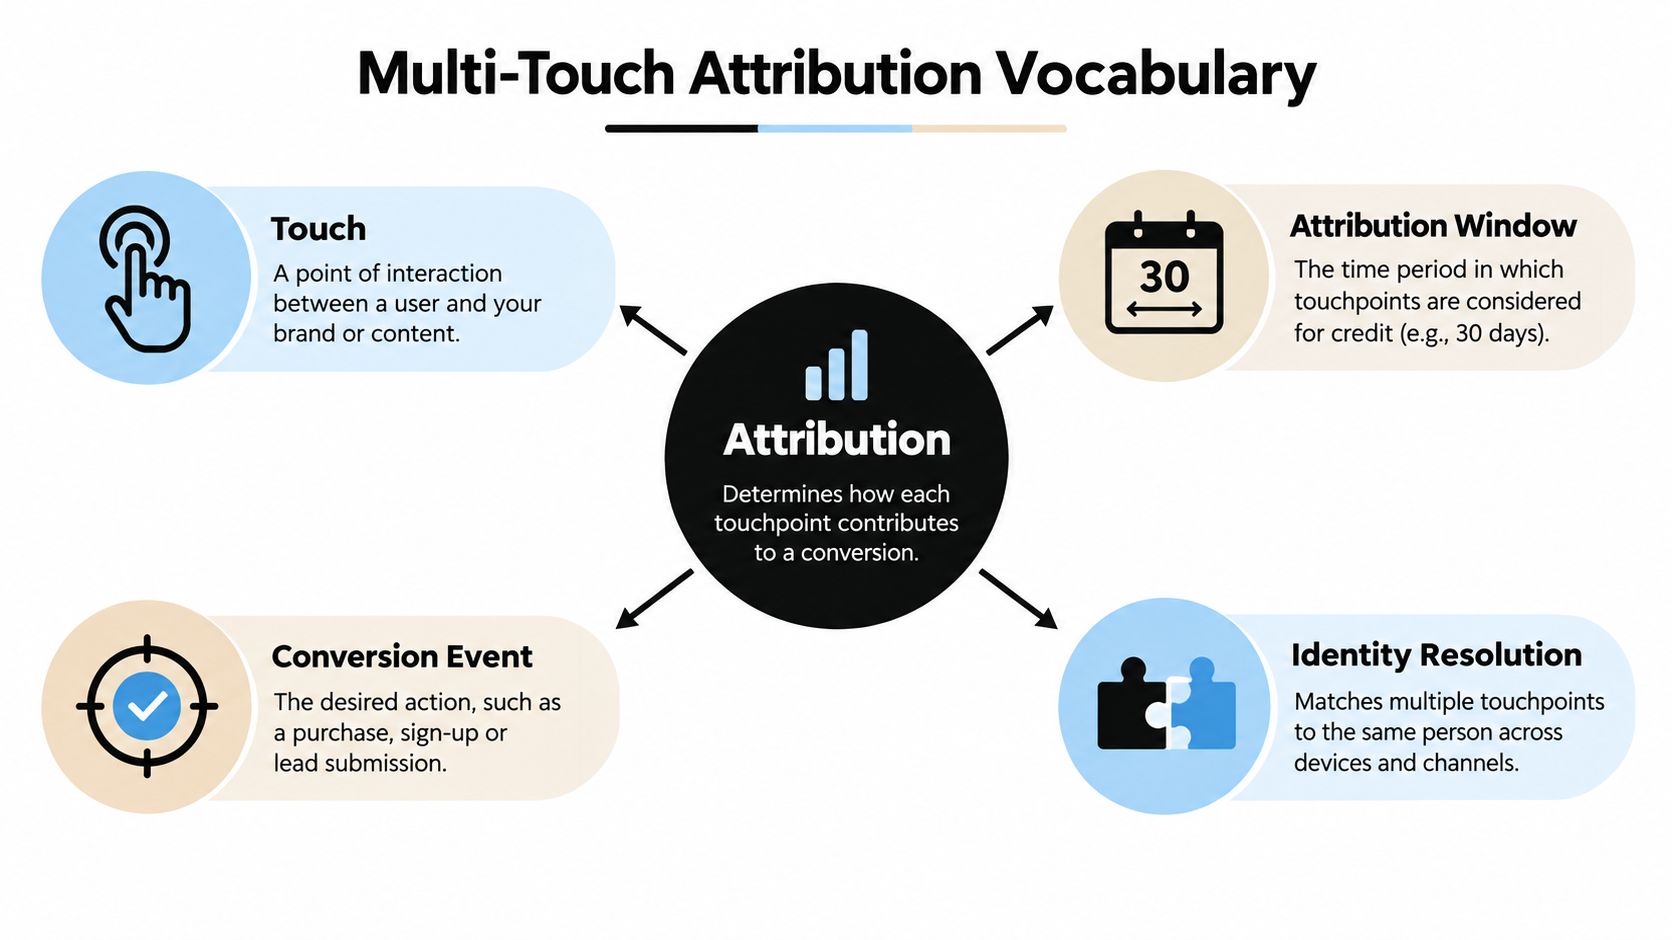
An attribution report is only as clear as the objects it measures. Start by separating four terms that teams often blur together: touch, conversion event, attribution window, and identity resolution.
A touch is a recorded interaction that the team has chosen to consider, such as a paid search click, email visit, referral, or social campaign visit. A conversion event is the outcome being measured, for example a qualified lead, signup, booking, or purchase. The attribution window sets the period in which earlier interactions can be included in that conversion's path. Identity resolution determines whether visits and events can be reliably connected to the same person or account.
Those definitions determine what your dashboard can reliably say. A visit without a reliable identity link may not belong in a person-level journey. A conversion without an agreed event definition may mean something different in the ad platform, analytics tool, and CRM. And a window that excludes earlier interactions can make a nurture channel appear irrelevant only because its contribution falls outside the reporting rule.
Report the path, not just the channel
Google Analytics' historical Multi-Channel Funnel framework helped make path-level reporting familiar. It separated a final interaction from earlier interactions that assisted conversion, and organized paths across channels such as search, referrals, affiliates, social, and email. Its views included Assisted Conversions, Top Conversion Paths, and Time Lag, which describe channel assistance, channel sequences, and time between initial interest and conversion (Google Analytics Multi-Channel Funnel reports).
That distinction is especially useful in B2B, SaaS, and considered ecommerce journeys. A channel can introduce a prospect or help them return without receiving last-click credit. A channel-level total alone hides that sequence, while a path-level report can show whether a channel tends to appear early, late, or alongside another channel.
The vocabulary also clarifies model types. Rule-based models distribute credit according to a declared formula. Data-driven models estimate contribution from observed patterns in a dataset. Neither should be treated as a direct measure of causation. Before you compare their outputs, verify that they're measuring the same event, using the same eligible interactions, identity rules, and reporting window.
For a concise visual explanation of the concepts, use the diagram above as a reference when aligning marketing, analytics, and RevOps on shared definitions. If your team needs a spoken introduction, this video can support that discussion:
Setting Up the Data Foundations Your Reports Depend On
A model can only distribute credit across the data it receives. Before publishing a multi-touch report, settle the event definitions and identity rules that determine which recorded interactions belong together.
Define the outcome and the eligible touches
Start with the business event you want to measure. A form submission, qualified lead, opportunity, booking, and paid purchase are different outcomes. Choose the event that matches the decision at hand, and document how it maps to the CRM so that “conversion” doesn't change meaning between systems without notice.
Next, define which interactions count as eligible touches. Decide how to handle paid and organic visits, email clicks, referrals, social campaigns, sales conversations, event attendance, and other interactions your systems can record. Exclude or separately label events that don't represent marketing influence, such as internal traffic or duplicate records. If offline interactions matter but aren't captured, call that out rather than implying the digital path is complete.
The attribution window should reflect the buying journey and the question you're asking. There isn't a universal window that works across every business. Use a documented policy, compare its effect with a reasonable alternative, and avoid presenting a window-specific result as an objective ranking of channels.
| Journey type | Recommended window | Why this window works | Watch-out |
|---|---|---|---|
| Short-cycle ecommerce | Set from observed conversion paths | Keeps reporting focused on interactions relevant to purchase | A narrow window can omit earlier discovery |
| SaaS signup journey | Match the period used to evaluate signup and activation | Separates acquisition from later product engagement | Signup and paid conversion aren't interchangeable events |
| B2B lead to opportunity | Align to the CRM stage and buying question | Connects marketing activity to a defined sales outcome | Long, multi-person journeys may not resolve to one user |
| Offline-influenced sale | Use CRM-linked history where available | Includes recorded digital and offline steps in one view | Missing offline activity makes the path partial |
Audit identity before credit
Cross-domain tracking gaps, session-stitching failures, identity-resolution problems, platform integration, and inconsistent data collection can all distort MTA reports, as discussed in a comparative study of implementation challenges (comparative study of MTA implementation). If a person visits a campaign landing page on one domain and converts on another, check whether the journey remains connected. If an anonymous visitor later becomes a known CRM contact, document how that transition is handled.
Ask these questions before publishing:
- Event consistency: Does the report use the same conversion definition as the CRM?
- Journey linkage: Can you explain how visits become associated with a contact or account?
- Coverage visibility: Can the report distinguish linked journeys from unresolved ones?
- Duplicate handling: Do repeat submissions or imported records inflate conversion counts?
- Channel consistency: Are campaign names and channel labels normalized across platforms?
- Window transparency: Can a stakeholder find the window and eligibility rules beside the result?
If the team can't answer these questions, publish a data-quality warning before publishing channel rankings. That's a reporting decision, not a cosmetic tracking note.
Comparing the Models You Will See in Any Reporting Tool
Attribution models aren't neutral ways to reveal a single hidden answer. Each one applies a different rule to the path, so each can tell a different story about the same conversion.
| Model | What it credits | Useful reporting role | Main weakness |
|---|---|---|---|
| Last-touch | The final recorded interaction | Operational handoff and close-path reporting | Ignores earlier touches |
| First-touch | The first recorded interaction | Entry-point and discovery reporting | Ignores nurture and closing interactions |
| Linear | Every eligible touch evenly | Simple journey diagnostics | Treats unequal interactions as equal |
| Time-decay | More credit to later touches | Recency-focused diagnostics | Its weighting can favor channels close to conversion |
| Position-based | Emphasizes selected positions in the path | Bookend or milestone analysis | The chosen weights are a rule, not proof |
| Data-driven | Estimates contribution from observed patterns | Pattern analysis when data supports it | Can be sensitive to data gaps and assumptions |
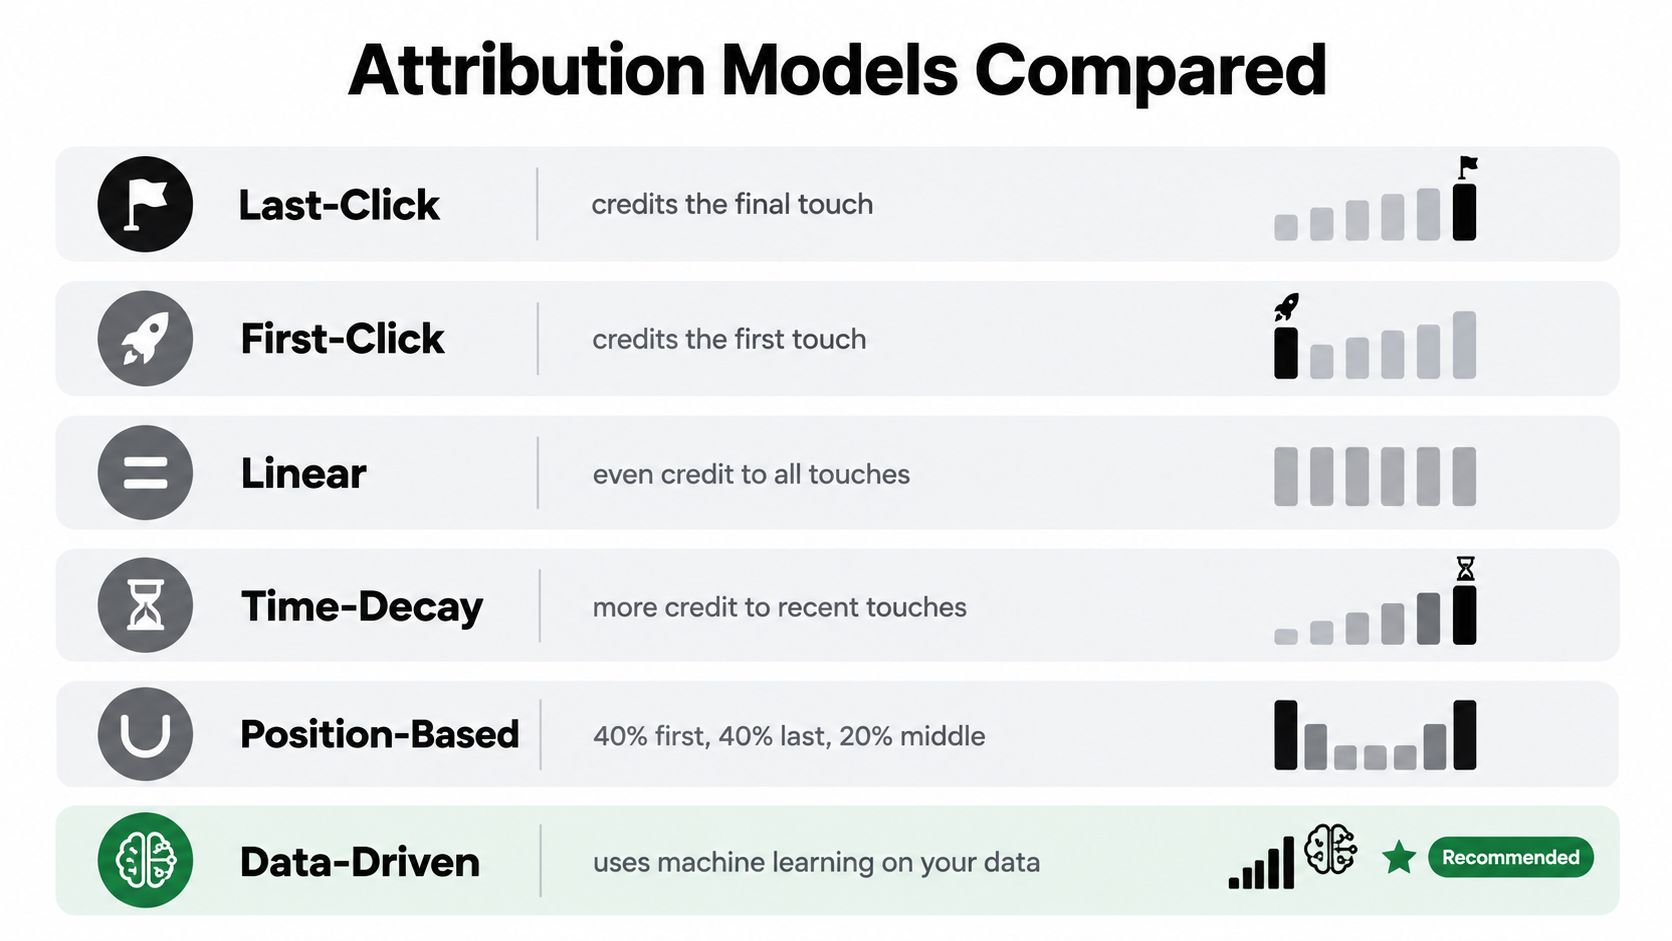
The practical warning is how much the choice can change the story. A comparative analysis reported an average 31.4% redistribution of conversion credit when rule-based multi-touch models were compared with last-click attribution (comparative analysis of attribution models). That's not a reason to declare multi-touch automatically better. It's a reason to disclose the model and avoid treating a change in credit as a change in actual business results.
Keep model outputs in their lanes
Use last-touch when the team needs an operational view of the final recorded interaction. Use a rule-based or algorithmic model to inspect journey patterns and assisting channels. Use incrementality results, not fractional attribution credit alone, to support budget decisions. Each view answers a different question, so don't collapse them into one headline number.
For readers who want a deeper comparison of common approaches, B2B attribution models explained provides additional context. SourceLoop also has an explanation of the linear attribution model, useful when teams need to understand the assumptions behind equal credit.
Stakeholder answer: “This channel gained modeled credit under this rule” is a defensible statement. “This channel caused that revenue” requires stronger evidence.
Run sensitivity checks across first-touch, last-touch, linear, time-decay, position-based, and data-driven views where available. Don't average away disagreement. If rankings move substantially when the model changes, treat that divergence as a signal to investigate identity, eligibility, timing, and causal contribution before changing spend.
Building Dashboards and Funnels That Drive Decisions
A useful attribution dashboard answers decisions, not just reporting questions. Put the views in an order that moves from channel assistance to observed paths, timing, and funnel movement.
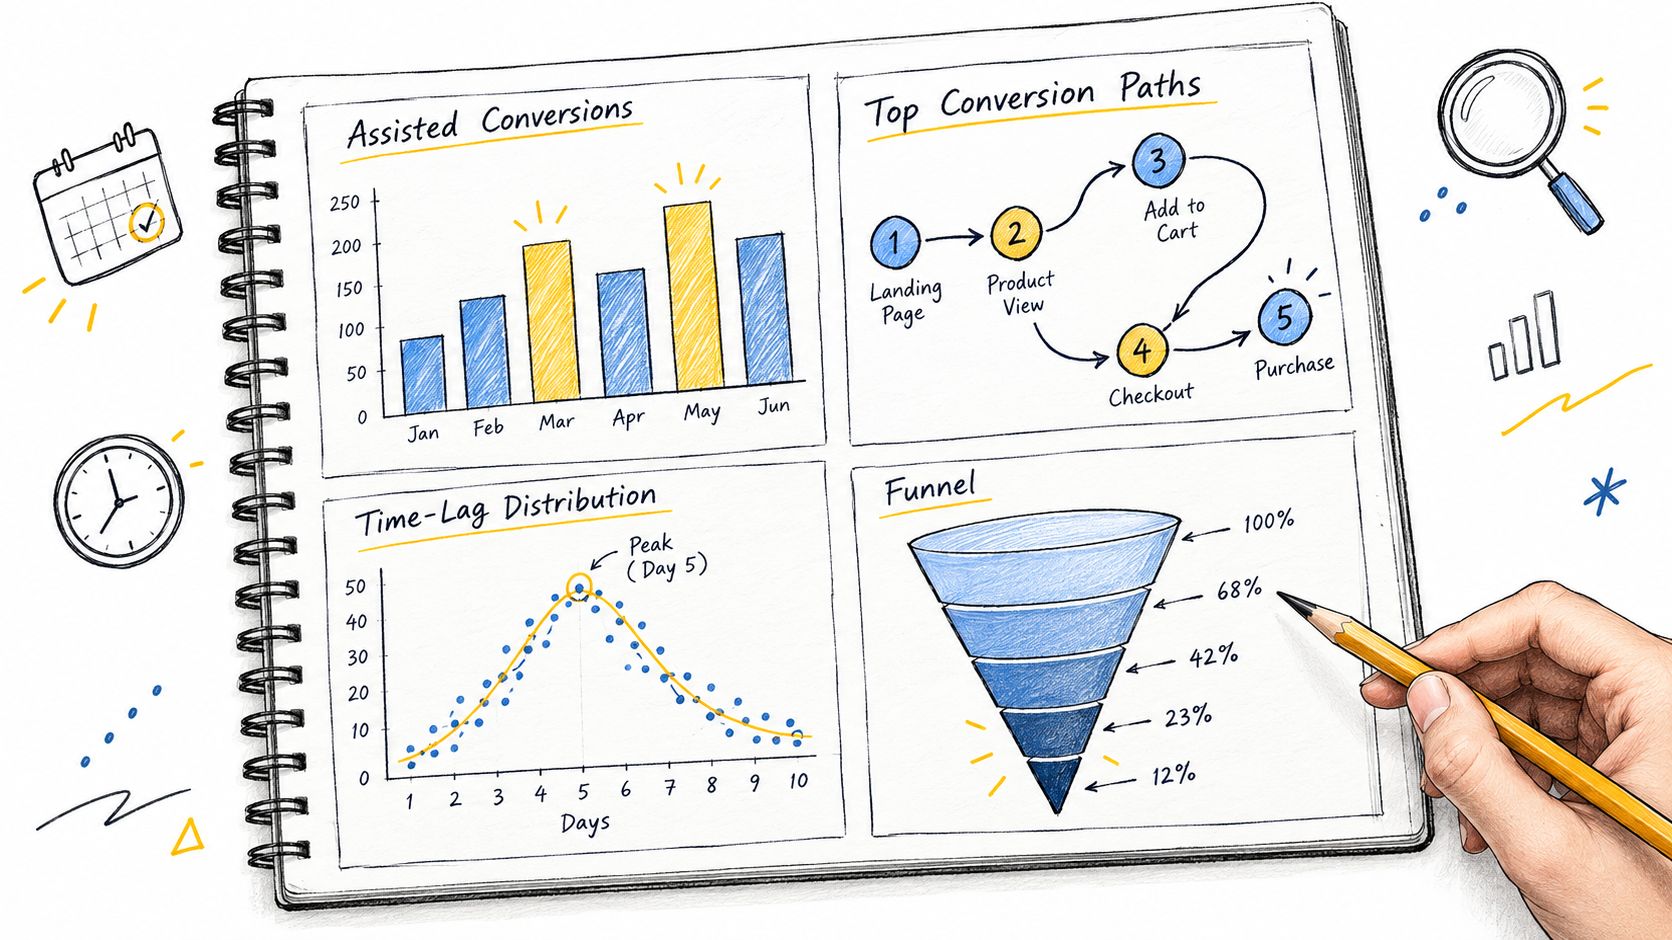
Four views belong in the working dashboard
Assisted conversions show where a channel appeared before the final interaction. Use the view to identify channels that may be doing introduction or nurture work, then compare that pattern with cost, lead quality, and CRM progress. Don't infer causal value from assistance alone.
Top conversion paths group conversions by the sequences of channels that preceded them. This can reveal whether prospects commonly return through search after an email, or whether paid social appears before a later direct visit. Use those patterns to investigate campaign coordination and landing-page continuity.
Time lag groups conversions by the elapsed time between initial recorded interest and conversion. This can help teams assess whether a nurture sequence, follow-up cadence, or evaluation path needs attention. It doesn't tell you that a particular channel caused the delay or shortened it.
Funnel drop-off shows where recorded journeys stop progressing between stages. Pair the funnel with CRM outcomes so a drop between lead and opportunity isn't mistaken for a tracking failure, or vice versa. Ask Sales whether the problem is qualification, follow-up, or missing event capture before cutting a channel.
Google's Multi-Channel Funnel reporting established the use of assisted conversions, path groupings, and time-lag views as distinct ways to examine conversion journeys (Google Analytics Multi-Channel Funnel reports). In a modern dashboard, keep those views beside conversion definitions, reporting windows, and a visible note about unresolved journeys.
A useful dashboard guide for revenue teams is 7 metrics dashboards for revenue leaders. For teams building a SourceLoop report to their specifications, the custom report help guide can support the configuration work.
Separate journey description from causal measurement
A practical attribution workflow separates descriptive credit allocation from causal measurement. The workflow defines conversion events, windows, identity rules, and eligible touchpoints; estimates conversion probability from exposures; compares predictions with and without an exposure; and allocates estimated incremental contribution across the sequence. The method can be more rigorous than assigning observed revenue directly, but the result still needs validation through randomized holdouts or geo-experiments (technical paper on incremental attribution).
Lead with conversion outcomes and the decisions they inform in the weekly review. Keep model comparisons, unresolved paths, and detailed weighting assumptions available for scrutiny, not buried where stakeholders can't find them.
Wiring CRM Sync and Ad Platform Conversions Into the Loop
A dashboard becomes more useful when marketing interactions, CRM stages, and ad-platform feedback share consistent event definitions. Treat that as a data flow, not a collection of disconnected integrations.
Begin with the CRM record. Map the identifiers and fields that connect visits to contacts, and define how lead, qualified lead, opportunity, and closed-won stages are represented. In HubSpot, Salesforce, or Pipedrive, the stage mapping should reflect actual sales operations. If the CRM says “qualified” while the ad platform receives every form fill as a conversion, the platforms are optimizing for different outcomes.
Next, decide which conversion events should flow back to each ad platform. Google Ads, Meta through the Conversions API, and LinkedIn can receive server-side conversion events where the implementation and consent rules allow. Send meaningful, qualified outcomes rather than treating every early form as equivalent to pipeline. Keep the distinction between observed and modeled outcomes clear in internal reporting, and only transmit events the team can support under its data and consent policies.
Implementation rule: Map the CRM stage first, then build the event flow. Don't let an ad-platform field name define what “qualified” means to Sales.
Monitor the loop after launch. Check whether CRM stage changes trigger the expected events, whether duplicate submissions are suppressed, whether identifiers match across systems, and whether ad platforms acknowledge the events. Set alerts for broken syncs and unexpected changes in event volume. Use field mapping and custom reports to keep definitions consistent; use APIs and webhooks when downstream systems need the same attribution events.
A closed-loop attribution workflow is useful context for tracing the path from campaign interaction to CRM outcome and platform feedback. For teams evaluating options, SourceLoop is one platform that connects recorded visits and conversions with CRM sync and qualified offline conversion feedback to ad platforms. Keep the same governance standard whichever tools you use: a successful sync proves delivery, not that the event definition or attribution claim is correct.
Knowing When Multi Touch Attribution Reporting Is the Wrong Tool
Multi-touch attribution can show that recorded interactions appeared in a conversion path. It can't, by itself, prove those interactions caused the outcome. That gap matters most when a channel targets people who were already likely to convert, or when identity and consent gaps make the observed path incomplete.
BCG reports that 46% of surveyed marketers use the combined approach of marketing-mix modeling, incrementality testing, and multi-touch attribution. It also reports that leading barriers to incrementality include concerns about result reliability (44%), difficulty applying tests across ad types and retailers (43%), and insufficient tools (41%) (BCG's guide to effective marketing measurement). The practical lesson isn't to abandon attribution. It's to stop asking an observational report to answer a causal question.
Choose the measurement method for the decision
Use MTA for daily diagnostics: which paths appear, where channels assist, and where the funnel seems to stall. Use randomized holdouts or geo-experiments when the decision is whether a channel creates incremental conversions or revenue. When results disagree, document the disagreement and investigate it. Don't pick the result that supports the preferred budget outcome.
Consent and identity gaps need their own reporting treatment. Google says that when users deny consent, tags limit collection and may use modeling to fill measurement gaps. That means the dashboard should distinguish observed conversions from modeled ones and show whether journeys were linked, unresolved, or potentially duplicated. Treat data completeness as a reportable measure, not a footnote.
Before treating an attribution report as decision-grade, ask:
- What's observed? Can stakeholders distinguish recorded events from modeled estimates?
- What's missing? Are unresolved journeys and consent-related gaps visible?
- What's duplicated? Can you reconcile conversions across analytics, ad platforms, and CRM?
- What's the claim? Is the report describing correlation, or does a controlled test support causation?
- What changes the answer? Do window, identity, or model assumptions materially alter the conclusion?
If the team can't answer those questions, use the report to guide investigation, not to declare a channel winner. Run a holdout or geo-test before a material budget shift, and record what the test can and can't measure.
Before your next budget review, reconcile platform conversions with CRM outcomes, label modeled figures clearly, and put unresolved journeys where stakeholders can see them. Then choose one consequential channel decision and validate it with a controlled test before reallocating spend.


 Paid Social


