
What Is Revenue Attribution and Why It Matters in 2026
What is revenue attribution? Learn how it works, the main models, key metrics, and how to tie channel spend back to closed revenue in 2026.
Revenue attribution is the practice of assigning realized revenue to the marketing, advertising, sales, and other touchpoints that influenced a purchase. Last-click reporting gives all credit to the final interaction, while revenue attribution can distribute credit across the journey.
You may recognize the weekly reporting ritual: paid search appears to “win” because it captured the final demo request, while content, email, social campaigns, and sales conversations look unimportant. The report is tidy, but the budget decision built on it may be wrong. A channel that closes the journey isn't necessarily the channel that created demand.
Revenue attribution gives your team a more useful operating view. It connects interactions to closed revenue, applies a defined credit rule, and shows which channels appeared before customers paid. It still has limits, especially when you need to prove what caused a sale rather than what preceded it. That distinction will shape every sound attribution decision.
Table of Contents
- Revenue Attribution in Plain English
- From Single-Touch to Data-Driven Models
- Why Revenue Attribution Is Not the Same as Incrementality
- Metrics That Change Real Budget Decisions
- Implementing Revenue Attribution Without a Research Team
- Two Short Stories of Revenue Tied Back to Channels
- Building a Defensible Revenue Attribution Stack
Revenue Attribution in Plain English
A practical definition is:
Revenue attribution assigns realized revenue to the marketing, advertising, sales, and other touchpoints that influenced a purchase.
That definition separates revenue attribution from activity reporting. Clicks, impressions, sessions, and leads tell you that people engaged with your business. They don't tell you which interactions contributed to money reaching your bank account. Google Analytics attribution reporting supports measures such as key events, total revenue, purchase revenue, and ad revenue, helping teams connect customer paths with financial outcomes through Google's attribution documentation.
Last-click reporting answers a narrow question: “What happened immediately before conversion?” If a prospect discovers your company through organic search, reads an email, attends a sales call, and later clicks a branded ad before paying, last-click reporting assigns the sale to the ad. Revenue attribution can record the whole sequence and divide credit according to a chosen model.
Why the distinction changes budget conversations
Activity metrics reward exposure. Revenue attribution changes the question from “Which channel generated the most leads?” to “Which interactions contributed to closed revenue, and how much credit should each receive?”
That shift matters because the same sale can produce very different channel results depending on the model. A final interaction may deserve attention for conversion optimization, while an earlier interaction may deserve investment for demand creation. Neither view is automatically the complete truth.
A useful one-sentence explanation for a colleague is: Revenue attribution is a rule for connecting customer touchpoints to realized revenue, so teams can compare investments using financial outcomes instead of engagement alone.
The rest of the subject follows that definition. You need to understand the models, separate attribution from incrementality, choose metrics that support decisions, connect CRM and payment data, and audit the parts of the journey your systems can't observe.
From Single-Touch to Data-Driven Models
Attribution models are rulebooks. They don't discover a universal answer hidden inside your data. They decide how available revenue credit gets distributed.
Start with the simplest rules
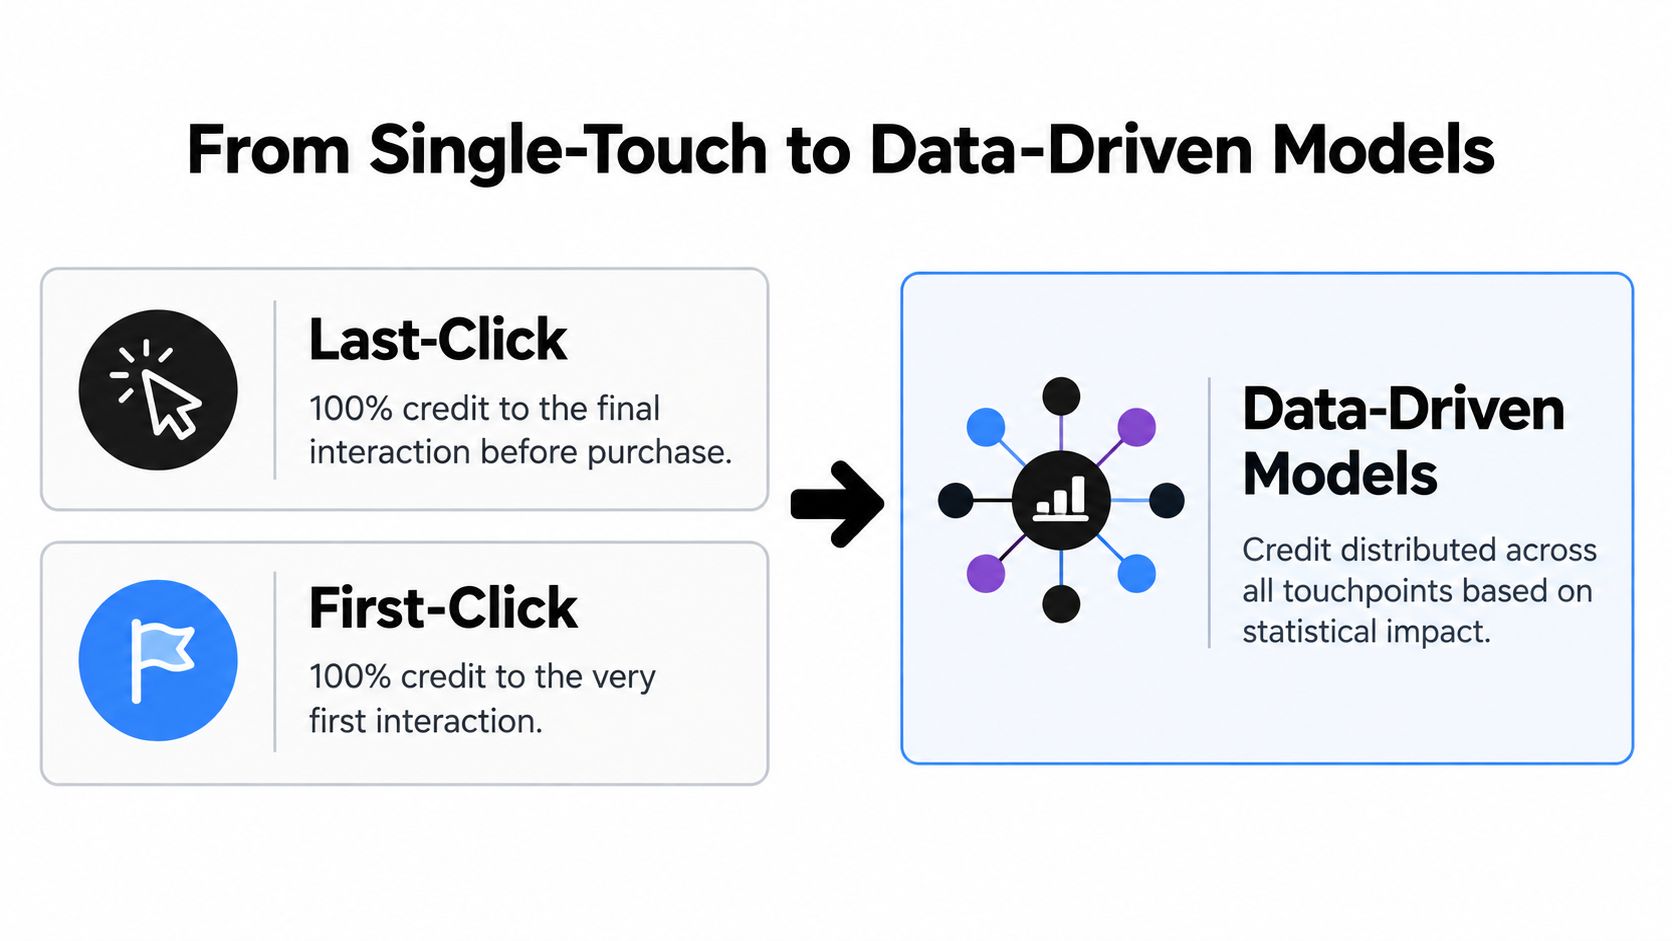
Last-click attribution gives all credit to the final qualifying interaction before purchase. It's easy to explain and useful when your immediate question is what closes an existing buyer, but it can overvalue branded search, direct visits, retargeting, or a final sales follow-up.
First-click attribution gives all credit to the first recorded interaction. It helps identify what introduced a prospect to your business, yet it ignores the consideration and conversion work that followed.
Suppose one customer first encounters a LinkedIn campaign, later reads an organic article, receives an email, and finally converts through paid search. Last-click makes paid search the winner. First-click makes LinkedIn the winner. The sale hasn't changed. Only the credit rule has.
Linear attribution divides credit equally across recorded touchpoints. It recognizes the full path, but it treats every interaction as equally influential, even when one touch was a brief visit and another was a high-intent product conversation.
Time-decay attribution gives greater weight to interactions closer to conversion. This can fit journeys where recent touches strongly influence action, but it may undervalue the earlier work that created awareness and trust.
Choose the rule that matches the decision
For a short ecommerce journey with few interactions, a simple model may provide a usable operational signal. For a long B2B sales cycle involving content, campaigns, sales activity, and multiple stakeholders, a single-touch model hides too much of the path. A multi-touch approach is usually more informative, provided your identity and revenue data are reliable.
Data-driven attribution takes a different route. Rather than applying the same fixed split to every journey, it estimates touchpoint contribution by comparing converting and non-converting paths. Google describes models that can use both rule-based methods and machine-learning algorithms, and its reporting can show fractional credit such as 0.4 of a conversion or the corresponding fraction of revenue instead of forcing one channel to receive all the value. The mechanics and trade-offs are also laid out in this practical SubmitMySaas attribution guide.
Practical rule: Use the simplest model your team can explain, audit, and apply consistently. A sophisticated model with incomplete data creates more confidence than clarity.
For a deeper B2B-specific comparison, see B2B attribution models. The right model depends less on fashion than on your sales cycle, channel mix, offline activity, and decision horizon.
This short video offers another visual explanation of how attribution models distribute credit:
Why Revenue Attribution Is Not the Same as Incrementality
Revenue attribution and incrementality answer different questions.
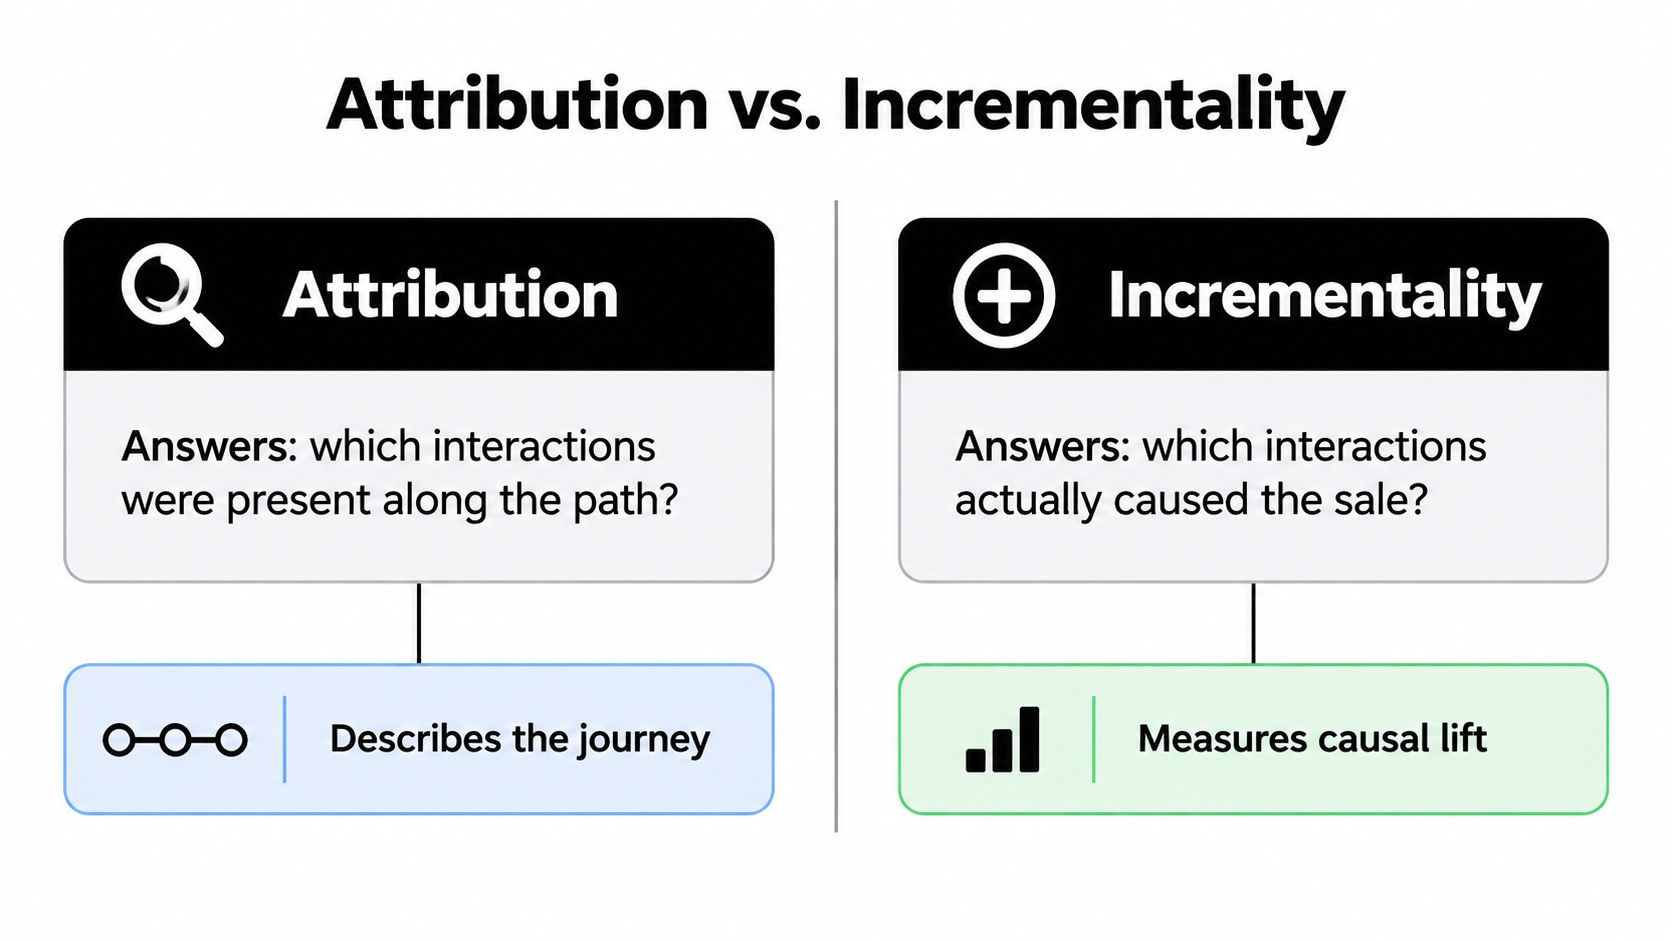
Attribution asks, “Which interactions were present along the path to purchase?” Incrementality asks, “What revenue wouldn't have happened without the marketing?” The first question supports operational reporting. The second is a causal question.
That difference matters because some touches are close to conversion without creating additional demand. A customer may search for your brand after already deciding to buy. A retargeting ad may reach someone who would have returned directly. A sales follow-up may receive credit because it happened before payment, even though the buyer was already committed.
Use experiments to test causal impact
Holdout tests compare outcomes for people exposed to a marketing activity with outcomes for a comparable group that wasn't exposed. Geo experiments use different geographic areas to compare marketing exposure and results. Both methods can help estimate incremental impact when you can design a credible control.
Marketing-mix modeling provides a broader approach when individual-level tracking is incomplete. Google's open-source Meridian model uses Bayesian causal inference, aggregate data, and calibration with incrementality experiments to estimate impact without relying on individual identifiers or cookies, as described in its Meridian marketing-mix modeling resource.
A lean team doesn't need to replace attribution with experiments. It should layer them.
- Use journey-based attribution for campaign review, sales follow-up, channel diagnostics, and fast operating decisions.
- Use holdouts or geo tests when a channel receives meaningful budget or when credited revenue seems too easy to win.
- Use marketing-mix modeling when offline activity, multiple markets, or fragmented identity makes user-level measurement incomplete.
Your threshold depends on budget size, sales-cycle length, offline activity, channel overlap, and whether you can randomize exposure. If the decision involves a major long-term investment and you can run a credible test, attribution alone shouldn't carry the argument. Teams working on ecommerce experimentation can also review this guide to boost revenue with Shopify experiments.
The practical lesson is simple: attribution describes the observed journey, while incrementality tests the counterfactual journey that would have happened without the marketing. For a broader view of causal and channel evaluation, compare it with advertising effectiveness measurement.
Metrics That Change Real Budget Decisions
A revenue attribution report becomes useful when it changes an action. Different metrics support different decisions, so avoid compressing every channel into one score.
ROAS compares attributed revenue with advertising spend. It helps with bidding and channel allocation, but its meaning depends on the attribution model and whether the revenue figure reflects booked, collected, or net revenue.
MER, or marketing efficiency ratio, looks at overall revenue against total marketing spend. It provides a broader business view than platform-level ROAS, especially when several channels work together.
Customer acquisition cost connects total acquisition investment with newly acquired customers. It helps leadership assess efficiency, while attribution helps explain which touchpoints influenced those customers.
Pipeline velocity focuses on how quickly qualified opportunities move toward revenue. Deal velocity by source can reveal whether a channel produces fast-moving opportunities or a larger number of slow, uncertain ones.
Assisted revenue identifies revenue associated with interactions that weren't the final conversion touch. Multi-touch revenue distributes value across the journey according to the selected model.
| Metric | What it measures | Decision it informs |
|---|---|---|
| ROAS | Attributed revenue relative to advertising spend | Bidding and paid-channel budget shifts |
| MER | Revenue relative to total marketing spend | Overall efficiency and planning |
| Customer acquisition cost | Acquisition investment per new customer | Sustainable growth decisions |
| Pipeline velocity | Movement of qualified opportunities toward revenue | Sales follow-up and forecast confidence |
| Deal velocity by source | How quickly deals from each source progress | Channel prioritization and routing |
| Assisted revenue | Revenue connected to non-final interactions | Whether to protect supporting channels |
| Multi-touch revenue | Revenue distributed across recorded touches | Budget allocation across the journey |
Consider a channel with weak last-click ROAS but substantial assisted revenue. Cutting it may remove the early or middle journey touches that help another channel close. Conversely, a channel with strong attributed pipeline but slow deal velocity may need better qualification rather than more spend.
A manager might place ROAS and CAC on the performance slide, pipeline velocity and deal velocity on the revenue forecast slide, and assisted revenue on the investment discussion slide. To choose supporting sales measures, teams can find sales metrics for their team.
The operating principle is credit distribution, not raw volume. A channel that generates many leads but little qualified revenue shouldn't automatically receive more budget. A channel that rarely closes the deal itself may still deserve investment if its earlier interactions consistently support profitable journeys. For a broader measurement framework, see measurement in marketing.
Implementing Revenue Attribution Without a Research Team
You don't need a large analytics department to build a useful attribution layer. You do need a consistent path from first visit to payment.
Start with the collection points. Install one website tracking snippet, capture source information on forms, preserve chat and calendar-booking events, and connect ad campaigns to those interactions. Then connect the CRM so lead, opportunity, stage, and closed-deal events can travel back into the same record.

Connect revenue, not just conversions
A form submission is an event. A paid invoice is a financial outcome. Connect Stripe or another payment processor so the system can distinguish leads and bookings from realized revenue. For B2B companies, sync CRM deal stages and final values. For ecommerce teams, pass order values and refunds into the reporting layer.
The technical connection is only the beginning. Your team must resolve identities across devices and systems, deduplicate contacts, define attribution windows, handle refunds, and decide how to treat currency differences. Privacy restrictions and consent choices will leave some journeys incomplete, so your report should show coverage and unknown revenue rather than implying that every touch was observed.
Create a short measurement contract before launching:
- Revenue definition: State whether reports use booked, invoiced, collected, or net revenue.
- Conversion identity: Preserve an immutable conversion or order ID so records aren't counted twice.
- Consent record: Store the relevant consent status and respect restrictions on collection and activation.
- Attribution window: Document how far before conversion the system can assign credit.
- Reconciliation: Compare CRM totals with payment-processor totals and investigate differences.
- Unknown and modeled revenue: Label revenue that can't be tied to an observable journey.
- Refund handling: Decide when refunded or canceled revenue leaves the attributed total.
A 2025 global marketing-data survey reported concern about cross-channel tracking among 66% of businesses, concern about weaker attribution after third-party-cookie loss among 57%, adoption of privacy-first tracking solutions among 65%, and zero-party-data use among 16%. Those figures appear in the Supermetrics 2025 marketing data report announcement. PwC also reported that 88% of surveyed executives said privacy rules made personalization more difficult, while 43% cited resource constraints as a major barrier, in the same verified research context.
The contract makes attribution auditable. Without it, a precise-looking dashboard can compare incompatible revenue definitions, duplicate customers, and incomplete journeys.
Two Short Stories of Revenue Tied Back to Channels
Consider a B2B SaaS company running paid search, LinkedIn, and a content newsletter. Its last-click report credits paid search with nearly every trial because prospects often return through a branded query immediately before signing up.
The team connects CRM opportunity records with campaign and content touchpoints. The resulting multi-touch view shows that LinkedIn often introduced target accounts, the newsletter kept those accounts engaged, and organic demo pages appeared during serious evaluation. Paid search still mattered, but it was capturing demand that other channels had helped create.
The team doesn't kill paid search or treat the newsletter as a winner by default. It changes the budget conversation from “which channel closed the trial?” to “which combination supported qualified revenue?” The biggest lesson is that a closing touch and a demand-creating touch can be different interactions.
Now consider a direct-to-consumer brand using Meta and TikTok. Shopify orders flow into the payment and revenue system, and refunds are netted out before the team evaluates channel performance. The first report shows TikTok producing inexpensive first purchases, while Meta appears stronger when the team examines customer value beyond the initial order.
That result changes the decision. The team doesn't chase the platform with the most attractive first-order headline. It considers acquisition source, refunds, repeat value, and the measurement window together. The central lesson is revenue attribution should support a time horizon that matches the business model, not just the moment of first purchase.
Both stories are examples of operational reporting, not causal proof. The connected data shows which channels appeared in observed journeys and how the team can allocate credit. Testing is still needed to determine whether reducing exposure would reduce revenue.
Building a Defensible Revenue Attribution Stack
A defensible stack has layers because no single measurement method answers every business question.
The first layer is journey-based revenue attribution. It connects touchpoints to leads, opportunities, customers, and payments. This layer supports fast decisions such as campaign review, paid-media optimization, sales follow-up, and channel diagnostics.
The second layer is incrementality testing. Holdouts and geo experiments help determine whether credited activity changed outcomes. This layer is slower to organize, but it protects the budget from channels that collect credit mainly because they appear near conversion.
The third layer is marketing-mix modeling. It becomes useful when identity is fragmented, offline activity matters, or leadership needs a broader view for planning. It works with aggregate data and should be calibrated against experiments where possible.
Small teams should avoid buying complexity they won't operate. Don't start with an elaborate model if your CRM stages are inconsistent, payment totals don't reconcile, or campaign naming is unreliable. Clean inputs and a documented model usually produce more value than an impressive dashboard nobody trusts.
Decision standard: Treat revenue attribution as an operating layer, not the final word on marketing causation.
Use this checklist over the next week:
- Choose one primary model: Write down the credit rule and the business decision it supports.
- Unify the records: Connect website activity, CRM stages, advertising data, and payment outcomes through one reporting path.
- Sign the measurement contract: Define revenue, identity, consent, windows, refunds, and unknown journeys.
- Audit coverage: Compare attributed totals with CRM and payment totals, then label gaps.
- Schedule testing: Plan at least one incrementality test each quarter when the channel and budget justify it.
When teams follow those steps, attribution becomes a repeatable management process. It won't eliminate uncertainty, but it will make uncertainty visible and budget decisions easier to defend.
If your team still relies on last-click reporting, start with one revenue path this week. Connect your CRM and payment data, define the revenue you want to measure, choose a transparent attribution model, and audit which journeys remain unknown. For teams that want to evaluate a practical multi-touch setup, review how SourceLoop connects web visits, forms, CRM deals, and Stripe revenue to customer journeys.




 Paid Social


