
How to Build a Custom Marketing Attribution Report
Build marketing reports like a document, with notes and live charts, tables, and KPIs from your attribution data, for weekly reviews, client reports, and board updates.
On this page
Pre-built reports answer the common questions. Your own reports answer yours: a monthly client report, a weekly team review, an ad plan, or a board update. They work like a document, with headings, text, and notes, except the charts, tables, and numbers are live SourceLoop data that update every time the report is opened.
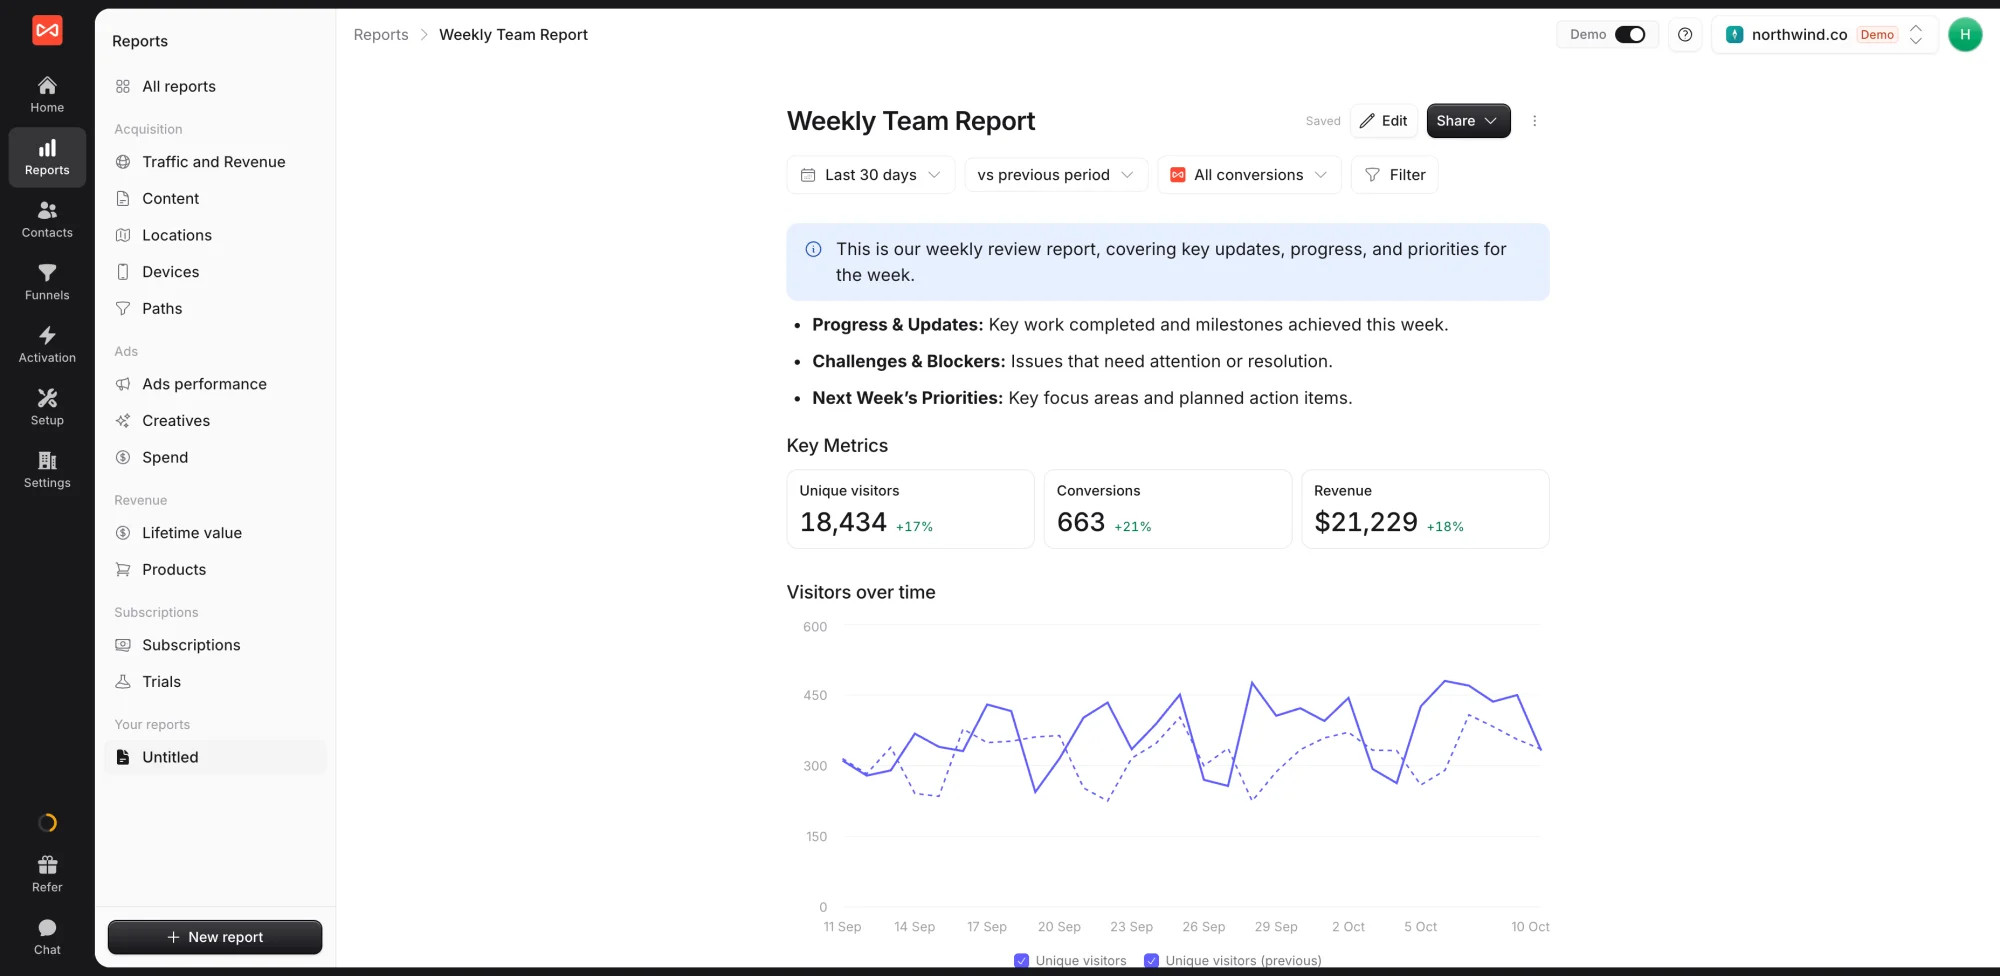
Step 1: Start a report
- Open Reports in the left sidebar, then click New report at the bottom of the reports list, or All reports to see templates.
- Pick a template, or start blank:
- Monthly client report: summary, results, channels, campaigns, and next steps
- Weekly review: this week against last week, by channel, with notes
- Lead sources: the sources, campaigns, and landing pages behind each lead
- Ad scaling plan: which campaigns to scale, hold, or cut
- Marketing costs, Channel mix, Audience snapshot, MRR snapshot, and Attribution model comparison
- Untitled: an empty page
To build on a pre-built report instead, open it, click the menu next to Share, and choose Duplicate. The copy appears under Your reports.
Step 2: Write and lay out the page
A new report opens ready to edit. Give it a title and an optional description, then type as you would in any document.
Type / anywhere to add a block:
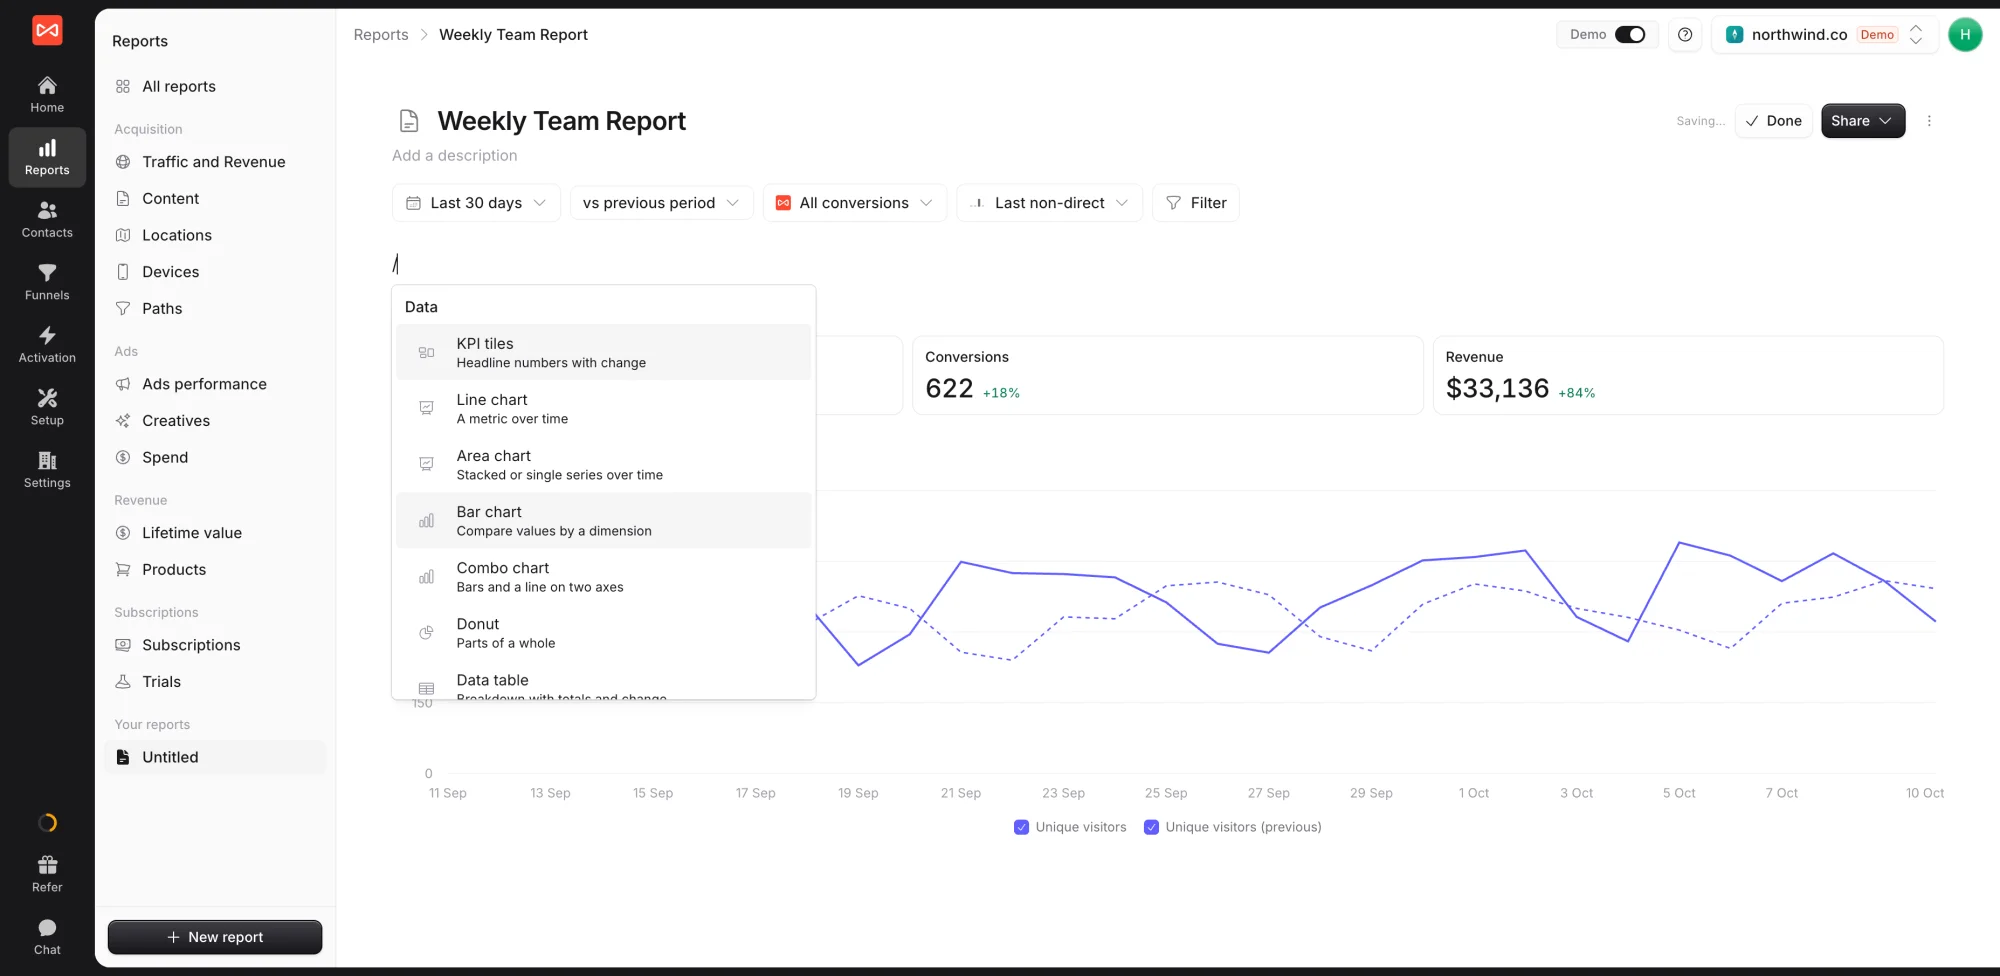
- Text blocks: headings, lists, to-dos, toggles, callouts, code, images, and files
- Charts and numbers: KPI tiles, line, area, bar, and combo charts, donuts, maps, heatmaps, funnels, data tables, and pivots
- Ready-made widgets: Visitors over time, Conversions by channel, Channel by week, Visitors by country, Visitors by device, Journeys to conversion, Revenue cohorts, Ad creatives, and more
- Layout: Tabs to show different content per tab, and Page break to control where exported pages split
Drag a widget’s right edge to change its width. Narrow widgets sit side by side, which is how you build columns. Drag the bottom edge to change its height.
Step 3: Build a chart or table
Click a widget to open the builder. The Data tab walks you through the steps on the left, with a live preview on the right:
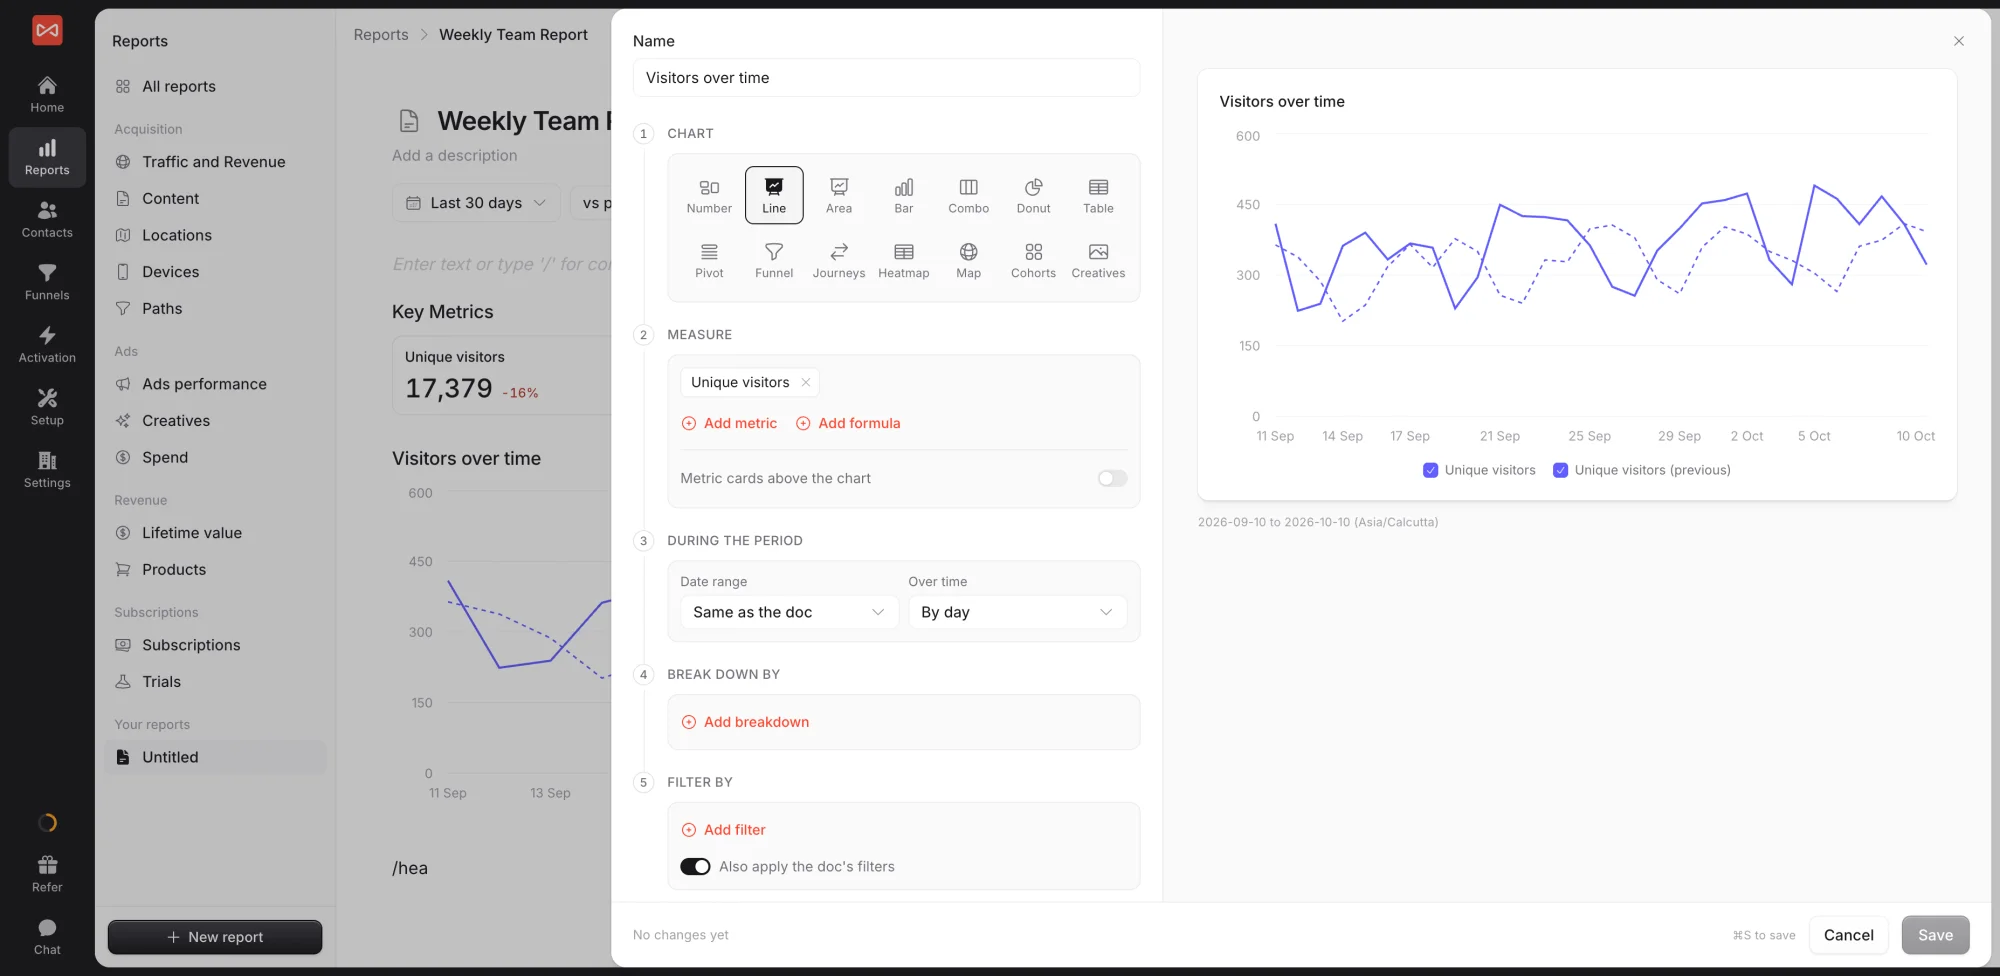
- Chart: pick the type. The rest of the steps adapt to it.
- Measure: add metrics, such as visitors, conversions, Good leads, revenue, cost per lead, or a specific conversion event. Add a formula to divide or combine metrics, for example conversions divided by visitors.
- During the period: follow the report’s date range or set one for this widget.
- Break down by: channel, source, campaign, landing page, country, device, your custom fields, and more.
- Filter by: narrow this widget only.
- Attribution model: credit conversions and revenue under the report’s models or this widget’s own.
The Style tab sets colours, labels, legends, and whether a table shows search, totals, and changes against the comparison period. Click Save to keep your changes or Cancel to drop them.
Options that can’t work for the chart you picked are greyed out with a line explaining why.
Step 4: Set the report’s controls
The bar at the top of the report sets the date range, comparison, attribution models, filters, and what the report is Measuring for every widget that follows the report. Change it once and the whole report updates.
Step 5: Switch between reading and editing
Click Done when you finish. The report then opens for reading: readers can change the date range, switch tabs, expand rows, and see the people behind a number, but they can’t move or change anything. Click Edit to make changes again.
What’s next
- Share it with your team or a client: Share a report
- Send it as a PDF or PowerPoint deck: Export a report
- Put your agency’s brand on it: White-label branding
Frequently asked questions
-
What's the difference between a pre-built report and my own report?
Pre-built reports such as Traffic and Revenue are the same for everyone and can't be edited. Your own reports are documents you build and change freely. To start from a pre-built one, open its menu and choose Duplicate.
-
Can several people edit a report at the same time?
Yes. Everyone with edit access sees each other's changes as they type, and nothing anyone writes is overwritten.
-
Do the numbers update by themselves?
Yes. Every chart, table, and KPI reads live data each time the report is opened, for the date range set at the top of the report.
-
Can I go back to an earlier version?
Yes. Open the report's menu and choose Version history. SourceLoop keeps versions automatically, and restoring one keeps the current version too, so a restore can always be undone.
-
Can an AI assistant write reports for me?
Yes. With SourceLoop connected to Claude, ChatGPT, or Cursor through MCP, you can ask it to create or edit a report, such as "build a monthly report for this client with leads by channel and a short summary". It saves a version before every edit.
-
Who can see a report I create?
By default everyone on the website it belongs to. You can make it private or add specific people from Share, then Share with team.

 Paid Social


