
Cost Per Conversion: A Practical Guide to Lower CPA
Learn what cost per conversion really means, how to calculate it, and proven tactics to lower your CPA with sharper attribution and measurement.
The most popular advice about cost per conversion is incomplete: lower the number and performance improves. That rule can push a campaign toward cheap form fills, duplicate submissions, or other low-value actions while qualified pipeline deteriorates. A dashboard can celebrate a falling CPA at the same time that sales receives fewer opportunities worth pursuing.
A useful analysis starts with the formula, but it doesn't end there. Cost per conversion is a media-efficiency checkpoint, not a verdict on profitability. You need to connect it to conversion quality, sales outcomes, customer acquisition cost, and ultimately the margin created by each acquisition channel.
Table of Contents
- What Cost Per Conversion Really Measures
- The Core Formulas and a Worked Example
- Industry Benchmarks and Why Averages Mislead
- Attribution and Tracking Complications
- Tactics That Actually Lower Cost Per Conversion
- Implementing Accurate Measurement With Attribution Tools
- A Measurement Maturity Ladder You Can Self-Assess
What Cost Per Conversion Really Measures
Cost per conversion equals attributable ad spend divided by counted conversions. If a campaign records a form submission, purchase, booking, or another selected action, this figure prices that action. It does not show whether the person was qualified, whether the sale closed, or whether the customer stayed.
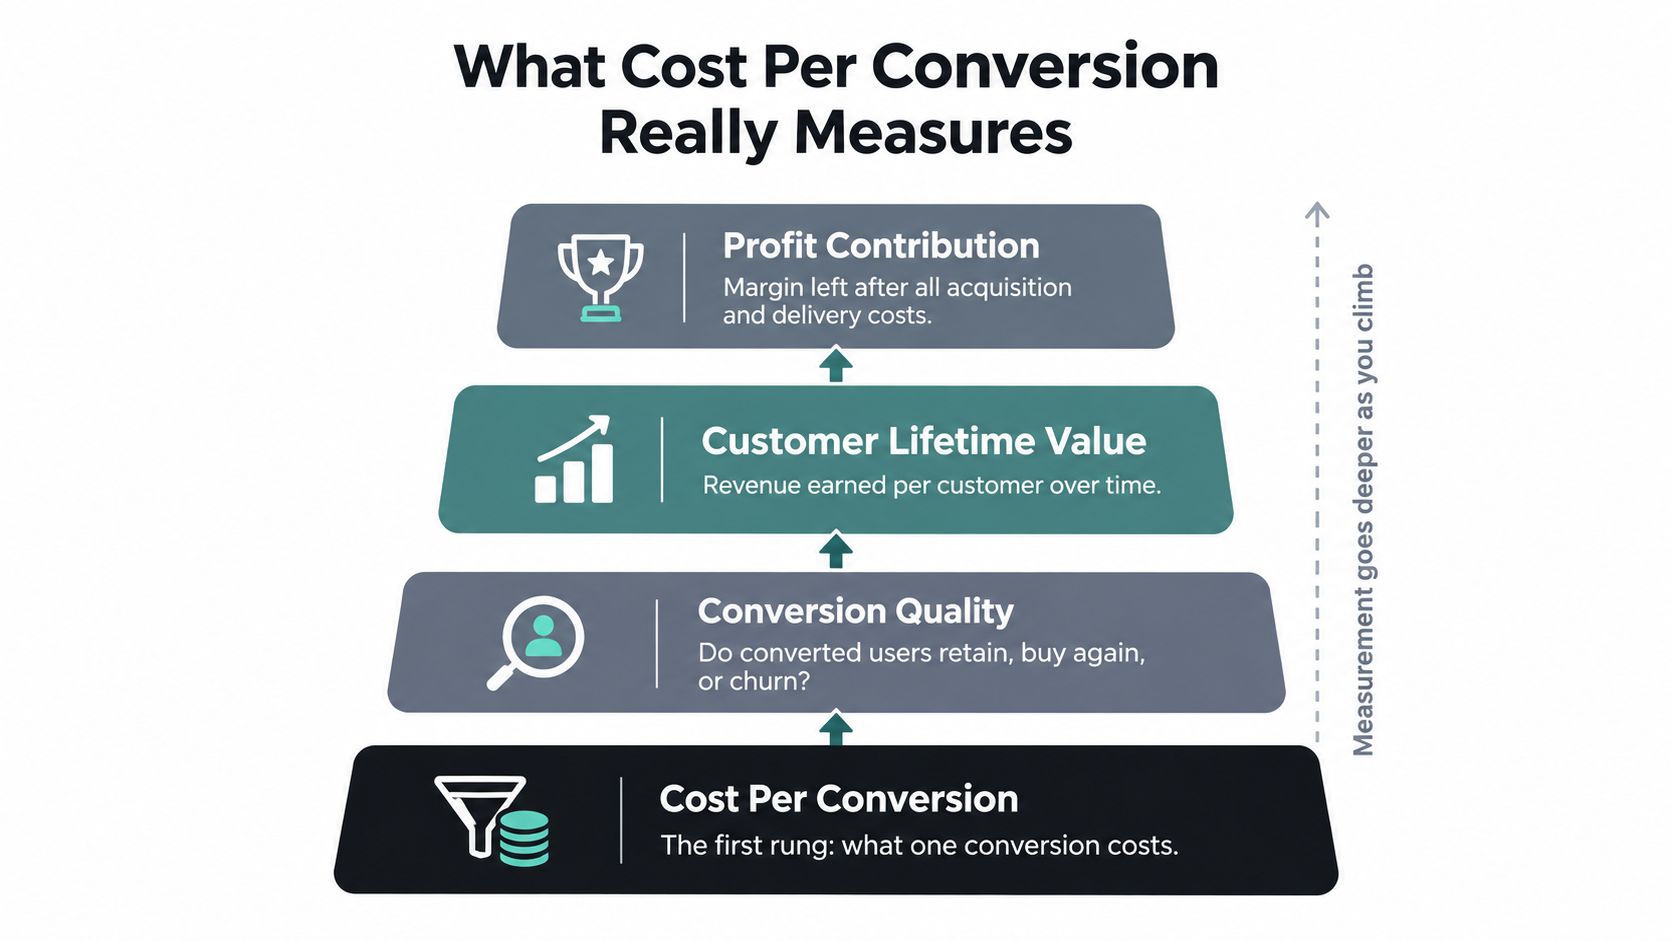
That limitation makes the metric a checkpoint, not a business verdict. Cost per click measures the cost of generating a visit. Cost per conversion measures the cost of generating the chosen action. Cost per qualified lead and cost per opportunity connect media spend to commercial progress, while customer acquisition cost measures what it took to win a new customer. Revenue and profit contribution then test whether the acquisition created economic value.
The lower number isn't always the better number
A campaign can lower reported cost per conversion by optimizing for an easy action rather than a valuable one. Google describes conversion reporting as based on eligible, trackable interactions, with modeled conversions included when direct observation is unavailable. Its documentation also explains that the Conversions column can combine selected conversion actions, and that conversion rates can exceed 100% when multiple conversions are counted for one interaction (Google Ads conversion tracking documentation).
The practical risk is easy to miss. If brochure downloads and demo bookings share one conversion total, the platform may favor people willing to download a brochure. Reported cost per conversion falls, while sales receives fewer serious buyers. The denominator improved, but pipeline quality declined.
Practical rule: Name the conversion being priced before deciding whether its cost is acceptable.
Keep each measurement rung visible:
- Cost per click: media cost for traffic.
- Cost per conversion: media cost for the selected action.
- Cost per qualified lead: spend divided by leads meeting agreed qualification criteria.
- Cost per opportunity: spend divided by sales-accepted opportunities.
- Customer acquisition cost: total acquisition cost divided by new customers.
The final rung connects campaign efficiency to unit economics. Teams comparing acquisition channels can browse the CAC glossary for the terminology, then keep these measures separate in reporting. A cheaper counted action is useful only when it contributes to qualified pipeline and customer growth.
The Core Formulas and a Worked Example
Cost per conversion is a starting point, not a final verdict:
Cost per conversion = total attributable ad spend ÷ completed conversion actions
Suppose two campaigns spend $4,000 and produce 110 counted conversions. Their blended cost per conversion is $36.36. The calculation is correct, yet the average conceals different campaign economics and lead quality.
Campaign A spends $1,400 and produces 50 conversions, giving it a cost per conversion of $28. Campaign B spends $2,600 and produces 60 conversions, giving it a cost per conversion of approximately $43.33. If Campaign A mainly generates unqualified inquiries while Campaign B creates sales-accepted opportunities, moving budget toward Campaign A improves the dashboard while weakening pipeline. Lower CPA can therefore inflate reported efficiency and reduce revenue potential.
Use the same worksheet for related measures:
- Cost per lead: attributable spend divided by completed leads. In B2B reporting, teams may use this interchangeably with CPA, although the priced action is usually a form fill rather than a customer.
- Cost per acquisition: acquisition spend divided by new customers. Define “acquisition” clearly, because a lead and a paying customer represent different outcomes.
- Cost per click: ad spend divided by clicks.
- Click-to-conversion efficiency: conversion rate multiplied by CPC gives the implied media cost per conversion when both inputs use compatible definitions. For example, an average CPC of $4.66 and a 6.96% conversion rate imply a cost per conversion near $67, subject to rounding and counting rules.
| Metric | What it prices | Best for |
|---|---|---|
| Cost per click | A click from an ad | Evaluating traffic acquisition |
| Cost per conversion | A counted conversion action | Checking media efficiency |
| Cost per qualified lead | A lead that meets qualification rules | Managing lead quality |
| Cost per opportunity | A sales-accepted opportunity | Connecting marketing to pipeline |
| Customer acquisition cost | A newly acquired customer | Evaluating acquisition economics |
Segment before you optimize
Do not optimize the blended figure alone. Break results down by channel, campaign, landing page, conversion type, device, audience, and geographic market when each comparison has enough reliable data.
Then add fields the ad platform cannot know by itself: qualification status, booking status, opportunity status, customer status, revenue, and time from conversion to outcome. This creates a measurement hierarchy from click to conversion, qualified lead, opportunity, and customer. A cheaper counted action matters only when it survives those later checks.
Industry Benchmarks and Why Averages Mislead
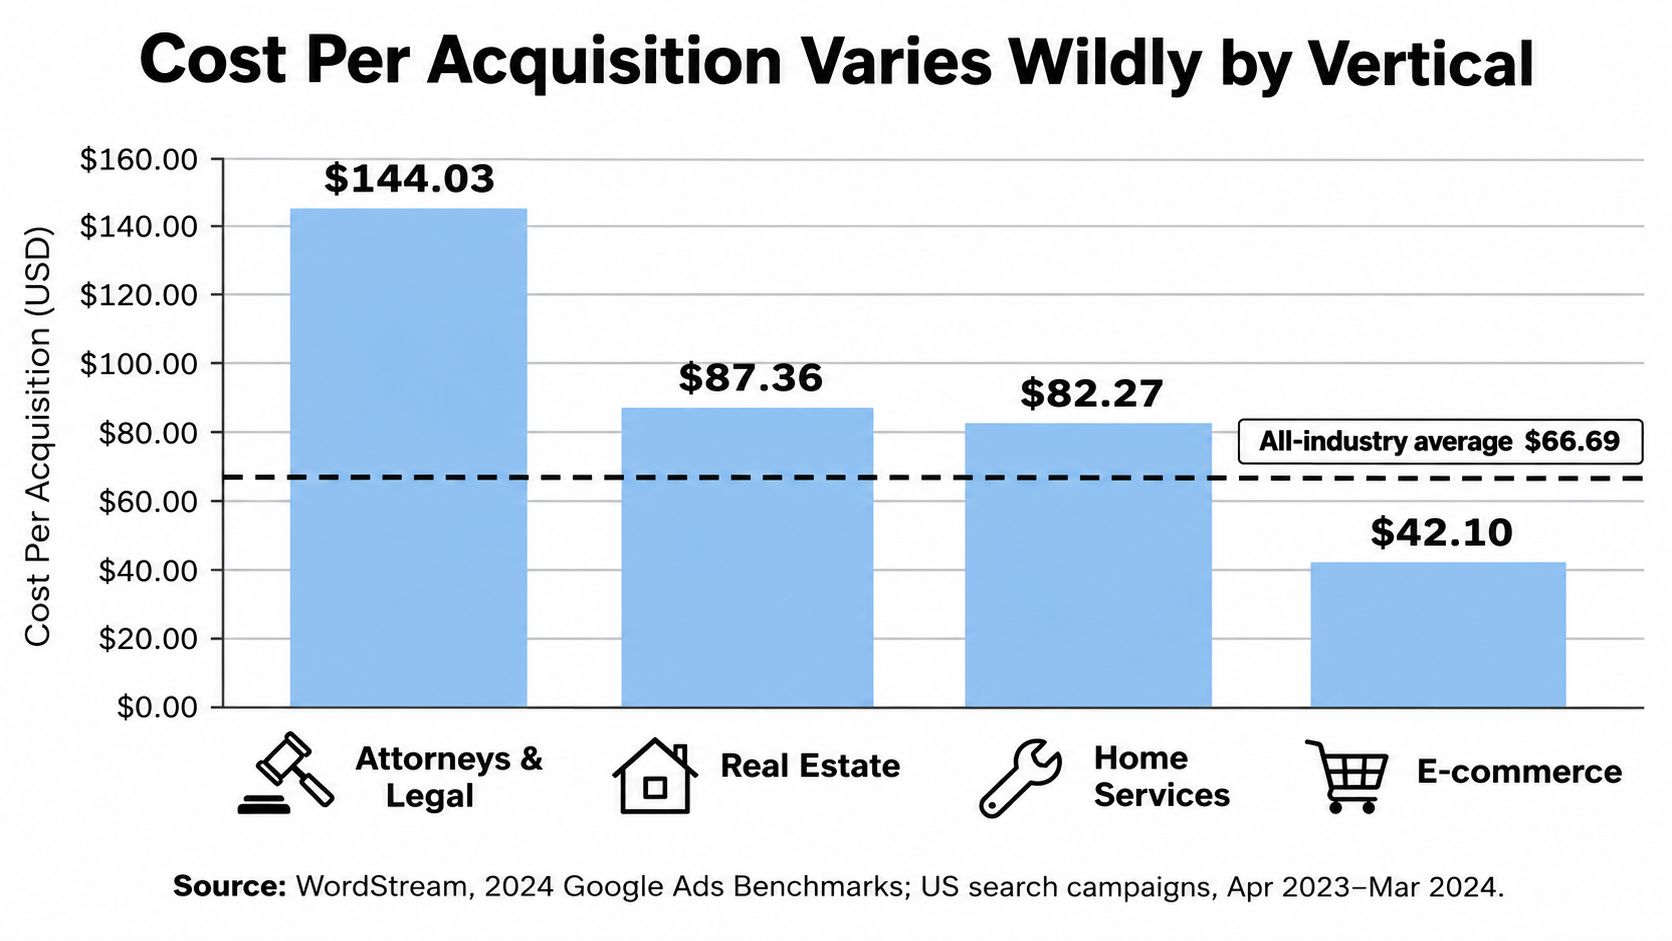
A benchmark can expose an unusual result, but it cannot set a responsible budget target. The 2024 WordStream benchmark analyzed more than 17,000 U.S.-based Google Ads campaigns running from April 2023 through March 2024. It reported an average cost per conversion of $66.69, an average CPC of $4.66, and an average conversion rate of 6.96% (WordStream's benchmark methodology and results).
Category-level variation matters more than the blended figure. Attorneys and legal services averaged $144.03, furniture averaged $119.10, and career and employment averaged $117.92. Animals and pets averaged approximately $23.57, while restaurants and food averaged $29.67. Auction pressure, buying intent, product economics, and conversion definitions can all create these differences.
Build an internal reference point
A legal practice and a restaurant should not share the same acceptable acquisition cost. Two companies in one category may still define a conversion differently, sell at different prices, or apply different lead-qualification standards.
Use external benchmarks to frame questions, then build your own reference point:
- Establish actuals: Review recent performance by campaign, channel, landing page, and conversion type.
- Account for conditions: Adjust expectations for seasonality, budget changes, inventory, sales capacity, and auction competition.
- Set a test target: Connect improvement expectations to the landing-page, audience, creative, or offer tests your team can run.
- Review downstream value: Compare cost per conversion with cost per qualified lead, cost per opportunity, and customer acquisition cost.
This hierarchy prevents a cheap form fill from masquerading as efficient growth. A campaign can lower reported CPA while sending fewer qualified opportunities to sales, inflating conversion volume and weakening revenue performance.
For a related view of category-level conversion-rate variation, see conversion rate benchmarks by industry. Use that reference to investigate gaps, not to copy a target into a media plan.
A defensible target reflects your funnel's past results, sales capacity, and intended conversion. A benchmark can show that performance deserves investigation. Profitability requires connecting the counted action to qualified pipeline and customers.
Attribution and Tracking Complications
A calculated cost per conversion can still misstate performance. The count may miss conversions, assign credit under rules that hide earlier influence, or optimize toward an action that never becomes revenue. Cost per click, cost per conversion, cost per qualified lead, and customer acquisition cost form a measurement hierarchy. Improving the first two while qualified pipeline falls creates a better dashboard and a weaker business.
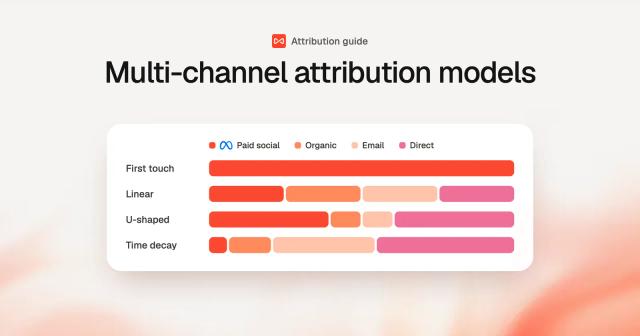
Single-touch attribution gives one interaction all the credit. First-touch reporting can overstate the channel that introduced the prospect, while last-touch reporting can over-credit branded search or retargeting. Multi-touch attribution spreads credit across the journey, but its result depends on the weighting method and the interactions the system can observe. Teams comparing attribution models that fit your store should record those rules before judging channel performance.
Three sources of silent distortion
Tracking coverage creates the first gap. Cookie restrictions, consent choices, cross-device activity, offline conversations, and untagged traffic can break the link between spend and outcome. Google states that reporting applies to eligible, trackable interactions and may include modeled conversions when direct measurement is unavailable, as cited earlier. Modeled results can estimate missing behavior, but they are not directly observed conversions.
Attribution choice creates the second. A channel may look weak under last-click reporting because it creates demand early, then appear stronger under a model that credits discovery and consideration. Record the attribution model, reporting window, conversion window, and included actions. Otherwise, two CPA figures can look comparable while following different rules.
Feedback-loop integrity creates the third. A consultation may become a qualified opportunity in the CRM, but if that status never reaches Google Ads, Meta, or LinkedIn, the platform keeps optimizing for the original form fill. The algorithm receives volume without commercial judgment, so a low CPA can conceal declining lead quality.
Compare platform-reported conversions with CRM outcomes and define which funnel stages are observable. Trace sample conversions from ad interaction through qualification and revenue, then investigate breaks in that chain.
For a wider view, see this guide to advertising effectiveness measurement. The practical test is whether a reported conversion connects to a real person, a defined qualification outcome, and a commercial result.
Tactics That Actually Lower Cost Per Conversion
Lowering CPA requires more than changing a bid or replacing a headline. Work from the point where waste enters the funnel, then confirm that the conversion denominator still represents people your business wants.
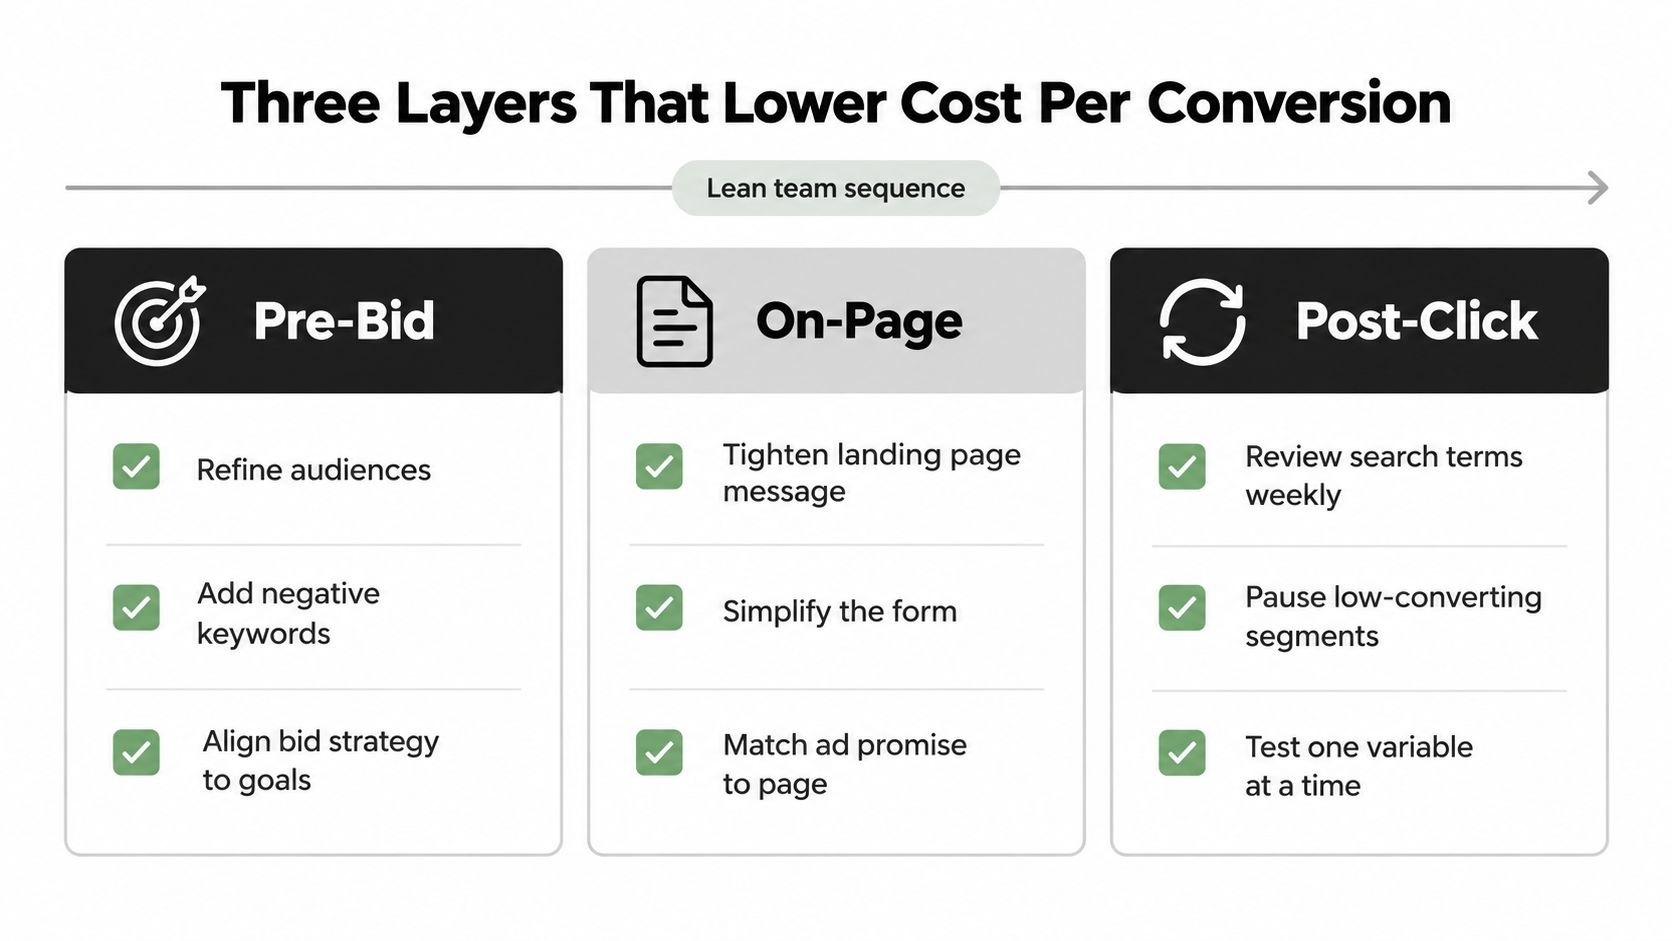
Pre-bid controls
Start with search-term quality, audience fit, geography, schedule, and device performance. Add negative keywords that block research-only intent, exclude audiences that can't buy, and align the bid strategy with the conversion being priced. A campaign optimized for qualified meetings needs a different feedback signal from one optimized for ecommerce purchases.
Review the search-term report regularly. A cheap click from an irrelevant query isn't efficient traffic, even if the landing page converts that visitor into a low-value action.
On-page changes
The landing page should repeat the promise that earned the click. Remove competing calls to action, explain the next step, and make the form request proportional to the value of the offer. Shortening a form may increase submissions, but a qualification question can protect the sales team's time and improve the usefulness of the denominator.
Useful tests include:
- Message match: Use the same problem, audience, and offer language across ad and page.
- Friction control: Remove fields that don't support qualification or routing.
- Intent clarity: Tell visitors what happens after they submit.
- Conversion integrity: Track completed actions rather than button clicks when possible.
Post-click operations
Marketing can lower apparent CPA by accepting more conversions. Revenue teams lower effective acquisition cost by responding quickly, routing leads correctly, nurturing viable prospects, and disqualifying spam or duplicate records. If the CRM marks every form as a success, the platform learns to find more of the same.
A practical 30-day sequence is:
- Days 1 to 10: Audit conversion actions, search terms, duplicate records, and qualification rules.
- Days 11 to 20: Run one landing-page or message-match test while tightening exclusions.
- Days 21 to 30: Compare cost per conversion with qualified-lead rate and sales outcomes, then reallocate only where quality holds.
For a broader discussion of the forces behind rising acquisition costs, see why customer acquisition costs keep rising from Excellorix.
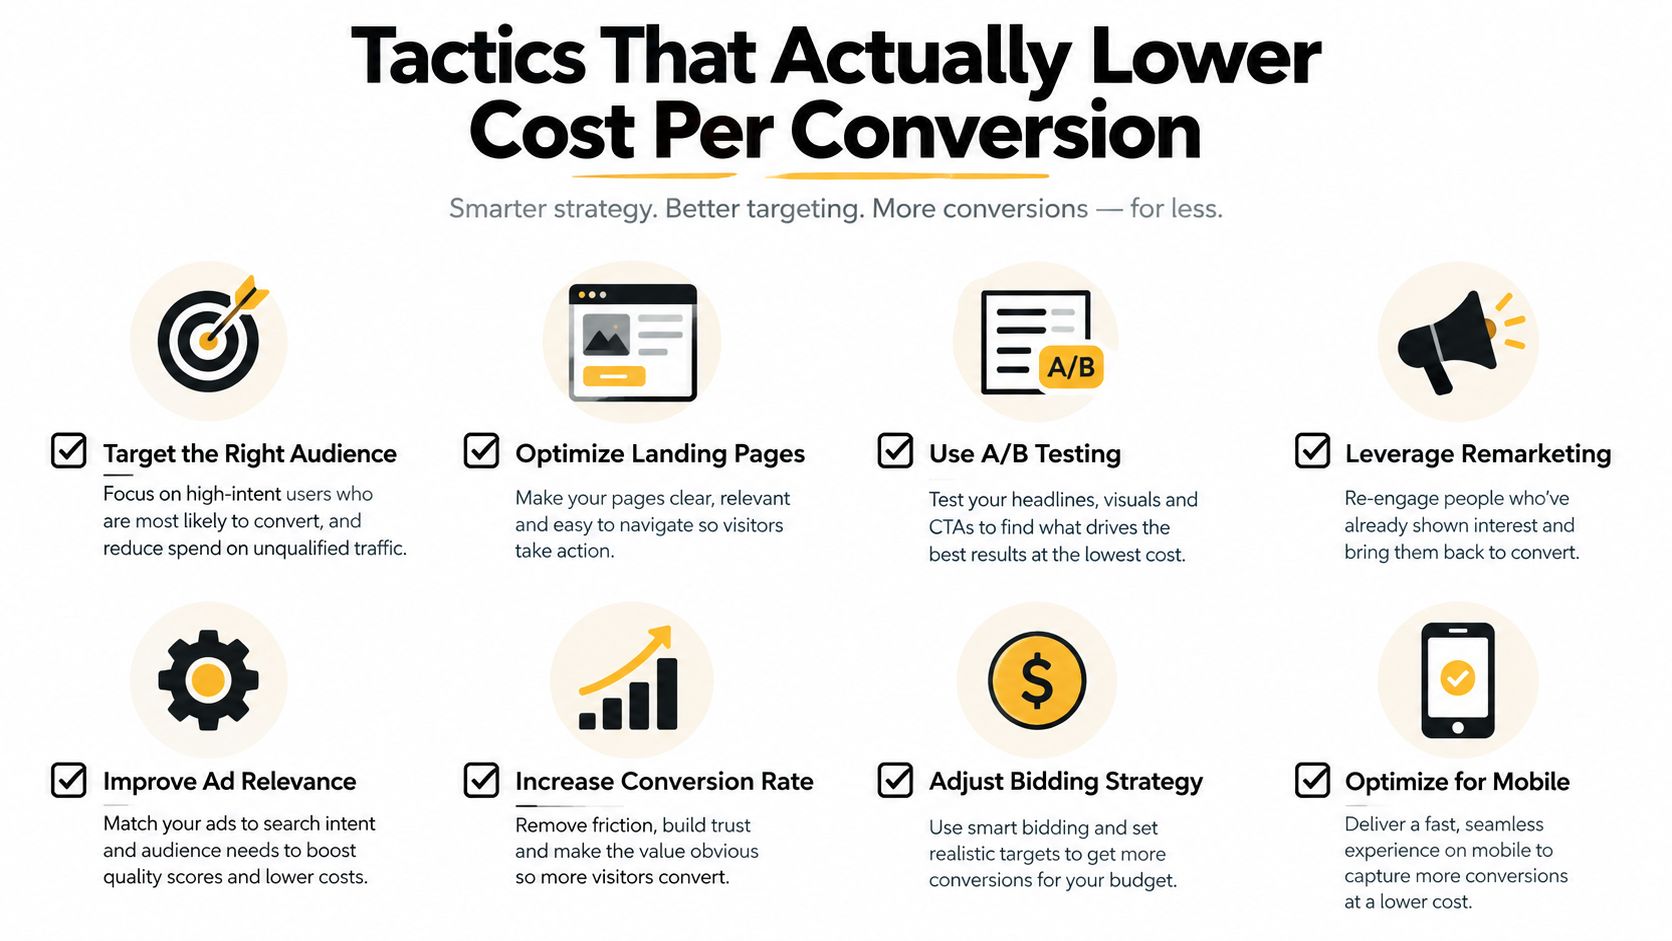
The fastest way to lower reported cost per conversion is often to optimize toward easier actions. That can be useful for learning, but it becomes dangerous when the team stops checking qualified-lead rate, opportunity rate, customer acquisition cost, and revenue quality alongside the cheaper CPA.
Implementing Accurate Measurement With Attribution Tools
A lean team doesn't need a complicated measurement stack to begin. It needs one consistent path from spend to visit, from visit to conversion, and from conversion to qualified outcome.
Start by installing one lightweight tracking layer that records visits and preserves first-party identifiers. Connect those identifiers to web forms, chat conversations, phone or calendar bookings, signups, and payments. Standardize UTMs and campaign naming before launching new tests, because inconsistent labels create reporting gaps that no dashboard can repair.
Next, pass attribution fields into the CRM record. A lead should carry its original source, campaign, landing page, and relevant journey data into the stages that sales manages. When a salesperson marks the lead qualified, booked, won, or lost, that outcome should remain connected to the original acquisition event.
Close the optimization loop
The highest-value step is sending qualified outcomes back to ad platforms through server-side or offline conversion connections. Google Ads, Meta, and LinkedIn can then receive stronger signals than a raw form submission. The platform's optimization target becomes closer to a real customer, provided the business has defined and transmitted that stage consistently.
SourceLoop is one example of an attribution platform that captures visits and connects multi-touch journeys to conversions from forms, chats, calendar bookings, and payments. It also supports CRM synchronization with systems such as HubSpot, Salesforce, and Pipedrive, and can send qualified offline conversions to Google Ads, Meta, and LinkedIn. Teams evaluating implementation options can compare capabilities in this guide to conversion API tracking tools.
The tool matters less than the operating loop:
- Spend is recorded against a defined campaign.
- Every visit receives a usable source identity.
- Each conversion carries its acquisition context.
- Qualification and revenue outcomes return to reporting and ad platforms.
- Budget decisions use commercial outcomes, not only platform totals.
That loop also exposes disagreements between platforms and the CRM. Instead of hiding the discrepancy, treat it as a diagnostic for consent coverage, duplicate handling, attribution windows, and offline process quality.
A Measurement Maturity Ladder You Can Self-Assess
Many teams can locate themselves on a simple four-level ladder. The point is not to adopt the most advanced model immediately. The point is to know which missing connection currently limits budget decisions.
Level 1
At Level 1, the team uses last-click reporting and one blended cost per conversion number. The dashboard may be easy to read, but it can't distinguish a form fill from a qualified opportunity or show whether the same person converted more than once.
Level 2
Level 2 adds channel-level CPA, campaign naming, UTMs, and basic CRM source fields. Marketing can compare Google, Meta, LinkedIn, organic, and referral activity more consistently, although the reporting still depends heavily on the final touch and may stop before sales qualification.
Level 3
At Level 3, the team applies multi-touch attribution and segments conversion quality. Reports distinguish leads, qualified leads, booked meetings, opportunities, customers, and revenue where the data is available. The team can ask whether a channel creates valuable demand even when it doesn't receive the last click.
Level 4
Level 4 closes the feedback loop. Qualified outcomes flow back to advertising platforms through dependable offline or server-side connections, ideally without a long delay. Campaigns optimize toward outcomes that sales and finance recognize, rather than toward the easiest action to count.
Before approving new spend, ask three questions:
- Which conversion is being priced?
- How observable is that conversion across devices, channels, and offline interactions?
- What share of it becomes qualified pipeline, customers, and revenue?
Cost per conversion is a useful media-efficiency metric and a poor strategy metric when used alone. Treat it as the first number in a chain, then connect that chain to quality, acquisition, revenue, and profit.
Audit your current campaigns this week. Export spend and conversion data by channel, campaign, landing page, and conversion type, then join it to CRM qualification and customer outcomes. If the numbers don't connect, fix the tracking and feedback loop before increasing budget.

 Paid Social


