
Conversion Rate Benchmarks by Industry: 2026 Data Across All Channels
Compare your performance with 2026 conversion rate benchmarks by industry. Includes B2B, ecommerce, Google Ads, and Meta Ads data across 40+ industries.
Table of contents
- What Is a Conversion Rate?
- Ecommerce Conversion Rate Benchmarks by Industry
- Ecommerce Conversion Rates by Vertical (2026)
- Regional Variations in Ecommerce Conversion Rates
- B2B Conversion Rate Benchmarks by Industry
- B2B Website Conversion Rates (2026)
- Google Ads Conversion Rate Benchmarks
- Google Ads Conversion Rates by Industry (2025)
- Meta Ads (Facebook & Instagram) Conversion Benchmarks
- Meta Ads Conversion Rates by Industry (2025)
- What Influences Conversion Rate Benchmarks?
- How to Calculate Your Conversion Rate
- How to Improve Your Conversion Rate
- Optimize Your Landing Pages
- Leverage Social Proof
- Improve Page Speed
- Implement Exit-Intent Popups
- Optimize for Mobile
- A/B Test Continuously
- Track Attribution Accurately
- Conversion Rate Benchmarks by Traffic Source
- Setting Realistic Conversion Rate Goals
- The Bottom Line on Conversion Rate Benchmarks
- FAQ
- What is a good conversion rate?
- How do I calculate my conversion rate?
- What is a good ecommerce conversion rate?
- What is a good conversion rate for Google Ads?
- How much does a Google Ads conversion cost?
- How much does a Facebook Ads conversion cost?
- Why is my conversion rate low?
- How can I improve my website conversion rate?
- Do conversion rates vary by device?
- What's the purpose of the average conversion rate?
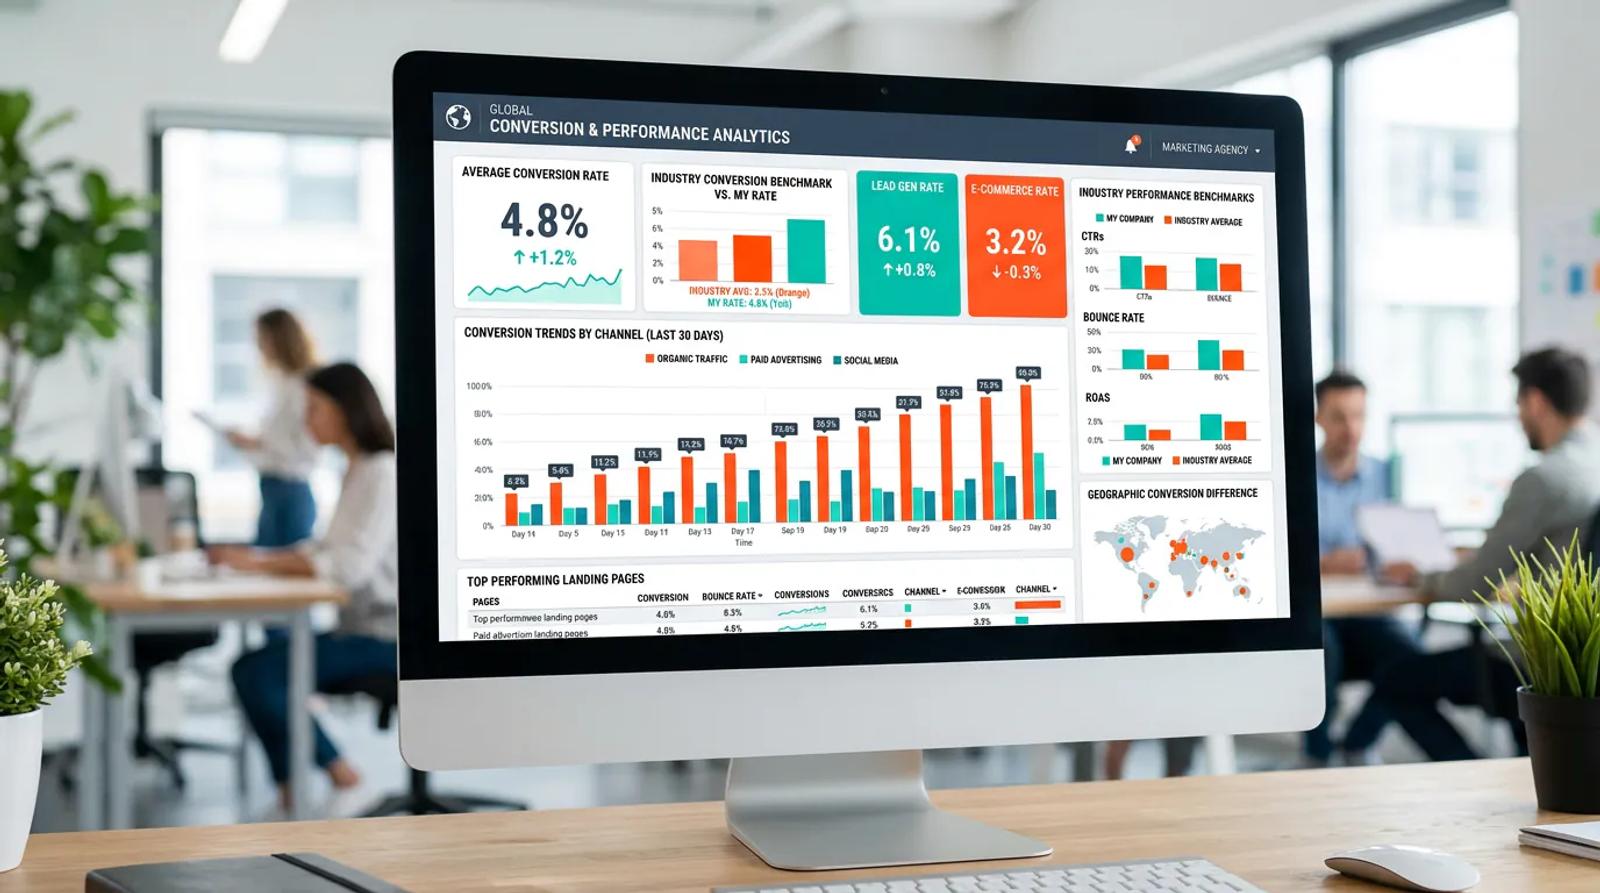
Conversion rate benchmarks vary dramatically by industry, ranging from 0.7% for luxury jewelry to 18.25% for restaurants in 2026. Understanding where your business stands against industry averages is critical for setting realistic goals, allocating marketing budgets effectively, and identifying optimization opportunities.
What Is a Conversion Rate?
A conversion rate measures the percentage of website visitors who complete a desired action, making a purchase, filling out a form, booking a demo, downloading content, or subscribing to a service. The formula is straightforward:
Conversion Rate = (Total Conversions ÷ Total Visitors) × 100
For example, if your website receives 10,000 visitors and 250 submit a contact form, your conversion rate is 2.5%. This metric reveals how effectively your website, landing pages, and marketing campaigns turn traffic into measurable business results.
Conversion rate optimization matters because improving your conversion rate directly impacts revenue without requiring additional traffic spend. A B2B SaaS company that increases its conversion rate from 1% to 2% effectively doubles its lead volume from the same traffic source.
Ecommerce Conversion Rate Benchmarks by Industry
Ecommerce conversion rates vary significantly by product category, purchase consideration time, and average order value. Dynamic Yield reports a global ecommerce benchmark of 2.66% as of 2026, while Statista shows industry-specific variations.
Ecommerce Conversion Rates by Vertical (2026)
Industry | Average Conversion Rate
Food & Beverage | 5.29% - 6.22%
Beauty & Personal Care | 4.71% - 4.94%
Pet Care & Veterinary Services | 4.34%
Multi-Brand Retail | 3.28% - 3.93%
Fashion, Accessories & Apparel | 2.81%
Consumer Goods | 2.60%
Home & Furniture | 1.20%
Luxury & Jewelry | 0.70%
Food and beverage consistently leads ecommerce conversion rates because purchases tend to be lower-consideration, repeat purchases with immediate gratification. Beauty and personal care products follow closely, benefiting from strong brand loyalty and subscription models.
Furniture and luxury jewelry sit at the bottom because these categories involve high-consideration purchases with longer research cycles. Customers typically visit multiple sites, compare options extensively, and delay purchase decisions. According to Propel Commerce, a 1.2% conversion rate for furniture is actually solid performance given the typical customer journey length.
Regional Variations in Ecommerce Conversion Rates
Conversion rates also vary by geography. The Americas witnesses the strongest ecommerce conversion rates at 2.74%, followed by EMEA at 2.72%, and APAC at 1.64%. These regional differences reflect factors like payment method availability, shipping expectations, mobile commerce adoption, and local competition.
Device type matters too. Tablet users convert at 2.88%, mobile users at 2.75%, and desktop users at 2.47%. The tablet advantage likely stems from the combination of larger screen real estate with the comfort and leisure of mobile browsing.
B2B Conversion Rate Benchmarks by Industry
B2B conversion rates typically run lower than ecommerce because the sales cycle is longer and involves multiple decision-makers. First Page Sage analyzed data from January 2022 through August 2025 across 25 B2B industries, revealing significant variation.
B2B Website Conversion Rates (2026)
Industry | Average Conversion Rate
Legal Services | 7.4%
HVAC Services | 3.1%
Staffing & Recruiting | 2.9%
Higher Education & College | 2.8%
Real Estate | 2.7%
Industrial IoT | 2.6%
Oil & Gas | 2.5%
PCB Design & Manufacturing | 2.4%
Manufacturing | 2.2%
Addiction Treatment | 2.1%
Construction | 1.9%
Financial Services | 1.9%
Pharmaceutical | 1.9%
Solar Energy | 1.8%
Biotech | 1.8%
Commercial Insurance | 1.7%
Heavy Equipment | 1.7%
Medical Device | 1.6%
IT & Managed Services | 1.5%
Transportation & Logistics | 1.4%
Environmental Services | 1.3%
Engineering | 1.2%
B2B SaaS | 1.1%
Software Development | 1.1%
Legal services dominate B2B conversion rates at 7.4% because legal needs often arise from urgent situations requiring immediate consultation. People searching for legal help typically have high intent and are ready to convert quickly.
B2B SaaS and software development companies see lower conversion rates (1.1%) due to longer evaluation cycles, multiple stakeholders, and complex buying processes. However, these businesses compensate with higher customer lifetime value and longer retention periods.
According to Ruler Analytics, professional services average 6.1%, marketing & advertising agencies convert at 6.2%, and real estate businesses see 2.8% conversion rates.
Google Ads Conversion Rate Benchmarks
Google Ads conversion rates have improved year-over-year, with the cross-industry average reaching 7.52% in 2025, up from 6.96% in 2024. WordStream analyzed millions of conversions to establish these benchmarks.
Google Ads Conversion Rates by Industry (2025)
Industry | Average CVR | Average Cost Per Lead
Automotive - Repair, Service & Parts | 14.67% | $28.50
Animals & Pets | 13.07% | $31.82
Physicians & Surgeons | 11.62% | $56.83
Education & Instruction | 11.38% | $90.02
Personal Services | 9.74% | $53.52
Dentists & Dental Services | 9.08% | $83.93
Beauty & Personal Care | 7.82% | $60.34
Automotive - For Sale | 7.76% | $38.86
Sports & Recreation | 7.62% | $47.47
Home & Home Improvement | 7.33% | $90.92
Industrial & Commercial | 7.17% | $85.63
Restaurants & Food | 7.09% | $30.27
Health & Fitness | 6.80% | $62.80
Travel | 5.75% | $73.70
Business Services | 5.14% | $103.54
Attorneys & Legal Services | 5.09% | $131.63
Arts & Entertainment | 4.84% | $30.27
Career & Employment | 4.33% | $62.80
Apparel / Fashion & Jewelry | 3.99% | $101.49
Shopping, Collectibles & Gifts | 3.83% | $47.94
Real Estate | 3.28% | $100.48
Furniture | 2.73% | $121.51
Finance & Insurance | 2.55% | $83.93
Automotive repair services lead Google Ads conversion rates at 14.67% because car problems create urgent needs. When someone searches for brake repair or an oil change, they're ready to book immediately. The low cost per lead ($28.50) reflects this high conversion efficiency.
Conversely, attorneys and legal services show a 5.09% conversion rate but the highest cost per lead at $131.63. Legal services involve longer sales cycles and higher customer lifetime value, justifying the investment in more expensive conversions.
The finance and insurance industry sits at the bottom with 2.55% conversion rates and $83.93 cost per lead. These businesses face longer consideration periods and intense competition, driving up costs while suppressing conversion rates.
Meta Ads (Facebook & Instagram) Conversion Benchmarks
Meta Ads lead campaigns average 7.72% conversion rates across industries, slightly outperforming Google Ads. The platform's targeting capabilities and lead form functionality make it particularly effective for certain verticals.
Meta Ads Conversion Rates by Industry (2025)
Industry | Average CVR | Average Cost Per Lead
Restaurants & Food | 18.25% | $3.16
Attorneys & Legal Services | 10.53% | $18.17
Education & Instruction | 10.08% | $28.22
Real Estate | 9.53% | $16.61
Arts & Entertainment | 9.34% | $18.17
Industrial & Commercial | 9.34% | $37.34
Personal Services | 6.51% | $30.57
Dentists & Dental Services | 6.38% | $76.71
Career & Employment | 5.77% | $17.64
Health & Fitness | 5.63% | $52.98
Sports & Recreation | 5.48% | $19.30
Beauty & Personal Care | 5.29% | $51.42
Home & Home Improvement | 5.22% | $41.26
Physicians & Surgeons | 4.51% | $47.47
Furniture | 3.77% | $40.04
Restaurants and food businesses dominate Meta Ads with an 18.25% conversion rate and remarkably low $3.16 cost per lead. Facebook's local targeting and visual nature make it ideal for promoting restaurants, and users browsing social media are often in a discovery mindset for dining options.
Education and legal services perform well on Meta Ads (10.08% and 10.53% respectively) thanks to Facebook lead ads, which enable frictionless form completion without leaving the platform. This format works particularly well for top-of-funnel lead generation.
What Influences Conversion Rate Benchmarks?
Several factors explain why conversion rates vary so dramatically across industries:
Purchase consideration time: Low-consideration purchases like restaurant reservations or pet supplies convert faster than high-consideration purchases like furniture or legal services. The longer someone needs to research and compare options, the lower the typical conversion rate.
Average order value: Higher-priced items naturally have lower conversion rates. Someone buying a $20 t-shirt requires less deliberation than someone purchasing a $2,000 sofa. According to Fyresite, furniture conversion rates of 0.8-1.5% are normal given the high consideration nature.
Sales cycle length: B2B purchases involving multiple stakeholders and approval processes will always convert more slowly than impulse buys. Enterprise B2B converts at 0.5-1.5%, while mid-market B2B reaches 1.5-3%, reflecting these differences.
Number of decision-makers: B2C purchases typically involve one or two people, while B2B purchases may require approval from five or more stakeholders. Each additional decision-maker adds friction and lowers conversion rates.
Market maturity and competition: Saturated markets with intense competition typically see lower conversion rates as customers have more options and take longer to decide. Emerging categories with less competition often convert better.
Traffic source quality: Email traffic converts at 19.3%, while paid search converts at 10.9%. Referral traffic, organic search, and direct visits each carry different intent levels, affecting conversion performance.
How to Calculate Your Conversion Rate
Before comparing yourself to benchmarks, calculate your current conversion rate accurately. The formula is simple, but implementation requires careful tracking.
First, identify your primary conversion goal. For ecommerce sites, this is typically a completed purchase. For B2B companies, it might be form submissions, demo requests, or phone calls. For lead generation businesses, it's typically contact form completions or consultation bookings.
Next, determine your measurement timeframe. Most businesses track monthly conversion rates for consistency, though weekly or quarterly views provide additional context.
The calculation:
- Count total conversions during the period (e.g., 250 form submissions)
- Count total unique visitors during the same period (e.g., 10,000 visitors)
- Divide conversions by visitors: 250 ÷ 10,000 = 0.025
- Multiply by 100 to get the percentage: 0.025 × 100 = 2.5%
Tools like Google Analytics track this automatically once you've configured conversion goals. For complete attribution visibility across your marketing channels, SourceLoop connects website conversions to their original sources, revealing which campaigns and channels drive the highest conversion rates.
How to Improve Your Conversion Rate
Knowing your industry benchmark is just the starting point. The real opportunity lies in optimization. Top performers reach 11.45% conversion rates according to Digital Applied, showing significant room for improvement regardless of industry.
Optimize Your Landing Pages
Landing pages represent your first conversion opportunity. Clear, focused pages convert better than generic ones. Start with these fundamentals:
Write compelling headlines that match search intent. If someone searches for "commercial insurance quotes," your headline should immediately confirm they're in the right place.
Remove navigation to eliminate distractions. Every link away from your conversion goal reduces conversion rates. Dedicated landing pages without header navigation convert 10-20% better.
Use trust signals prominently. Client logos, industry certifications, security badges, and customer testimonials build credibility. According to First Page Sage, insufficient trust validation is among the most common conversion killers.
Create clear, benefit-driven CTAs. "Get Started" and "Submit" are weak. "Book My Free Consultation" or "Download the Guide" tell users exactly what happens next.
Test your forms. Long forms create friction, but extremely short forms may not qualify leads effectively. Test form length, field labels, and required vs. optional fields to find your sweet spot.
Leverage Social Proof
Social proof messages create urgency and validate purchase decisions. Displaying messages like "147 people viewed this product today" or "Only 3 rooms left at this price" taps into psychological triggers that boost conversions.
Customer reviews and ratings directly impact conversion rates. Products with reviews convert 270% better than products without reviews. Encourage satisfied customers to leave feedback and display ratings prominently on product pages.
Case studies work particularly well for B2B conversions. Showing how similar companies solved problems using your solution reduces perceived risk and demonstrates real-world value.
Improve Page Speed
Page load time directly impacts conversion rates. A one-second delay in page load time can reduce conversions by 7%. Mobile users are especially sensitive to speed issues, with 53% abandoning pages that take longer than three seconds to load.
Use tools like Google PageSpeed Insights to identify performance bottlenecks. Common fixes include compressing images, enabling browser caching, minifying CSS and JavaScript, and using a content delivery network (CDN).
Implement Exit-Intent Popups
Exit-intent technology detects when users are about to leave your site and triggers a last-chance offer. These popups can recover 10-15% of abandoning visitors when executed well.
Effective exit popups offer genuine value rather than just repeating your main CTA. Discounts, free shipping, downloadable resources, or exclusive content work best. Keep the design clean and the value proposition clear.
Optimize for Mobile
Mobile traffic represents over 60% of web traffic but typically converts at lower rates than desktop. Closing this gap is critical for overall conversion performance.
Ensure your site uses responsive design that adapts to different screen sizes. Buttons should be large enough to tap easily (at least 44×44 pixels). Forms should minimize typing with features like autofill and dropdown menus.
Test your mobile checkout process end-to-end. Many businesses lose mobile conversions due to awkward payment flows, difficult form completion, or unexpected shipping costs revealed late in the process.
A/B Test Continuously
Conversion rate optimization requires ongoing experimentation. A/B testing lets you compare variations scientifically to determine what actually improves conversions.
Test one element at a time for clear results: headlines, CTA button colors, form placement, image choices, or pricing presentation. Run tests long enough to achieve statistical significance, typically at least two weeks with sufficient traffic.
Tools like Optimizely, VWO, and Google Optimize make A/B testing accessible to businesses of all sizes.
Track Attribution Accurately
You can't optimize what you don't measure. Understanding which marketing channels, campaigns, and keywords drive conversions enables smarter budget allocation.
SourceLoop captures customer journeys from first click through conversion and revenue, revealing exactly which touchpoints contribute to conversions. This visibility helps you double down on what works and eliminate what doesn't.
For B2B businesses with longer sales cycles, tracking lead source through your CRM ensures you can attribute closed deals to their original marketing source, not just the last touch.
Conversion Rate Benchmarks by Traffic Source
Beyond industry, conversion rates vary significantly by traffic source. Understanding channel-specific benchmarks helps set appropriate expectations and identify optimization priorities.
Email traffic: 19.3% average conversion rate. Email subscribers are warm leads who've already expressed interest, making this your highest-converting channel.
Paid search: 10.9% average conversion rate. Search ads capture high-intent traffic actively looking for solutions, driving strong conversion performance.
Organic search: 5-10% average conversion rate depending on keyword intent. Informational queries convert lower while transactional queries convert higher.
Social media: 2-5% average conversion rate. Social traffic is often in discovery mode rather than purchase mode, resulting in lower immediate conversions but stronger top-of-funnel awareness.
Display advertising: 0.5-1% average conversion rate. Display ads excel at brand awareness and remarketing but typically don't drive immediate conversions from cold traffic.
Referral traffic: 5-8% average conversion rate. Traffic from trusted third-party sites often converts well due to the implied endorsement.
These channel differences reinforce why multi-touch attribution matters. A social media ad might not convert directly but could introduce someone who later converts through search or email. Understanding the complete journey prevents undervaluing important touchpoints.
Setting Realistic Conversion Rate Goals
Industry benchmarks provide useful context, but your specific goals should account for your business model, market position, and growth stage.
Start by calculating your current baseline across a consistent timeframe. If you're currently at 1.5% and your industry average is 2.5%, reaching the industry average represents a 67% improvement opportunity.
Set incremental goals rather than dramatic jumps. Improving from 1.5% to 1.8% (a 20% relative increase) is more achievable than immediately targeting 3%. According to First Page Sage, lifting conversion rates by 0.5-1% in six months represents solid CRO performance.
Consider your traffic quality when setting goals. A site generating 80% organic search traffic might reasonably target higher conversion rates than one relying heavily on cold display traffic.
Factor in seasonal patterns. Ecommerce conversion rates typically spike during Q4 holiday shopping, while B2B rates often dip in summer and December. Year-over-year comparisons provide more meaningful insights than month-over-month changes.
The Bottom Line on Conversion Rate Benchmarks
Conversion rates vary from 0.7% to 18% depending on your industry, traffic sources, and sales cycle. Understanding these benchmarks helps you set realistic goals, but remember that industry averages include poor performers alongside excellent ones.
Top-performing websites consistently beat industry averages through relentless testing, optimization, and customer experience improvements. Whether you're at 1% or 10%, there's room to improve.
Focus on the factors you can control: page speed, mobile experience, trust signals, form friction, and message clarity. Track your sources accurately with tools like SourceLoop so you understand exactly what's working and can allocate budget accordingly.
The businesses that win aren't necessarily those with the highest traffic, they're the ones that convert their traffic most effectively.
FAQ
What is a good conversion rate?
A good conversion rate depends on your industry and traffic sources, but generally:
- Ecommerce: 2-4% is average, 5%+ is excellent
- B2B websites: 2-3% is solid, 5%+ is exceptional
- Google Ads: 7-10% is good, 10%+ is excellent
- Meta Ads: 8-12% is strong, 15%+ is exceptional
Top performers in any industry can reach 10-15% conversion rates through continuous optimization.
How do I calculate my conversion rate?
Divide total conversions by total visitors, then multiply by 100. For example: (250 conversions ÷ 10,000 visitors) × 100 = 2.5% conversion rate. Use Google Analytics or your CRM to track these metrics automatically.
What is a good ecommerce conversion rate?
The global ecommerce average is 2.66%, but this varies by industry. Food & beverage averages 6.22%, beauty & personal care reaches 4.71%, while furniture and luxury jewelry average 1.2% and 0.7% respectively. A conversion rate above 3% puts you ahead of most competitors.
What is a good conversion rate for Google Ads?
The average Google Ads conversion rate is 7.52% across all industries. High-performing industries like automotive repair (14.67%) and animals & pets (13.07%) significantly exceed this average, while industries like finance & insurance (2.55%) and furniture (2.73%) fall below it.
How much does a Google Ads conversion cost?
The average cost per lead on Google Ads is $70.11, but this varies widely by industry. Restaurants & food average just $30.27, while attorneys & legal services average $131.63 per conversion. Higher costs often reflect higher customer lifetime values.
How much does a Facebook Ads conversion cost?
The average cost per lead on Meta Ads is $27.66. Restaurants & food achieve the lowest costs at $3.16, while dentists & dental services face higher costs at $76.71 per conversion. Meta Ads generally deliver cheaper top-of-funnel conversions than Google Ads.
Why is my conversion rate low?
Common causes include slow page load times, poor mobile experience, confusing navigation, weak trust signals, generic messaging, complicated forms, or mismatched traffic sources. Use A/B testing to identify and fix specific issues systematically.
How can I improve my website conversion rate?
Focus on landing page optimization (clear headlines, strong CTAs, trust signals), improve page speed, simplify forms, implement exit-intent popups, leverage social proof, optimize for mobile, and continuously A/B test changes. Track results with conversion tracking software to measure impact.
Do conversion rates vary by device?
Yes. Tablet users convert at 2.88%, mobile at 2.75%, and desktop at 2.47% on average. However, mobile represents the majority of traffic, making mobile optimization critical despite slightly lower conversion rates.
What's the purpose of the average conversion rate?
Average conversion rates provide benchmarks for evaluating your performance, setting realistic goals, identifying optimization opportunities, and allocating marketing budgets. However, focus more on improving your own conversion rate over time rather than merely matching industry averages.



 Paid Social


