
Marketing Attribution Models That Actually Work
Compare marketing attribution models, their pros and cons, and how to choose the right one for your team's measurement and budget decisions.
Google Ads claims the win. Meta claims the same win. Your CRM shows fewer paying customers than both platforms combined, and finance wants one number it can trust by Friday. That argument isn't a reporting glitch. It's what happens when teams treat marketing attribution models as truth machines instead of credit rules. Pick the model that matches how your customers buy, give every other method a separate job, and you'll stop defending fantasy totals in budget meetings.
Table of Contents
- Why Attribution Is the Hardest Conversation in Marketing
- What an Attribution Model Actually Does
- The Six Common Models and What Each One Buys You
- How Data-Driven Attribution Actually Works
- Why Attribution Is Not a Causality Engine
- A Measurement Operating System That Puts Each Model in Its Job
- What Your Model Choice Does to Your Budget
- Choosing Your First Model Without Regret
Why Attribution Is the Hardest Conversation in Marketing
You've lived this meeting. Google Ads says it drove 40 conversions, Meta claims 32, TikTok adds another 18, and your payment system shows a smaller pool of real customers than the platforms claim together. Nobody's necessarily lying. Each platform counts inside its own window, with its own identity rules, and happily takes credit for a conversion another platform also claims.
That overlap is the core problem marketing attribution models exist to manage. A buyer hears you mentioned somewhere, reads a comparison page on a phone, clicks a retargeting ad at work, talks to sales, then buys direct weeks later. Someone has to decide how credit gets split across that journey, because budget will follow whatever answer you publish.
Why the argument keeps getting worse
Privacy restrictions break the visible path. Consent gets denied, app activity doesn't connect cleanly to web activity, and walled gardens limit what leaves their reporting. Longer sales cycles make it worse, because the touch that created demand can sit far outside a platform's lookback window while the final click looks heroic.
Audio exposes the gap brutally, since a listener can hear an episode, remember the brand, and search days later without a click to log. If you run podcasts, this podcast attribution model guide is useful context for why listen-through influence rarely shows up as a neat session.
Stop asking which platform is telling the truth. Ask which question each number was built to answer.
Finance doesn't need five competing truths. It needs a stated rule for credit, a clear line between reported and incremental conversions, and honesty about uncertainty. You'll never get one perfect number from fragmented journeys. You can get a defensible system, and that's what protects budget.
Your takeaway in 30 seconds: choose models by job, not by fashion. Journey diagnostics, budget allocation, and causal proof are different jobs. Force one model to do all three and it will fail at least two of them, usually in the meeting where it matters most.
What an Attribution Model Actually Does
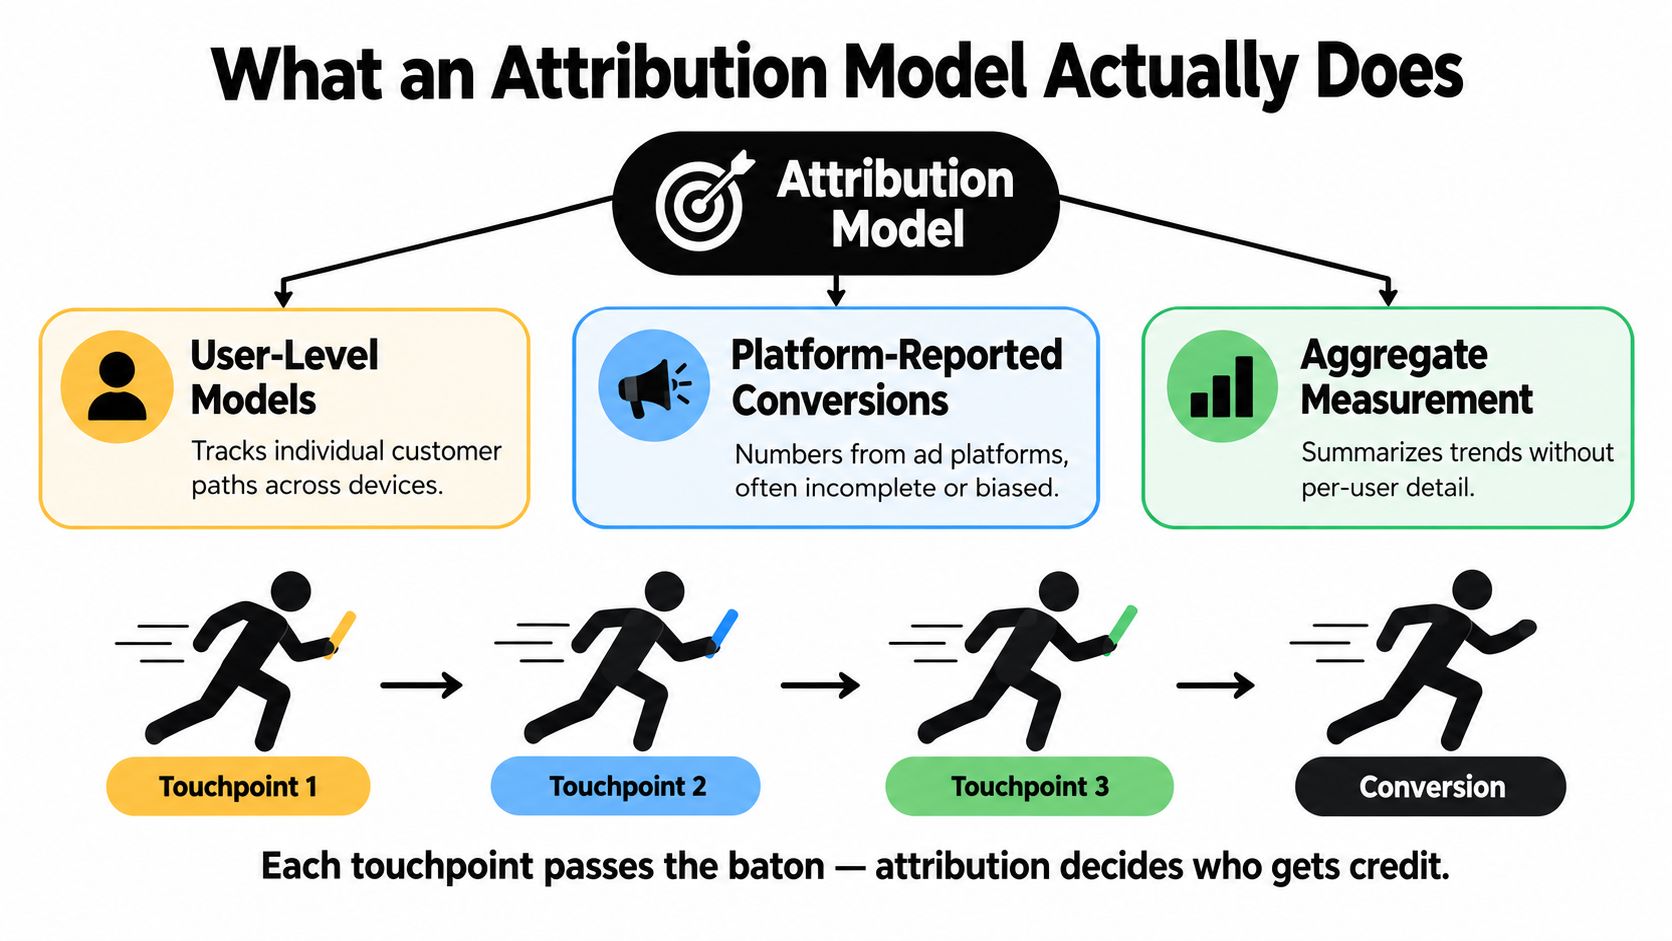
An attribution model is a credit allocation rule. It takes the touchpoints you can observe before a conversion and decides how to divide value among them. It doesn't reconstruct the full human decision, and it doesn't know what happened in a Slack thread, a sales call nobody logged, or a buyer's head.
Use a relay race. Four runners move the baton toward conversion. First-touch awards the medal to runner one, last-touch gives it to runner four, and multi-touch models split it across the team by some rule. The race happened either way. The model only decides who gets rewarded, which is why model choice becomes budget policy.
Three things people constantly confuse
- User-level models: These follow individual paths across sessions and devices where identity is available, so they're strong for journey diagnostics and weak wherever tracking breaks.
- Platform-reported conversions: These are ad platforms grading their own homework inside their own windows, useful for in-platform optimization and dangerous as a company-wide revenue ledger.
- Aggregate measurement: This looks at spend and outcomes in total without stitching every person, which makes it better for broad budget questions and useless for naming the exact ad that preceded a specific deal.
This split has deep roots. Media mix modeling emerged in the 1950s as a top-down method using aggregate sales and media spend, while last-click later became a web analytics default because it was simple to implement and explain, as traced in the history of marketing attribution models and measurement methods. Simplicity won adoption. It didn't win accuracy.
Single-touch versus multi-touch
Single-touch models give everything to one interaction. They're clean, fast, and wrong in predictable ways on any multi-step journey. Multi-touch models distribute credit across several interactions, which fits real buying better but demands richer identity, event, and conversion data.
Don't pick a lens because a dashboard defaults to it. Pick it because you know what behavior it will fund next quarter.
The Six Common Models and What Each One Buys You
Treat these six marketing attribution models as tools with built-in biases. Every one encodes an opinion about what matters in a journey. Your job is knowing that opinion before you let it move money.
First-touch gives all credit to the first recorded interaction. It rewards discovery and tells you which channels start journeys. It also pretends nurturing, retargeting, and sales conversations contributed nothing, so it will overfund broad awareness if you use it as your primary budget model.
Last-touch, usually last-click, gives 100% of conversion credit to the final recorded interaction. It's still the default habit in plenty of stacks because it's easy. It systematically rewards bottom-of-funnel capture, brand search, direct visits, and retargeting, even when those touches harvested demand that other channels created. Use it to see what closes. Never use it alone to decide what to cut.
Linear splits credit equally across every touchpoint. That's fair in the weakest sense. A passing display impression gets the same weight as a demo, so linear works as a neutral baseline and fails as a sharp budget signal.
Time-decay gives more credit to touches closer to conversion. That fits journeys where recent activity signals real intent, and it softens last-click's brutality. The catch is the decay assumption. Set it wrong and you erase the early work that made the late touches possible.
Position-based, often U-shaped, emphasizes the first and last touches and splits the remainder across the middle. It protects both discovery and closing, which is why many B2B teams find it intuitive. The middle still gets treated crudely, so an important webinar can be underweighted just because it was not a bookend.
Data-driven attribution lets observed paths set the weights instead of a fixed rule. It's the most flexible option here and the easiest to oversell. For a deeper side-by-side treatment of multi-touch variants in practice, this guide for modern marketers is a solid companion read.
Attribution Models at a Glance
| Model | Credit Rule | Best For | Watch Out For |
|---|---|---|---|
| First-touch | All to first touch | Discovery analysis | Ignores nurturing and closing |
| Last-touch | All to last touch | Closing-touch diagnostics | Starves demand creation |
| Linear | Equal split | Neutral baseline | No signal about influence |
| Time-decay | More to recent touches | Intent-heavy late journeys | Sensitive to decay settings |
| Position-based | Heaviest on first and last | Clear start-to-close journeys | Crude middle weighting |
| Data-driven | Modeled from path data | Higher-volume programs | Needs scale and clean inputs |
Read your current reporting against that table. Many teams discover they're not running the model they think they're running. They're running whatever their analytics tool, CRM, and ad platforms defaulted to, then arguing about strategy on top of mismatched rules.
How Data-Driven Attribution Actually Works
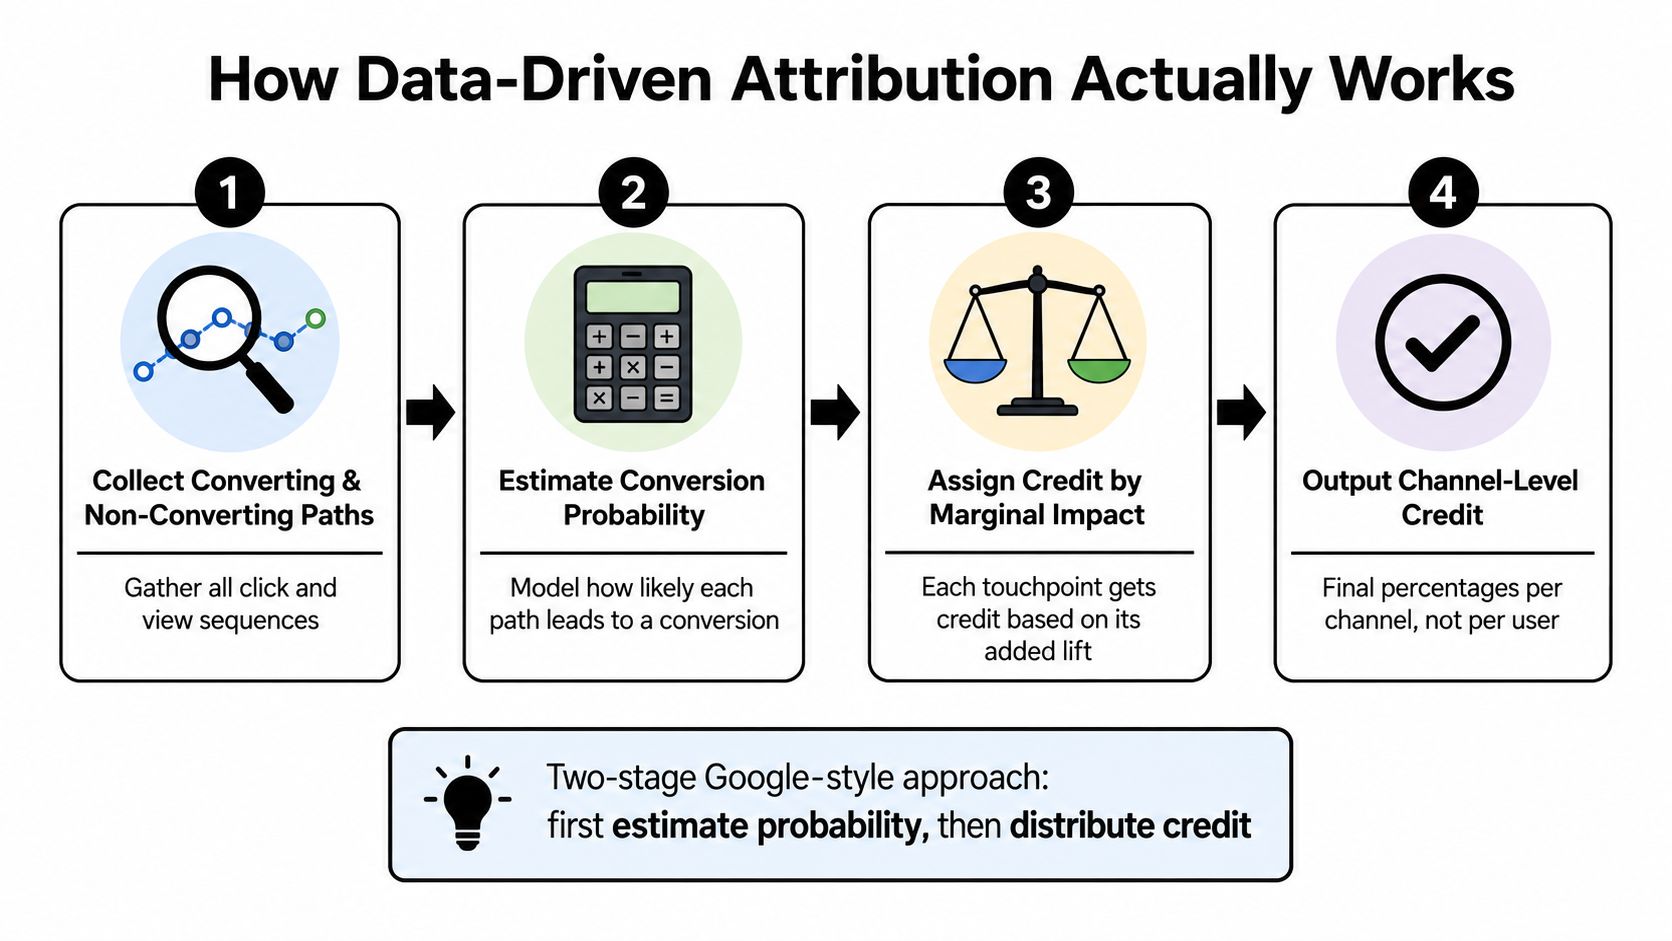
Data-driven attribution isn't magic and it isn't a fixed formula. It's a probabilistic, path-based model. Instead of declaring that the first or last touch deserves a preset share, it estimates how much each interaction changes the probability that a path converts, then allocates fractional credit from those estimates.
The two-stage mechanism
Google describes a two-stage method where the system first estimates conversion-rate models from converting and non-converting paths, then uses those predictions to allocate fractional credit to individual ad interactions, as set out in Google Ads guidance on data-driven attribution requirements and modeling. The model can factor in time to conversion, device type, number and order of exposures, and creative type.
That comparison set is the whole game. Preserve non-converting journeys. If you only feed the model winners, it can't tell which touches separate converters from everyone else. It will learn what's common among buyers, which is not the same as what helped cause buying. Dropping non-converters creates selection bias and destroys the baseline.
When it's still guessing
Google recommends at least 200 conversions and 2,000 ad interactions within 30 days for its Ads data-driven models, per that same guidance above. Treat that as a floor, not a badge of reliability. Long cycles, sparse channels, and mixed conversion types need more. A qualified lead, a booked meeting, and closed revenue are different outcomes, so evaluate them separately instead of blending them into one noisy target.
Outbound makes the data problem obvious, because a reply that matters may follow touches no pixel ever saw. If email is a major channel for you, these cold email attribution models explained notes help translate the same path logic to sequences and replies.
Practical rule: if your volumes are thin, a transparent rule-based model you understand beats a data-driven model that's quietly hallucinating weights from sparse paths.
Data-driven earns trust when you have volume, stable definitions, and clean conversion feedback. Without those, it's a confident guess wearing a lab coat.
Why Attribution Is Not a Causality Engine
Here's my contrarian position after rebuilding this more than once. Attribution assigns credit. It does not prove causation. A model can show that buyers who saw a touch converted more often. It cannot, by itself, prove they'd have stayed away without it. Brand search is the classic trap. High-intent buyers click it right before buying, the model applauds, and budget floods into capturing people who were already coming.
The evidence backs skepticism. A 2026 systematic review synthesized 108 studies published from 2010 through 2026 and found that deep-learning attribution can improve predictive accuracy but remains causally unidentified unless supported by experimental calibration, according to the systematic review of attribution, media mix modeling, and causal calibration. Prediction is not proof. A model that's great at spotting likely buyers may be great at spotting intent that already existed.
Privacy makes modeled precision weaker, not stronger
That same review reported that differential-privacy techniques reduced precision by 2% to 33% depending on the privacy budget, while federated approaches retained approximately 90% to 95% of centralized-model performance in documented deployments, per the review linked above. Read that plainly. Privacy-preserving measurement has real costs, and pretending your modeled output is exact is how teams walk into finance meetings unarmed.
- Use attribution for direction: Spot journey patterns, compare paths, and find channels that consistently appear before valuable outcomes.
- Use experiments for proof: Holdouts and incrementality tests answer whether spend caused lift, which is the question budget decisions turn on.
- Use triangulation for defense: When attribution, experiments, and aggregate reads point the same way, you've got a case. When they disagree, you've found your next test.
This is also where measurement discipline beyond channel credit matters, and our breakdown of advertising effectiveness measurement covers how to judge whether activity worked at all before arguing over shares. Bring attribution output to a budget meeting as one input. Bring experimental evidence as your closer.
A Measurement Operating System That Puts Each Model in Its Job
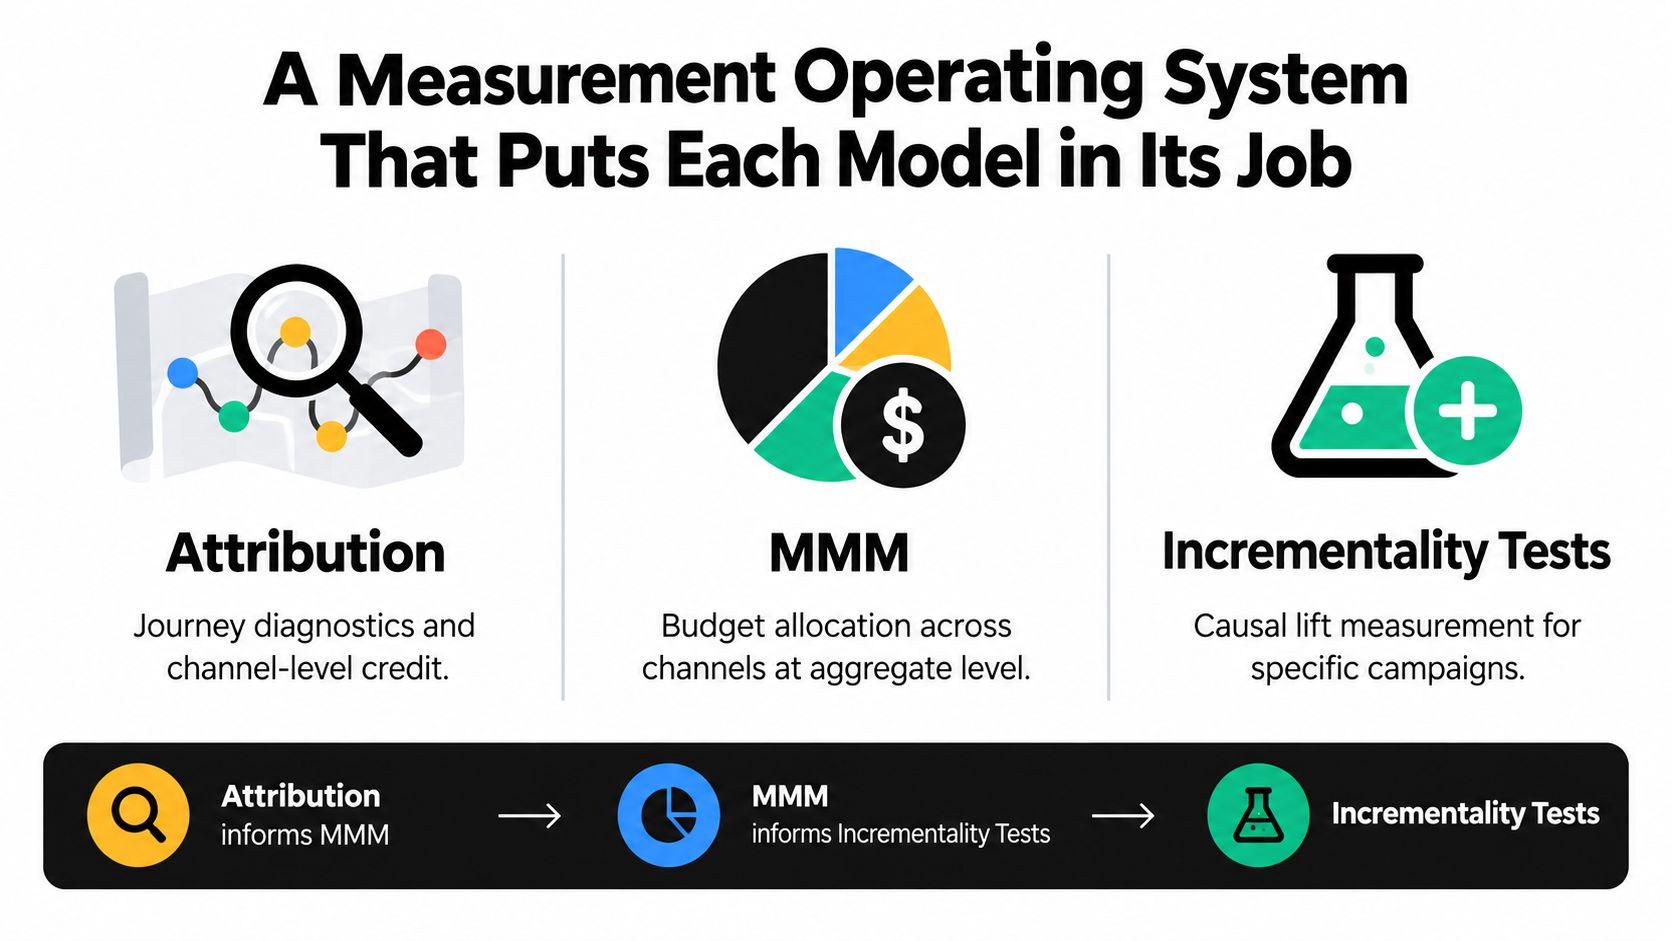
Stop forcing attribution, MMM, platform reporting, and incrementality tests to compete for one crown. They're not rivals. They're roles in a measurement operating system, and the fights start when you ask one of them to do another's job.
The need is obvious in survey data. 49.5% of surveyed marketers cited fragmented data as the main reason they question measurement accuracy, 48% cited cross-channel deduplication problems, and 40.8% cited walled-garden reporting limitations, according to survey reporting on marketing measurement confidence and data fragmentation. More dashboards won't fix that. Clear job assignments will.
Assign each method one job
| Method | Its Job | What It Should Never Decide Alone |
|---|---|---|
| Multi-touch attribution | Journey diagnostics and channel-level credit on observed paths | Whether spend caused incremental revenue |
| MMM | Aggregate budget allocation when identity is incomplete | Which exact touch preceded a specific deal |
| Incrementality tests | Causal validation on your biggest spend lines | Day-to-day path diagnostics |
| Platform reporting | In-platform optimization signals | Company-wide deduplicated revenue truth |
That hierarchy matches where confidence already sits. 30.1% of U.S. marketers consider MMM the best method for identifying business-value drivers, compared with 11.7% for third-party multitouch attribution, per the survey reporting linked above. That's not an insult to multi-touch. It's a reminder that aggregate budget questions deserve aggregate methods.
Run it like this. User-level marketing attribution models work on consented first-party data and CRM outcomes, so they explain visible journeys. MMM covers planning when identity breaks, using spend and outcome patterns at aggregate level. Experiments settle the expensive arguments. When the methods disagree, don't average them into mush and don't hide the gap. Report the range, name the likely reason, and let the size of the spend decide how much proof you need before acting.
Closing the loop between marketing touches and real revenue outcomes is what makes the user-level layer worth anything, which is the focus of our guide to closed-loop attribution. Without revenue feedback, your operating system optimizes for whatever event is easiest to count.
Finance doesn't need false certainty. Give executives a primary read, a validation read, and an uncertainty range, and you'll get more trust than any single decimal point ever bought you.
What Your Model Choice Does to Your Budget
Model choice is budget choice. Change the rule and you change which channels look efficient, which teams hit target, and which programs survive the next planning cycle. Teams that treat this as an analytics setting get blindsided by their own reallocation.
The visual below makes the funding consequences of four common rules easy to compare at a glance.
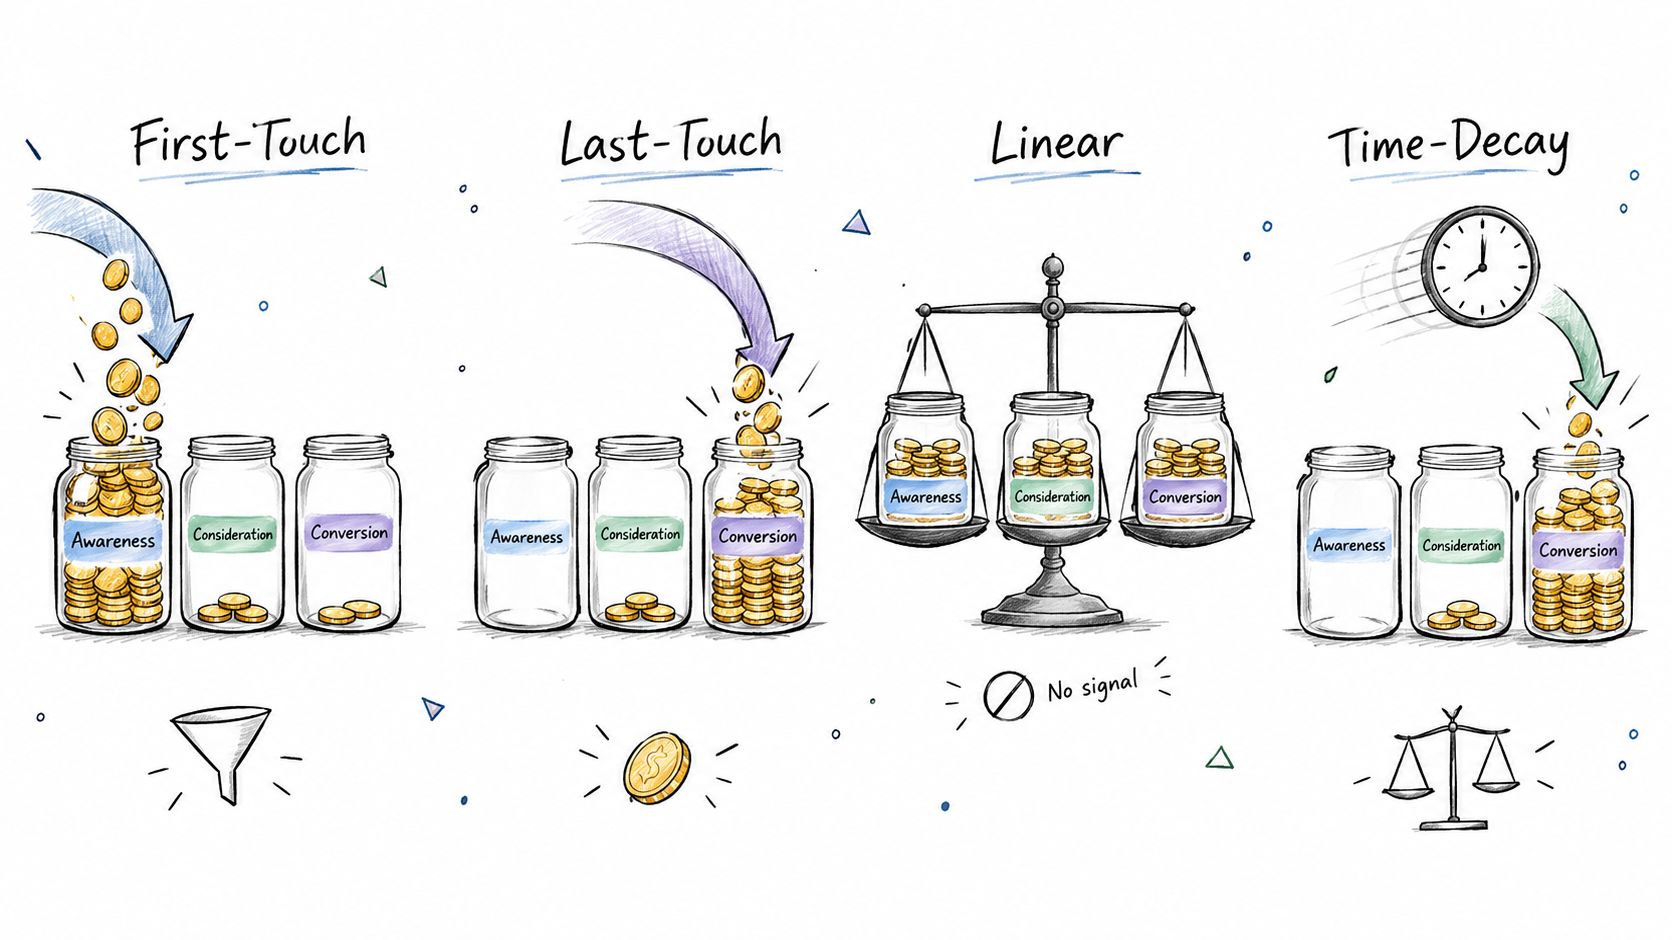
First-touch overfunds awareness and can keep weak top-of-funnel spend alive because it started journeys that anything might have started. Last-touch starves the top and feeds closers until pipeline thins out. Linear protects everybody and therefore prioritizes nobody. Time-decay favors late-stage touches, position-based protects the bookends, and data-driven shifts money toward modeled lift, which is only as good as the data underneath it.
Now layer in broken visibility. 74% of surveyed marketers said privacy regulations create costly measurement gaps, while only 18% were very confident they could match app installs to the correct source, according to reporting on marketer trust in attribution under privacy constraints. When the path is partially dark, a model doesn't just misallocate credit among visible touches. It can defund the invisible work entirely.
The video below walks through how these budget distortions play out when teams switch models without changing anything else.
My recommendation is blunt. Pair your chosen model with server-side conversion sync back to ad platforms, a contacts hub tied to your CRM, and re-injection of qualified outcomes so algorithms optimize toward revenue instead of form fills. SourceLoop is built for that workflow, capturing multi-touch journeys and syncing qualified conversions back to platforms like Google Ads and Meta. Whatever stack you use, that feedback loop matters more than another dashboard skin.
If you're weighing the user-level layer against aggregate planning directly, our comparison of multi-touch attribution vs marketing mix modeling lays out where each one should drive spend decisions. Pick consciously, because your budget already has.
Choosing Your First Model Without Regret
You don't need a six-month attribution program to make a better decision this week. You need a starting model matched to your volume, a second view to expose distortion, and a validation habit. Here's the path I'd give any lean team.
Match the model to your stage
- Under 100 monthly conversions: Run last-click and time-decay in parallel. You don't have the volume for fancy modeling, and the gap between those two views tells you how much last-click is distorting your read.
- 200+ conversions with clean UTMs: Move to position-based as your primary reporting model. It respects discovery and closing, stakeholders understand it, and it forces a real conversation about the middle.
- 2,000+ interactions over 30 days with stable CRM revenue feedback: Test a data-driven model alongside position-based, not instead of it. Promote it only when its weights stay stable and pass a sanity check against actual deals.
Whatever you pick, pair it with at least one quarterly incrementality test on a major spend line and one annual MMM read for aggregate planning. That combination keeps your primary model honest without turning measurement into a research department.
Quick answers to the questions you'll still get
How do we stay GDPR-compliant? Build on consented first-party data, honor consent choices in collection, and keep personal data handling documented. Don't stitch identities you have no lawful basis to stitch.
What about cookie consent loss? Expect thinner paths. Lean harder on CRM outcomes, server-side events where consent allows, modeled reads, and aggregate methods instead of pretending the missing journeys didn't exist.
Two platforms claim the same conversion. Who wins? Neither, in your company reporting. Deduplicate against your own conversion ledger, usually CRM or payment records, and let platform numbers stay inside platform optimization.
What does good look like when the model disagrees with finance? A stated credit rule, a reconciliation to actual revenue, and an uncertainty range you can explain. Agreement to the decimal is a fantasy. A transparent gap with a named cause is credibility.
Don't wait for perfect data. A rough model tied to real revenue, checked against one experiment, beats a beautiful last-click report that's been quietly cutting your pipeline for a year.
Start with the stage-matched model above, reconcile it to CRM revenue monthly, and revisit the choice only when volume or your sales cycle materially changes. That's a first move you can defend.
Ready to stop letting platform defaults set your budget? Set up SourceLoop to capture every multi-touch journey, tie signups, bookings, and Stripe payments back to their original channels, and sync qualified conversions to Google Ads, Meta, and LinkedIn so algorithms chase revenue instead of form fills. Start your free trial, install the snippet, and run your first model comparison on real deal data this week.

 Paid Social


