
Funnel Conversion Analysis: Find Where Revenue Leaks
Funnel conversion analysis explained: key metrics, how to read funnel reports, attribution pitfalls and which fixes to prioritize first.
You're looking at three dashboards before a budget meeting, and none of them agree. Every platform claims credit for sales you know you didn't make that many of, and your funnel report shows a big drop you can't explain. That's the normal starting point for funnel conversion analysis. It doesn't mean your data is useless. It means you need to separate what people did from what your tracking managed to record, then check whether a channel caused a sale or just happened to be nearby when it happened.
Table of Contents
- What a Conversion Funnel Actually Tracks
- Funnel Metrics and How to Calculate Them
- How to Read a Funnel Report Step by Step
- Conversion Benchmarks for Judging Your Numbers
- Attribution Models Compared Side by Side
- Separating Credit From Cause in Your Data
- Score Funnel Leaks Before Choosing a Fix
What a Conversion Funnel Actually Tracks
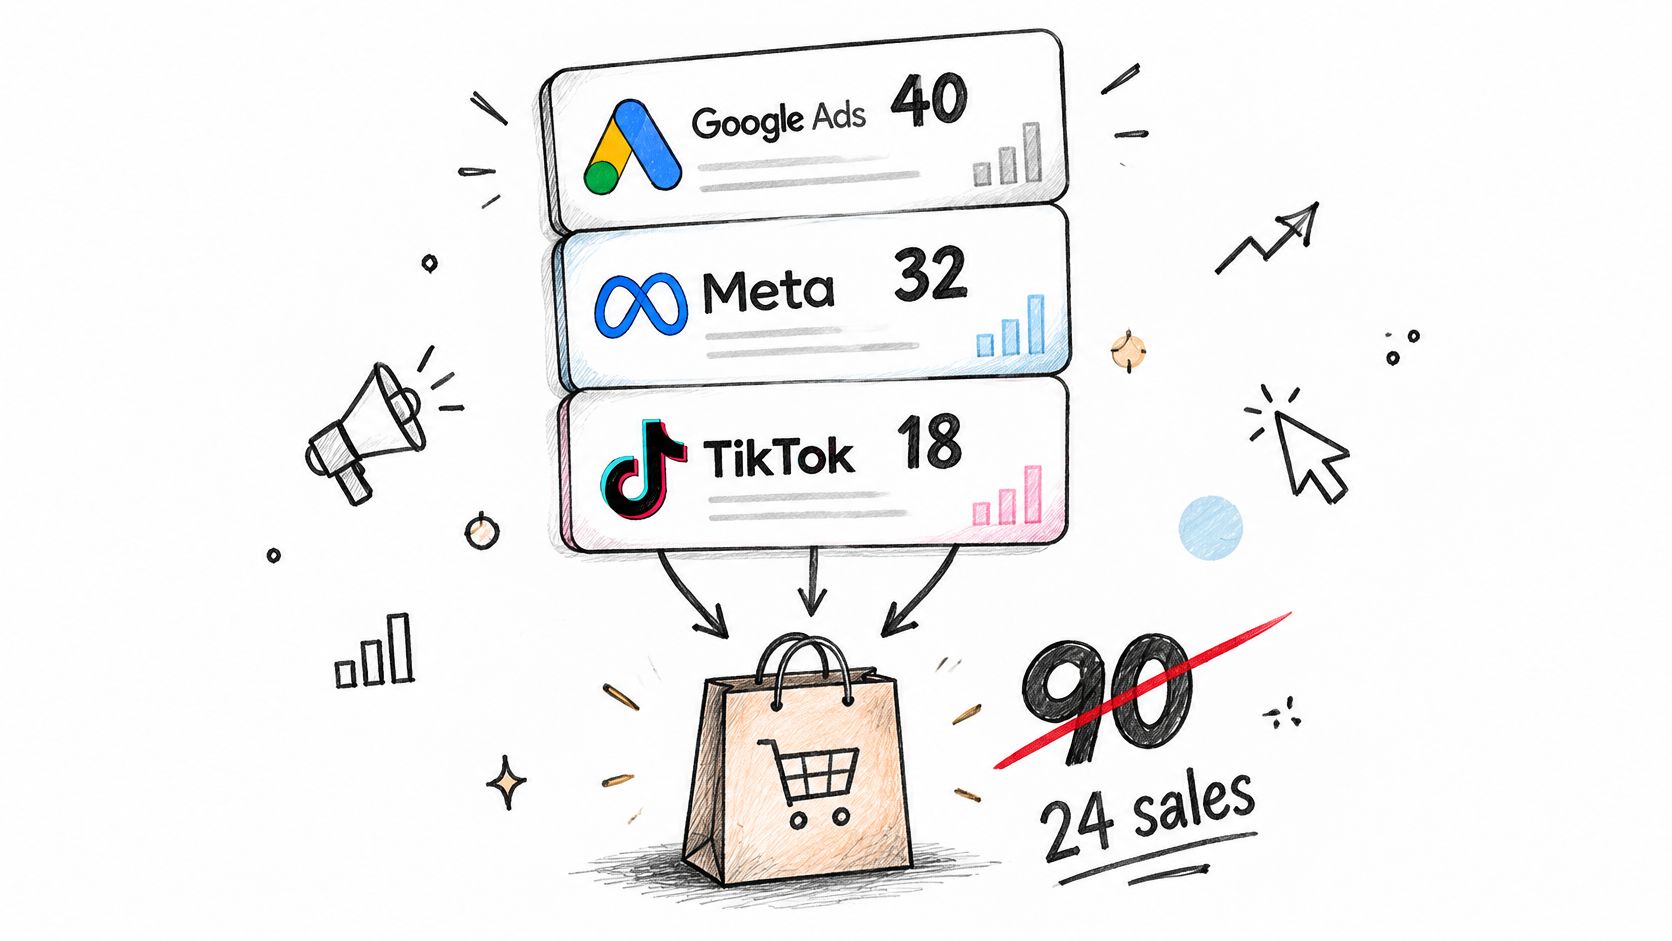
Google Ads reports 40 conversions, Meta reports 32, and TikTok reports 18, yet you have fewer real sales than those numbers added together. Each platform grades its own homework, using its own data and its own rules. The same buyer can be counted three times.
Funnel conversion analysis means measuring how many people move from one stage to the next, where they leave, and what changes the rate at each stage. Think of each stage as a sieve stacked above the next. You don't only check the water that reaches the bottom. You count what falls through each sieve, because that's where you'll see which one has the biggest holes.
Why the Straight Line Misleads
The traditional funnel drew customers moving in a straight line from awareness and familiarity to consideration, purchase, and loyalty. Many organizations still start with that picture because it's simple. Real buying doesn't follow it.
McKinsey's 2009 consumer decision research replaced the line with a circular journey of initial consideration, active evaluation, closure, and postpurchase experience. People add options while they evaluate, they don't only narrow them. Personal computer shoppers added an average of 1 brand to an initial set of 1.7 brands, and automobile shoppers added 2.2 brands to an initial set of 3.8. Two-thirds of touchpoints during active evaluation involved consumer-driven activities such as reviews, recommendations, store interactions, and memories of prior experience.
That matters for how you read any report. If you only measure the final step, or give credit to the last click, you'll miss the research, revisits, and referrals that shaped the decision earlier.
A funnel report shows where people leave. It doesn't show why they leave. Finding the why is the actual work.
Funnel Metrics and How to Calculate Them
Use this table as your map before you change anything.
| Stage | Metric | Formula | What a Drop Usually Signals |
|---|---|---|---|
| Visit or entry | Unique users entering the funnel | Count of unique users in the window | Traffic that does not match the offer |
| Engagement step | Step 1 rate | Users reaching step 2 divided by users at step 1 | Landing page message mismatch |
| Lead or signup | Visitor-to-lead rate | Leads divided by unique visitors | Form friction or a weak offer |
| Qualification | Lead-to-opportunity rate | Opportunities divided by leads | Poor-fit traffic or slow follow-up |
| Close | Opportunity-to-customer rate | Customers divided by opportunities | Pricing, proof or sales process gaps |
| Revenue | Revenue per visitor | Revenue divided by unique visitors | Converting users who buy low-value plans |
| Overall | End-to-end conversion | Final conversions divided by first-stage users | Summary only, not a diagnosis |
Two Counting Rules That Keep Rows Comparable
First, count unique users at each stage, not sessions. A session is one visit. A person who returns three times before buying is still one person, and counting visits inflates the top of the funnel and makes every rate below it look worse than it is.
Second, use one time window for every stage. A deal might open in week one and close in week six. If your window cuts off at week four, that customer vanishes from the close stage and looks like a loss. Pick a window long enough for a normal buyer to finish, then apply it everywhere.
The Two Ratios You'll Use Most
Stage-to-stage conversion locates the leak. Divide the users who reached a stage by the users at the stage before it. That tells you which single transition is weak, instead of leaving you with a vague sense that the funnel underperforms.
Revenue per visitor tells you whether a healthy-looking rate produces valuable customers. Divide revenue by unique visitors. A channel can convert well and still bring in buyers who pick the cheapest plan and leave quickly. The conversion rate won't show that. Revenue per visitor will.
End-to-end conversion is different. It's a summary, not a diagnosis. Knowing the overall rate fell tells you nothing about which stage to repair, so don't try to improve it directly. Improve a stage, and the summary follows.
When you sit down with this table, ask one question first. Which row fell compared with the same period last quarter? That row is where your investigation starts, because you're comparing like with like instead of reacting to a single month in isolation.
How to Read a Funnel Report Step by Step
Work through these steps in order. Each one protects you from a specific mistake.
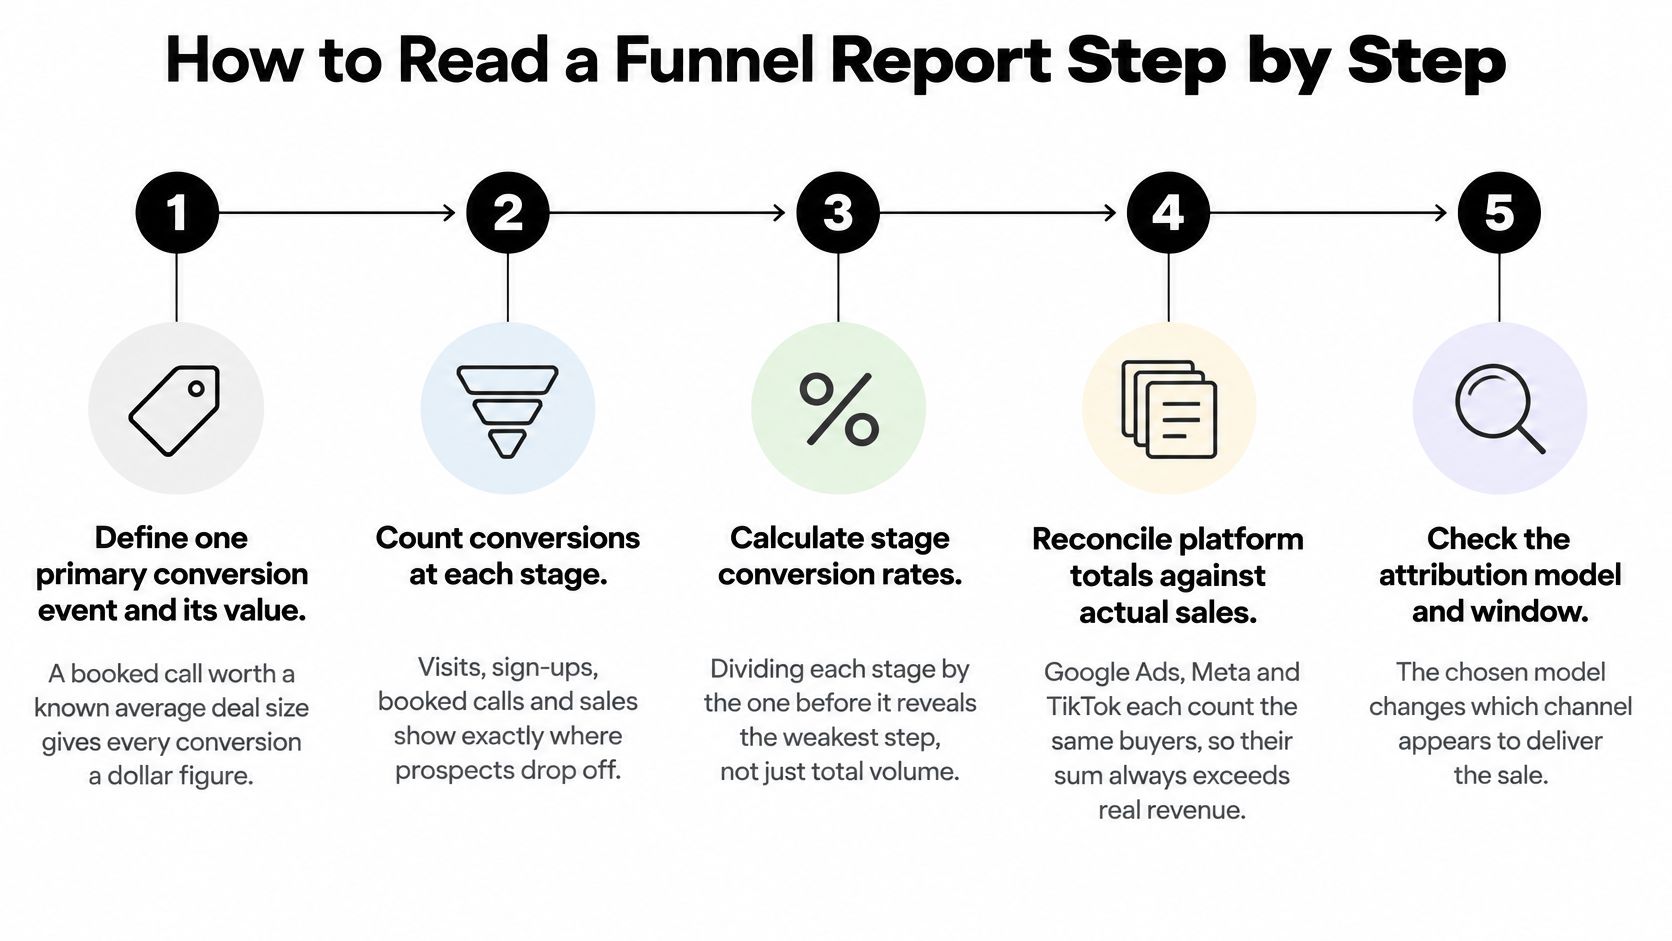
- Define one primary conversion event and its value. Pick a booked call, a trial start, or a purchase, and attach a known average value to it. Without a value, every leak looks equally important.
- Set the attribution window to match the buying cycle. The attribution window is how far back you look for touches that may have influenced a conversion. As an illustrative guide, impulse ecommerce often fits a short window of about 7 days, while B2B buying commonly needs 30 to 90 days.
- Lay out the stages and count unique users at each one. Use the stages from the metrics table. You're building one consistent path before you judge any part of it.
- Calculate each stage-to-stage rate and the end-to-end rate. The stage rates show where people leave. The end-to-end rate only confirms the overall result.
- Segment by traffic source, device, and landing page. A segment is a slice of users who share one trait. Treat any segment with fewer than about 100 users at a stage as noise, not a finding, because a handful of people can swing the percentage wildly.
- Compare against your own trend first, benchmarks second. Your history reflects your prices, audience, and offer. A published average reflects many businesses that may look nothing like yours.
- Check coverage before you trust a leak. Count users who skip steps, and measure how well your web records match your customer database. A drop can be a tracking gap rather than lost buyers.
A Worked Read
Take an illustrative funnel with 10,000 unique visitors. Suppose 2,000 reach step 2, 300 become leads, 45 become opportunities, and 9 become customers. The stage rates are 20%, 15%, 15%, and 20%, and end-to-end conversion is 0.09%.
Read the two 15% stages first. They're the weakest transitions, and they still have enough volume for you to act on. The 0.09% headline number tells you the funnel is thin overall, but it can't tell you whether to fix the form or the follow-up.
When a Leak Is Really a Measurement Gap
Beginners tend to get misled most often at this point. A funnel guide from Umami warns that when users jump straight from a homepage to signup or pricing, forcing every intermediate page into a linear funnel undercounts real conversions. Those people didn't drop off. They skipped a step you assumed they'd take.
The same problem appears offline. Companies rely on fragmented proxies such as QR codes, event attendance, point-of-sale tagging, dedicated phone numbers, and store-visit analytics instead of one consistent conversion record. So an apparent leak can reflect identity loss, consent restrictions, a slow CRM sync, duplicate contacts, or a sale that happened off the website.
Report these coverage figures beside every rate:
- Identity-match rate: how many web visitors you can match to a CRM record
- Time-to-sync: how long a conversion takes to appear in your CRM
- Duplicate rate: how many contacts exist more than once
- Path variants: how many users reached the goal by skipping a step
A trustworthy report shows its sample size, its window, and a coverage figure next to every rate. If yours doesn't, treat its biggest leak as a suspicion, not a conclusion.
Conversion Benchmarks for Judging Your Numbers
Suppose your checkout rate looks low beside a published average. Before changing the checkout, check whether the comparison matches your product, traffic, and funnel stage. A benchmark is a reference point, not a diagnosis.
| Benchmark | Reported Conversion Rate | Year |
|---|---|---|
| Global ecommerce average, IRP Commerce data reported by Develo Design | 1.7%, down from 1.76% in 2024 | 2025 |
| North America ecommerce average, Sobot | 3.4% | 2025 |
| Europe ecommerce average, Sobot | 3.2% | 2025 |
These are vendor-compiled ecommerce averages, not universal standards. Develo Design reports IRP Commerce's global figure of 1.7% for 2025, compared with 1.76% in 2024. Sobot reports regional averages of 3.4% for North America and 3.2% for Europe in its ecommerce conversion analysis. Treat the figures as broad context, since the sources compile data across businesses with different products and traffic.
Why Averages Are Reference Points, Not Targets
A site-wide rate cannot tell you whether a particular step is healthy. For stage-to-stage analysis, compare each step with your own past performance using the same event definitions, audience, and time window. A product-page-to-cart rate, for example, should be judged against your own product-page-to-cart history, not against an overall ecommerce average. If you find a relevant published stage benchmark, check that it measures the same step before comparing.
Averages also blend differences in price, product type, margins, repeat purchases, and traffic mix. A store with a lower conversion rate can still earn more if its orders have healthier margins or customers return. Seasonality can shift rates too, so one unusual month may not represent a lasting change.
For B2B, SaaS, or lead generation, use your own stage rates as the starting baseline. Track them over the previous 8 to 12 weeks, then compare with relevant conversion rate benchmarks by industry. Published ranges may help frame a question, but they do not prove why a stage changed.
Order of judgment: compare each stage with its own baseline, use relevant published averages as context, then validate what caused a change before moving budget.
Attribution Models Compared Side by Side
An attribution model is a rule for splitting credit for a conversion among the touches that came before it. The same journey produces different winners under different rules.
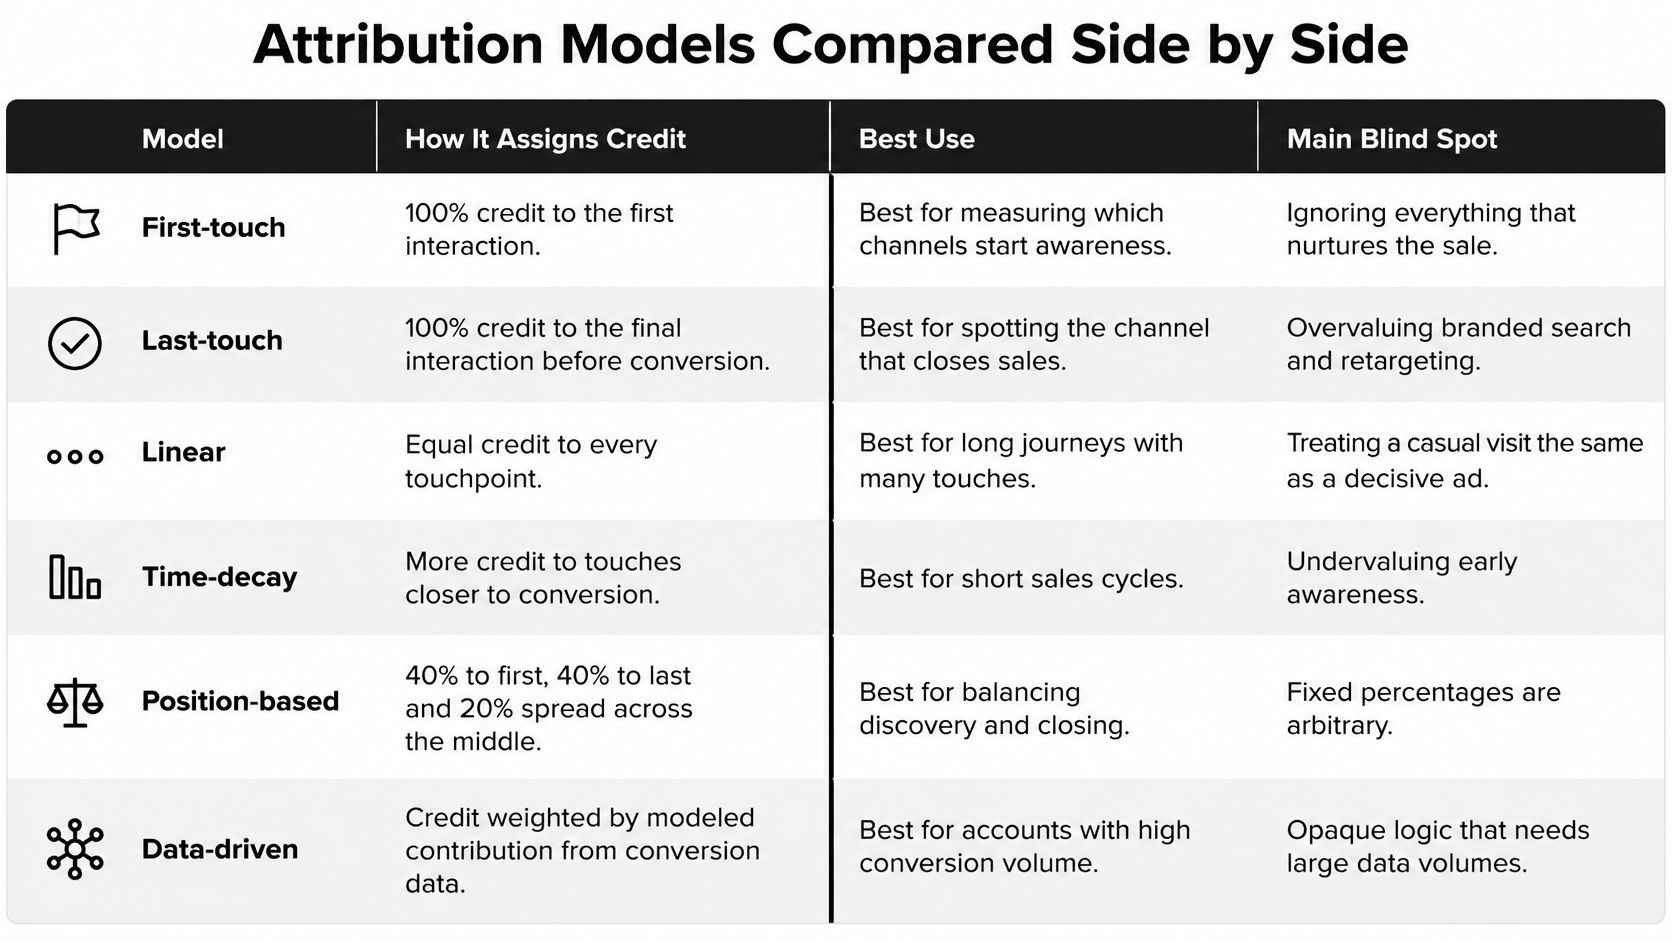
| Model | How It Assigns Credit | Best Used For | Main Blind Spot |
|---|---|---|---|
| First-touch | 100% to the first recorded touch | Finding channels that create demand | Ignores everything that closed the sale |
| Last-touch | 100% to the final touch before conversion | Judging closing efficiency | Over-credits branded search and retargeting |
| Linear | Equal share to every touch | Long journeys with many similar touches | Treats a trivial visit as equal to a demo request |
| Time-decay | More credit to touches closer to conversion | Short sales cycles with clear momentum | Underrates early awareness work |
| Position-based | Large shares to first and last touch, rest split across middle | B2B journeys with clear entry and close | Fixed weights are arbitrary |
| Data-driven | Credit learned from converting and non-converting paths | Large accounts with enough conversion volume | Opaque, and unreliable at low volume |
Three Criteria for Choosing
Journey length comes first. A purchase made in one or two touches makes last-touch acceptable, because there isn't much journey to share credit across. A B2B deal with many touches over months needs position-based or data-driven credit instead.
Data volume comes next. Data-driven models learn from your conversions, so they need a lot of them. A model trained on a few dozen conversions is guesswork dressed up as math, and a simple rule you can explain is more honest.
Your goal settles the rest. First-touch shows which channels create demand. Last-touch shows which channels close it efficiently. Neither answers the other's question, so pick based on the decision in front of you. If you want the deeper mechanics, read how marketing attribution models differ in practice.
The video below walks through how these rules change the story your data tells.
Platform totals still overlap because Google Ads, Meta, and TikTok each claim conversions from their own data. The fix is one shared conversion record that deduplicates across platforms. Tools such as SourceLoop let teams run several models on the same journey data, which makes the differences visible instead of theoretical. No model is correct. Choose the one whose blind spot matters least for the decision you're about to make.
Separating Credit From Cause in Your Data
Branded search exposes the gap clearly. Someone already wants your product, types your name into a search engine, clicks your ad, and buys. Last-touch gives that ad full credit. The ad looks like a star performer, but it mostly caught a person who was already coming.
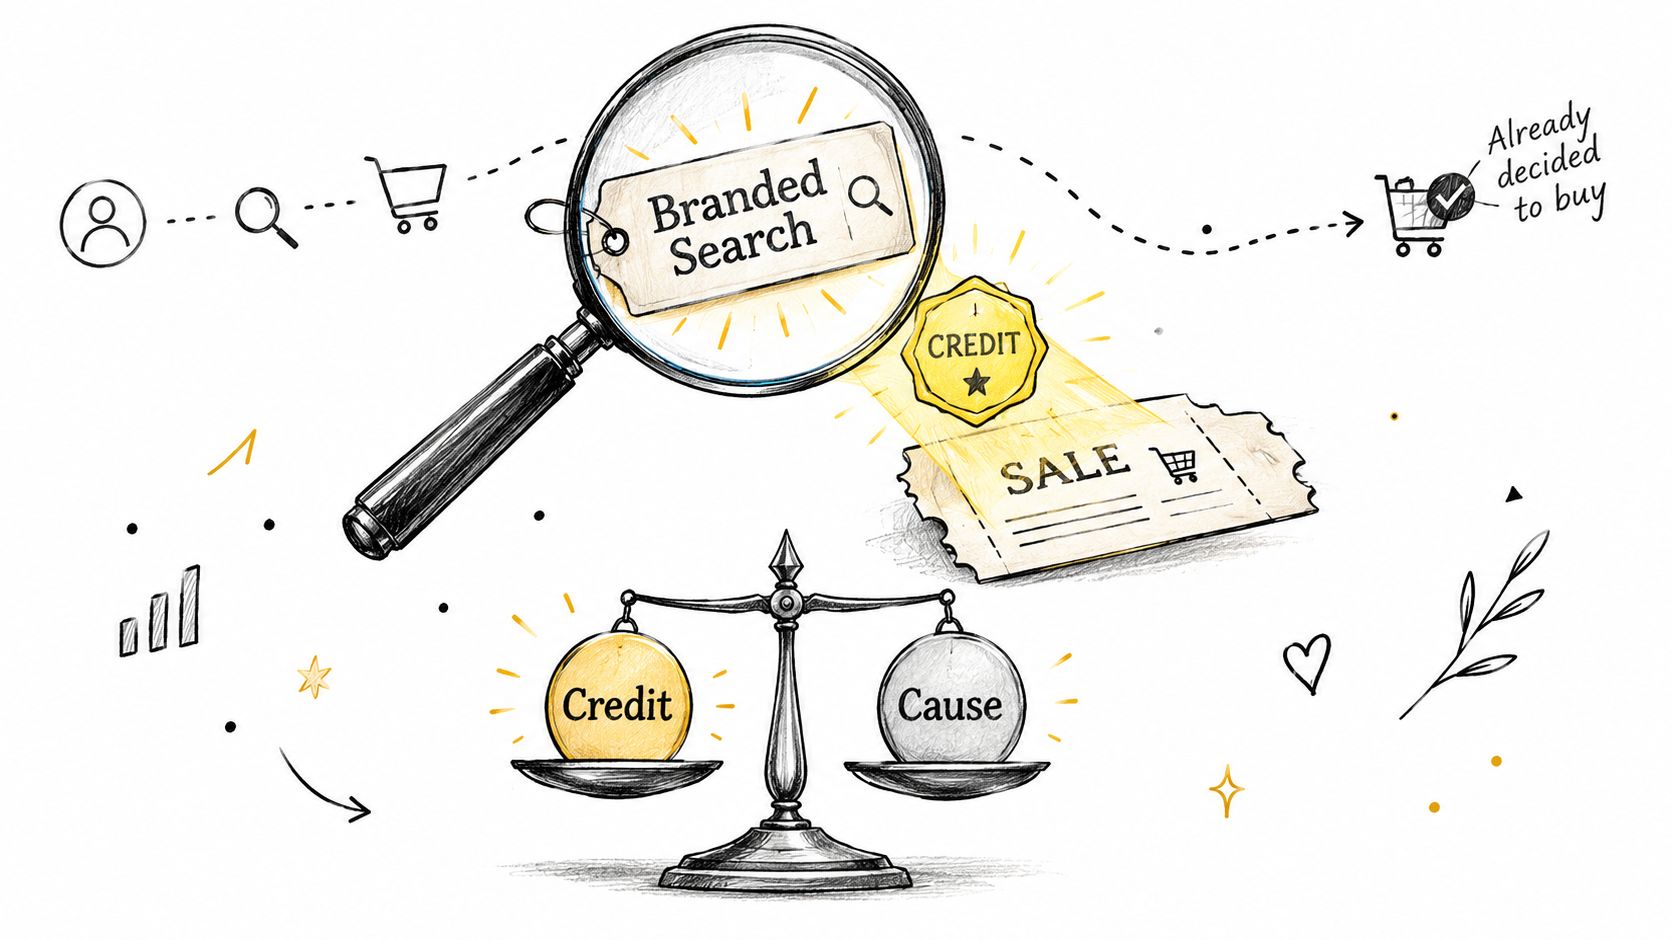
Credit means a touch appeared on a path that converted. Cause means the touch changed whether the conversion happened. Attribution can show you the first. It can't show you the second, because it never observes what would have happened without the campaign.
Recent measurement research on incrementality and multi-touch attribution makes this distinction directly. Multi-touch attribution identifies touchpoint patterns but can't establish the counterfactual. Incrementality testing can, because it compares exposed and unexposed groups.
Three Ways to Test the Difference
- Randomized holdouts: withhold ads from a random sample of users, then compare their conversion with the exposed group. This gives the cleanest answer, but you give up some reach on purpose.
- Geo experiments: pause spend in matched regions while other regions continue. This works well for broad campaigns, but regions are never perfectly alike.
- Matched-market comparisons: measure similar markets before and after a change. This needs no user-level tracking, though you must account for differences between markets.
A valid test needs enough volume to detect a real difference, a length that covers your buying cycle, and a success metric such as incremental revenue or qualified pipeline rather than reported conversions. Aggregate, geo-level methods also keep working as cookie limits and consent rules shrink individual tracking, because they don't depend on following one person.
Run a test when a channel holds a large share of attributed conversions and the budget decision would be expensive to reverse. Small channels with small stakes don't justify the effort. Big claims do.
Score Funnel Leaks Before Choosing a Fix
A funnel report can show that many visitors leave between two steps, but that count alone does not identify the best fix. Start by checking whether the drop reflects real behavior or a measurement gap. Then estimate the value of recovering those users and the work required to test a change.
McKinsey's research on the B2B customer decision journey reported results from organizations using a customer decision journey approach, including shifts of as much as 40% of marketing spending toward activities generating higher returns. The research also reported average sales increases of 5% to 10%, average customer-retention improvements of 30%, and one pilot with 8% to 10% higher revenue per bid than traditional efforts. These are results reported by the source, not guaranteed outcomes for another organization. The figures alone do not show that the approach caused the changes.
Score Each Leak Before You Fix Anything
For each weak stage, estimate the opportunity and check how trustworthy the measurement is:
- Users reaching the stage: the number of people who could leave at that point.
- Recoverable share: the portion you believe a change could realistically bring back.
- Value per conversion: the downstream value of one additional conversion.
- Monthly value at stake: users reaching the stage multiplied by recoverable share and value per conversion.
- Priority score: monthly value at stake divided by effort, then multiplied by a confidence score from 1 to 3.
Define effort in person-days: the estimated staff time needed to design, build, approve, and launch the change. Use the same unit across candidate fixes so the scores can be compared. The confidence score reflects how reliable the measurement is, not how certain you feel about the idea. Strong identity matching and a prompt CRM sync can support a higher score. Duplicate contacts or skipped tracking steps can justify a lower one, since a measurement gap may look like lost revenue.
Attribution can help identify which channels and touchpoints appear alongside valuable conversions. It assigns credit according to a chosen model, but that credit is not proof that a channel caused the sale. Before shifting budget, validate the result with a causal test, such as a randomized holdout or a suitable market comparison. Give more weight to a fix when the opportunity is valuable, the data is credible, and the proposed change can be tested.
One Worked Example
Suppose 2,400 monthly visitors leave between a pricing page and trial start. As an example, recovering 10% would add 240 trials. At an illustrative value of $25 per trial, the estimated monthly value at stake is $6,000.
That estimate is a way to compare opportunities, not a promise of revenue. A larger leak may rank lower if it requires a costly rebuild or depends on unreliable tracking. Value, effort, and confidence all matter. What conversion optimization involves explains the practice of identifying and testing changes to improve conversions, which is the next step after choosing a leak to investigate.
Choose one fix, define one test and one success metric, and set a review date four weeks away. Keep the original attribution view for comparison, but judge the result using a business outcome such as revenue, not clicks alone. Check whether the stage rate improved, and whether revenue per visitor moved in the same direction. If the result is flat, you still learn whether the proposed change addressed the suspected cause.
Prioritize the leak where a realistic recovery has meaningful value, the work is manageable, and the measurement is trustworthy.
Before launch, record the baseline rate, measurement window, and tracking coverage. After the test, compare the same measures over the same window. That discipline helps separate a real improvement from a temporary fluctuation or a change in how the funnel was counted.


 Paid Social


