
Cookie Deprecation Strategy: A Practical 2026 Guide
Build a cookie deprecation strategy that survives Chrome's phased rollout. Learn the models, pitfalls, and how to validate attribution in 2026.
60% of marketers said they were mostly or very ready for third-party cookie deprecation in 2024, down from 78% in 2022, according to Digiday's reporting on marketer preparedness. That decline says more than any countdown clock. Marketers aren't facing one clean switch-off date. They're rebuilding a measurement system while browser rules, consent behavior, and platform policies keep moving.
A durable cookie deprecation strategy starts with a harder question than “Which tracker replaces the cookie?” It asks which browsers lose credit, which devices create blind spots, which channels get undercounted, and which measurement methods can validate revenue when user-level paths become incomplete.
Google's July 2024 decision not to proceed with a full unilateral Chrome phaseout confirmed the danger of deadline-based planning. Third-party cookies remain available in Chrome, but that doesn't restore dependable cross-browser measurement. Safari and Firefox already block third-party cookies by default, and Chrome's rollout has followed controlled experimentation rather than one universal cutover. Teams that wait for a final deadline will keep making budget decisions from partial evidence.
Table of Contents
- Why the Deadline Mentality Is Already Wrong
- The Six Attribution Models You Need to Understand
- Choosing the Right Model for Your Funnel
- Two Real-World Journeys Under Cookie Loss
- Diagnosing Lost Revenue by Browser and Device
- Phased Implementation Without the Whiplash
- Why a Measurement Portfolio Beats a Single Tracker
- Your 2026 Cookie Deprecation Action Plan
Why the Deadline Mentality Is Already Wrong
The old plan was simple. Google would announce a date, Chrome would remove third-party cookies, and marketers would migrate before the deadline. That plan is obsolete.
Chrome announced a two-stage phaseout in June 2021. Stage 1 was expected to last nine months, while Stage 2 was originally planned to finish by late 2023. Chrome later restricted third-party cookies for 1% of users in January 2024, opened deprecation-trial applications on January 16, and extended temporary access for some sites through June 30, 2024. The trial ended December 27, 2024. Then, on July 22, 2024, Google said it wouldn't proceed with a full unilateral phaseout and would keep third-party cookies available while reworking Privacy Sandbox and privacy controls. The sequence is documented in Google's updated Privacy Sandbox timeline.
That reversal doesn't mean the risk disappeared. It means the risk became harder to summarize on a calendar. Browser experimentation, regulatory scrutiny, user choice, and advertising-industry readiness now shape the operating environment.
Practical rule: Build for reduced signal availability, not for a promised browser deadline.
The market's readiness data reinforces that point. Digiday reported that 75% of 257 U.S. marketers remained very or moderately reliant on third-party cookies in early 2024, while only 44% felt very prepared for deprecation. Separate survey data found that 76% of organizations had adopted at least one replacement solution by mid-2024, but adoption was still incomplete. The result is a fragmented stack, not a finished migration.
Browser status matters more than the countdown
Safari and Firefox already block third-party cookies by default. Chrome's transition has been uneven, and Edge introduces another environment to monitor. Your exposure depends on the browsers, devices, traffic sources, and conversion lags in your own funnel.
| Browser | Third-Party Cookies | Approx. Global Share | Notes |
|---|---|---|---|
| Chrome | Available, with phased policy changes and testing | Varies by market | Treat availability as conditional, not guaranteed |
| Safari | Blocked by default | Varies by market | Cross-site attribution requires first-party or modeled methods |
| Firefox | Blocked by default | Varies by market | Platform reporting can diverge from backend outcomes |
| Edge | Policy and configuration dependent | Varies by market | Include it in browser-level diagnostics |
The correct response is a rolling measurement-stack rebuild. First-party capture, consented identity, server-side events, experiments, and aggregate modeling each solve different parts of the problem. A deadline might change. A diagnostic process and validation discipline remain useful regardless.
The Six Attribution Models You Need to Understand
Attribution models are rules for distributing conversion credit across touchpoints. They don't restore missing data. They only interpret the touchpoints your stack can still observe.

Single-touch models
Last-click attribution gives all credit to the final measurable interaction before conversion. Think of it as the finish-line photographer. It records who appeared at the end, not who created demand.
Last-click is easy to implement and easy to explain, which is why teams keep using it. It systematically favors branded search, direct traffic, remarketing, and email when earlier discovery touches disappear.
First-click attribution gives all credit to the first recorded interaction. It's the door opener. This model helps answer which channels introduce prospects, but it ignores the work that moves them toward a decision.
Single-touch models are historical artifacts when journeys span multiple devices, browsers, and offline interactions. They can still support narrow diagnostic questions, but they shouldn't determine a large budget shift on their own.
Multi-touch rule-based models
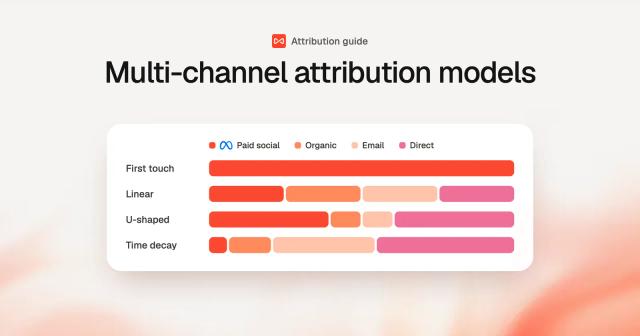
Linear attribution distributes credit evenly across recorded touchpoints. It's the equal-share committee. Linear is useful when you want every visible interaction represented, but it assumes each touch mattered equally.
Time-decay attribution assigns more credit to recent interactions. It's a fading flashlight that illuminates the touches closest to conversion. This often suits funnels where late-stage education, demos, product reviews, or offers strongly influence action.
Position-based attribution gives greater weight to the first and last recorded touches, with the remaining credit assigned to middle interactions. It's the bookend model. The opening touch explains demand creation, while the closing touch explains conversion momentum.
These models are transparent, but transparency doesn't equal truth. If a Safari visit, mobile interaction, or consent-restricted event never enters the dataset, the model distributes credit among the survivors.
Data-driven attribution
Data-driven attribution estimates contribution from observed patterns rather than a fixed rule. Shapley value methods evaluate the marginal contribution of touchpoints, while Markov-chain approaches examine how paths change when touchpoints are removed from a sequence.
It sounds more advanced, and it can be. But it still depends on accurate touchpoint capture, sufficient conversion evidence, and stable definitions. Cookie loss attacks the foundation before the model runs.
Use cross-channel attribution guidance to pressure-test channel definitions, event coverage, and revenue mapping before comparing model outputs.
No attribution model can compensate for a journey that your measurement stack never captured.
Choosing the Right Model for Your Funnel
The right model depends on the question your team needs answered. Don't pick the model with the most impressive label. Pick the one that matches your funnel, data coverage, and reporting maturity.
| Model | Effort | Accuracy Ceiling | Best Fit |
|---|---|---|---|
| First-click | Low | Low when journeys are long | Early demand and channel discovery |
| Last-click | Low | Low when assist channels matter | Operational campaign checks |
| Linear | Low to moderate | Moderate with complete paths | Broad journey visibility |
| Time-decay | Moderate | Moderate to high for late-stage funnels | B2B and considered purchases |
| Position-based | Moderate | Moderate to high when opening and closing touches matter | B2B SaaS and multi-step journeys |
| Data-driven | High | High only with strong coverage and volume | DTC and mature performance teams |
The practical default
For a typical B2B SaaS funnel, start with position-based attribution when both demand creation and the final demo or sales interaction matter. Use time-decay when late-stage touches clearly carry more decision weight and the buying cycle is long.
For a DTC brand with enough conversion activity to support reliable modeling, use data-driven attribution as the analytical layer, then validate it against experiments and backend revenue. If data coverage is weak, a complex model will only produce more confident-looking errors.
First-click and last-click still have jobs. Use first-click to inspect acquisition reach and last-click to inspect conversion capture. Don't use either as the sole basis for reallocating an entire channel budget.
Lock the model before reporting changes
Switching models in the middle of a quarter breaks historical comparability. A channel can appear to improve because the credit rule changed. Lock the model, document the reason, preserve the previous view for continuity, and annotate the change in every executive report.
Attribution is a hypothesis generator, not the financial system of record. Finance should reconcile revenue through the CRM, billing platform, and booked outcomes. Marketing should use attribution to decide what to test next, then use incrementality or controlled comparisons to determine whether the spend caused the outcome.
Two Real-World Journeys Under Cookie Loss
Consider a B2B SaaS prospect whose visible path includes a LinkedIn ad, two retargeting display impressions, a gated whitepaper, three demo-page visits, two sales emails, a webinar, and a partner referral. That is a multi-touch journey, even if the CRM only preserves the final referral and the last demo-page session.
When the browser loses cross-site continuity, the path can truncate after the second visit. Last-click then credits the partner, direct traffic, or the final email. LinkedIn and display may look unproductive because their contribution occurred before the measurable identity point.
A practical SaaS response is to use position-based attribution plus consented identity. Preserve the opening acquisition signal when permission exists, connect known contacts after form submission, and reconcile the path against CRM opportunity stages. Budget should move away from channels that merely harvest demand and toward channels that repeatedly assist qualified pipeline, but the exact reallocation must come from the company's own observed revenue rather than an invented universal split.
The DTC version behaves differently
Now take a skincare journey. A shopper discovers the brand through paid social, reads an influencer review, returns to the site twice, abandons a cart, searches the brand name, reopens an email, and converts after using a coupon.
Last-click will often favor the coupon, email, or branded search. That isn't useless, but it hides the discovery and consideration work that made the final interaction possible. Cookie loss makes this worse when mobile social exposure, Safari browsing, and later desktop conversion don't join into one path.
For DTC, use time-decay attribution when recent interactions deserve more credit, then add server-side tagging and modeled conversions for Safari users. The model should inform channel allocation, while experiments and total revenue validate whether the allocation is directionally correct.
| Channel | SaaS Last-Click % | SaaS Post-Strategy % | DTC Last-Click % | DTC Post-Strategy % |
|---|---|---|---|---|
| Paid social | Not established | Measure from first-party and modeled evidence | Not established | Measure from time-decay and experiments |
| Display retargeting | Not established | Measure assist contribution | Not established | Measure return-path contribution |
| Not established | Measure against consented identity | Not established | Measure alongside discovery channels | |
| Search | Not established | Separate branded and non-branded roles | Not established | Separate demand capture from demand creation |
| Partner or influencer | Not established | Reconcile with CRM or referral data | Not established | Reconcile with referral and revenue data |
The honest outcome is a credit shift, not a universal percentage. If your dashboard cannot show how channel credit changes between last-click, consented journeys, modeled conversions, and booked revenue, it isn't ready to guide budget decisions.
Diagnosing Lost Revenue by Browser and Device
Don't buy another identity product before measuring the blind spot. A browser-mix diagnostic should be the gate for every tooling decision.
Start by pulling sessions, conversions, and revenue across three dimensions:
- Browser family: Compare Chrome, Safari, Firefox, and Edge.
- Device class: Split mobile, desktop, and tablet.
- Traffic source: Separate paid search, paid social, display, email, organic, direct, partners, and referrals.
For each slice, calculate observed sessions, observed conversion rate, and revenue tied to a known source. Then compare those results with CRM or billing outcomes. The key question isn't whether Safari “looks worse.” It's whether Safari users convert through journeys your attribution system fails to connect.
Teams with long consideration cycles should also examine the time between first touch and conversion. A cookie can disappear before the buyer returns, especially when the first interaction happens on mobile and the final action happens on desktop. That creates attribution drift, not necessarily a drop in demand.

Produce three decision outputs
- Browser-revenue heatmap: Show revenue, conversion coverage, and unattributed outcomes by browser.
- Device-coverage gap report: Identify mobile-to-desktop and tablet-to-desktop breaks.
- Source-channel exposure index: Rank channels by the share of conversions occurring in low-visibility browser and device segments.
Teams that need a practical framework for how to monitor web traffic can use these dimensions as the minimum reporting structure. The output should connect to booked pipeline or revenue, not stop at analytics sessions.
SourceLoop can automate this diagnostic against CRM-closed deals, allowing the lost-revenue estimate to tie to booked ARR. Treat that result as an estimate for prioritization, not as a proven counterfactual. Validate the largest gaps with controlled tests, consented first-party events, and backend reconciliation.
Phased Implementation Without the Whiplash
A successful rollout has decision gates. Every phase needs one owner, one measurable acceptance condition, and a rollback trigger. Without those controls, teams keep adding tools while measurement quality declines.
Phase one captures first-party signals
During weeks 1 through 4, map first-party capture across key pages. Prioritize form fills, declared email addresses, progressive profiling, consent state, landing pages, referrers, and campaign parameters. Don't ask for every field at once. Capture enough identity to connect a known visitor to a later CRM outcome without creating unnecessary friction.
The gate is 60% of identified visitors on key pages, using the threshold specified in the operating plan. The marketing operations lead owns the decision. Roll back to the prior capture design if consent complaints rise, form completion falls materially, or identity resolution creates duplicate contacts.

Phase two moves events server-side
During weeks 5 through 10, implement server-side tagging through Google Tag Manager Server or a comparable setup. Wire conversion APIs for Meta, Google, LinkedIn, and TikTok. Define a canonical event schema before sending anything, including event name, consent state, timestamp, source identifiers, and CRM keys.
The gate is a sub-three-second p95 server response and 95% event fidelity. The analytics engineering lead owns it. Roll back if latency disrupts the site, duplicate events inflate platform reporting, or event reconciliation fails against the backend.
The cookieless tracking solutions guide offers a useful checklist for evaluating first-party and server-side approaches.
Phase three adds consented identity
During weeks 11 through 16, introduce a consented identity layer. Match declared identifiers to CRM records, build approved audiences, and produce an overlap report for legal review. Don't activate an identity solution because it can resolve more profiles. Resolution without permission creates governance debt.
The privacy or legal owner approves the overlap report. Roll back to the prior consented matching process if the solution can't explain match provenance, retention, access controls, or deletion handling.
Phase four builds an aggregate fallback
From week 17 onward, add geo holdouts, controlled experiments, and a Bayesian or comparable econometric model. This layer answers allocation and incrementality questions when user-level paths remain incomplete.
The gate is an MMM output that reconciles within 10% of MQA-level revenue. The finance or revenue operations owner makes that call. Roll back the model if its assumptions aren't documented, results can't be reproduced, or the output conflicts with booked revenue without a clear explanation.
Why a Measurement Portfolio Beats a Single Tracker
No replacement tracker will recreate perfect third-party-cookie fidelity across every browser, device, consent state, and sales cycle. Chasing that promise wastes time. The durable answer is a measurement portfolio, where each layer answers a different business question.

Assign each layer a job
- First-party capture connects consented behavior on owned properties to known contacts and customers.
- Server-side events improve event delivery and reduce dependence on browser pixels.
- Consented identity helps connect logged-in or declared users across approved touchpoints.
- Marketing mix modeling supports aggregate budget allocation when person-level paths are incomplete.
- Controlled experiments test incrementality instead of assuming correlation equals causation.
- Contextual and probabilistic signals provide directional upper-funnel insight without pretending to identify every individual.
The privacy-versus-accuracy tradeoff is unavoidable. More deterministic identity can improve precision, but it raises consent, compliance, and governance demands. More modeled inputs can restore reach, but they weaken confidence in individual channel decisions.
The gap between two measurement layers isn't automatically a problem. It can expose where your assumptions are doing too much work.
Triangulation is the feature
A portfolio lets leaders compare questions rather than argue over one supposedly correct number. First-party data answers who engaged with the brand. Server-side tracking answers which consented events reached platforms. Experiments answer whether spend caused incremental outcomes. Modeling answers how to allocate across broader market activity.
If the layers disagree, investigate the disagreement. Check browser mix, device switching, conversion lag, consent rates, duplicate events, CRM mapping, and offline revenue. A single tracker hides those weaknesses behind one dashboard total.
SourceLoop can serve as one connective layer by storing attribution touchpoints, mapping web interactions to conversions, syncing CRM outcomes, and sending qualified offline conversions to advertising platforms. Evaluate it alongside other tools based on data ownership, consent controls, reconciliation behavior, and exportability. For technical background, see this overview of server-side tracking.
The objective isn't perfect user-level reconstruction. It's a defensible range for pipeline, revenue, audience activation, and budget allocation.
Your 2026 Cookie Deprecation Action Plan
Run the plan as a quarterly operating process, not a one-time migration project. The browser policy may change again, but your team still needs a repeatable way to detect exposure, choose methods, and validate decisions.
Start with a 30-day diagnostic
Pull browser and device share from analytics, then connect those slices to conversions and revenue in your CRM or billing system. Flag channels where Chrome third-party-cookie loss exceeds 15% of conversions, using the threshold in the operating plan, and quantify exposure by market, device, funnel stage, and conversion lag.
Set the next gate from the exposure level:
- Below 5% exposure: Use model-based attribution with stronger first-party capture and validation.
- Above 20% exposure: Implement consented identity and server-side tagging before reallocating budget.
- Between those levels: Run a controlled pilot, preserve the existing reporting view, and compare outcomes across measurement layers.
Those thresholds are operating rules, not universal laws. Your finance and growth leaders should approve them before the diagnostic begins.
Standardize decisions around ranges
Choose the attribution model before changing reporting. B2B SaaS teams should generally begin with time-decay or position-based logic. DTC teams with suitable data coverage can test data-driven attribution, but they should still validate it against experiments and backend revenue.
Report a range rather than a single point estimate. Include observed conversions, consented conversions, modeled outcomes, and reconciled revenue. A channel that performs well in one layer but poorly in another needs investigation before scaling.
Assign owners and enforce cross-validation
Name four accountable owners:
- Data capture owner: Maintains event quality, consent state, and first-party collection.
- Identity owner: Manages CRM matching, permissions, retention, and deletion workflows.
- Modeling owner: Maintains attribution, experiments, and aggregate models.
- Governance owner: Approves vendors, definitions, access, and reporting changes.
Review the browser-revenue heatmap, device coverage report, source exposure index, event fidelity, CRM reconciliation, and model variance every quarter. Never scale a channel from one attribution output alone. Require cross-validation from at least one other layer, preferably an experiment, backend revenue match, or aggregate model.
The practical cookie deprecation strategy is simple to state and demanding to execute: capture what users consent to, deliver events reliably, quantify the blind spots by browser and device, and make budget decisions from triangulated evidence. Start your 30-day diagnostic this quarter, assign the four owners, and refuse any channel recommendation that can't show how its revenue estimate was validated.
If your current dashboard can't connect browser mix, device behavior, consented touchpoints, and booked revenue, start there. Audit the stack, document the gaps, and build the first decision gate before buying another tracking tool.

 Paid Social


