
How to Measure Marketing ROI: A Step-by-Step Guide
Learn how to measure marketing ROI with a worked formula, the right attribution model, and holdout tests that show what your campaigns really earn.

The most popular advice on how to measure marketing ROI is to divide revenue by spend and call the result a return. That ratio is useful for a weekly status update. It does not tell you whether the campaign caused the sale, whether the sale was profitable after margin, or whether the next dollar should go to the same channel. A paid search account can look excellent while it mostly harvests people who were already going to buy. A quieter channel can look weak on the dashboard and still be the one creating new demand.
Treat three numbers as different tools. Attributed ROI is for reporting. Incremental ROI is for causal proof. Marginal ROI is for the next dollar. The rest of this walkthrough shows which version answers which question, and where a platform total will mislead you if you treat it as finance.
Table of Contents
- Calculate Marketing ROI in Six Steps
- Why Platform Numbers Rarely Add Up
- Pick the Right ROI Formula for Each Question
- Attribute Conversions Without Double Counting
- Prove Lift With a Holdout Test
- Build One Dashboard That Separates the Three Numbers
- Confirm and Improve Your ROI Number Before the Budget Meeting
Calculate Marketing ROI in Six Steps
Say you spent $40,000 across paid search, paid social, and email, and you closed 120 new customers at an average first-order revenue of $1,000. That is $120,000 in revenue. Gross margin is 60%. Walk those inputs through the same six steps every quarter so the number stays comparable.
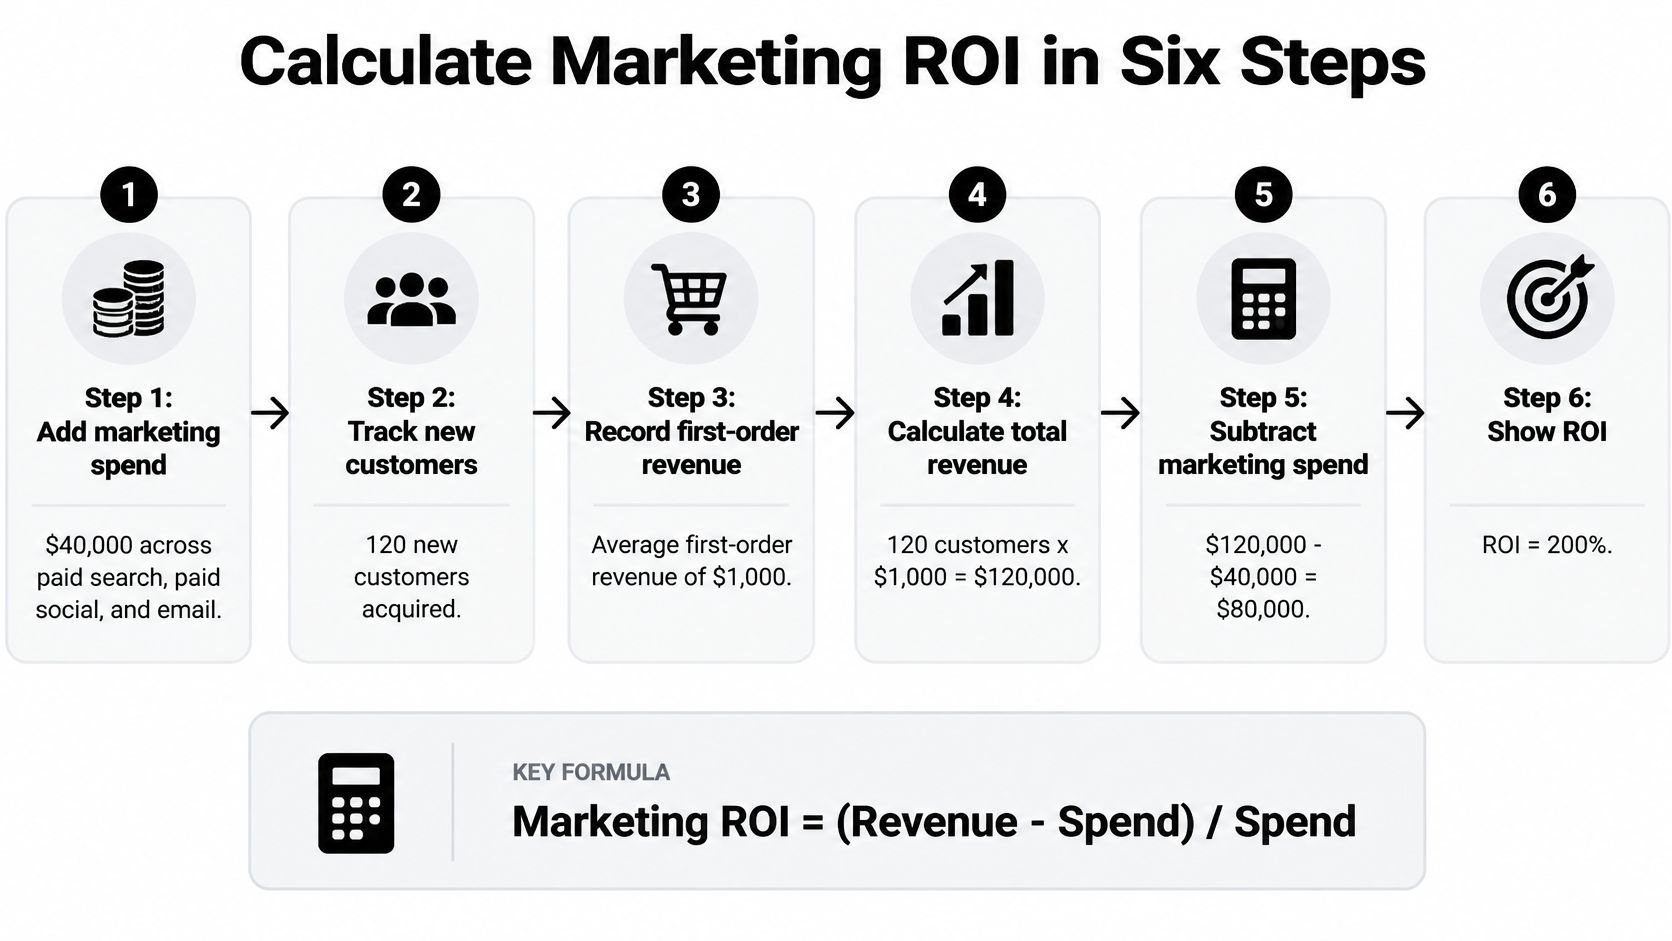
- Define the business outcome. Prefer closed-won revenue or gross profit, not form fills. A lead that never becomes a customer inflates the story, and teams often stop at "we got responses."
- Set the KPI and the attribution window. Thirty days fits many ecommerce orders. Ninety days fits a B2B pipeline that needs a sales cycle. Changing the window mid-quarter makes last month incomparable with this one.
- Capture total spend by channel and campaign. Include media, agency fees, and the tools that only exist to run the work. Leaving fees out is the slip that makes every channel look cheaper than it was.
- Map each closed-won deal back to its original source. Use CRM source fields or consistent UTM values, not the ad platform's self-reported conversions. If the deal never lands in the CRM, you are scoring a click, not a sale.
- Subtract refunds and discounts, then apply gross margin. In this example, $120,000 times 60% is $72,000 of gross profit. Counting revenue instead of margin is the mistake that turns a thin campaign into a hero.
- Calculate ROI as (gross profit minus spend) divided by spend. Here that is ($72,000 − $40,000) / $40,000, or 80%. The raw-revenue version, ($120,000 − $40,000) / $40,000, is 200%. Same customers, very different verdict.
How to read 80% against a target
An 80% gross-profit return means you got $1.80 of gross profit back for each $1 of marketing investment, after the cost itself. If finance wants a 100% return before a channel keeps its budget, this mix is short, even though the revenue-only view looks generous. If the target is "cover cost and fund the team," 80% may still be acceptable for a newer channel with a longer payback.
Practical rule: Report the revenue version and the margin version side by side, and let the margin version decide whether the mix keeps funding.
Creator and affiliate fees belong in that same spend total. If part of the $40,000 is influencer work, connect influencer spend to sales the same way you would a search campaign, with closed revenue rather than engagement. You can sanity-check the arithmetic in our free content marketing ROI calculator before the number goes into a deck.
Why Platform Numbers Rarely Add Up
Open last month's tabs. Paid search claims 60 sales. The social platform claims 45. The CRM records 70 closed deals. Add the platform claims and you are already past the deals finance will recognize. Nobody exported the wrong CSV. Each platform credits itself for any conversion it touched, often inside its own window, so one sale can be counted twice or three times.
That reported return answers a reporting question: which of our ads appeared before a conversion the platform can see? It does not answer a budgeting question: what would have happened if we had not run the ads?
In 2025, 85% of marketers said they were confident in measuring ROI, but only 32% reported measuring ROI across traditional and digital media, according to Nielsen. Confidence and a full picture are not the same thing. A team can feel sure about three dashboards and still be missing offline sales, brand, and the deals that closed outside any pixel.
This guide separates three numbers on purpose.
- Attributed ROI supports weekly reporting and creative checks.
- Incremental ROI is the causal check before you defend or cut a budget.
- Marginal ROI asks what the next dollar earns at the spend level you are already at.
Pull last month's platform totals and the CRM closed-won count onto one page before you read on. If those totals disagree, the rest of the math has to start from the CRM, not from the highest platform claim.
Pick the Right ROI Formula for Each Question
One ROI number cannot answer every question a budget meeting asks. Match the formula to the decision, then live with that formula's blind spot instead of pretending a single ratio covers it.
| Metric | Formula | Answers | Blind spot |
|---|---|---|---|
| Basic ROI | (Revenue − Marketing cost) / Marketing cost | Did spend pay back on paper? | Ignores margin and whether the sale would have happened anyway |
| ROAS | Revenue / Ad spend | How much revenue each ad dollar is credited with | Counts revenue, not profit, and platform credit is often overstated |
| Gross-margin ROI (ROMI) | ((Incremental revenue × Gross margin) − Marketing investment) / Marketing investment | Did marketing create profit above its own cost? | Needs a control group to estimate incremental revenue |
| Incremental ROAS | Incremental revenue / Campaign spend | How much of the revenue did the campaign cause? | Requires a holdout or lift test to measure |
| Marginal ROI | Change in profit / Change in spend | Should the next dollar go to this channel? | Needs test data at more than one spend level |
Why the incremental term changes the verdict
Measure return on incremental net contribution, not on attributed revenue alone. UCLA marketing-research guidance recommends calculating return on net marketing contribution and separating the lift marketing created from the later conversion of that lift into sales. Incremental revenue is the test group minus a comparable control. Then:
ROMI = ((incremental revenue × gross margin) − marketing investment) / marketing investment
An attributed purchase may have happened without the ad. Seasonality, pricing, promotions, competitor moves, and other campaigns running at the same time can bias the estimate. If the lift is not statistically distinguishable from noise, don't move budget on it.
Say retargeting shows a 6x ROAS. A holdout finds most of those buyers would have purchased anyway, so incremental ROAS is closer to 1.2x. Basic ROI and platform ROAS still look strong. Gross-margin ROI and incremental ROAS say the campaign is barely paying for itself once you remove demand you already had. If you want the profit version of that comparison, compare POAS with ROAS before you treat a revenue multiple as profit.
Use basic ROI and ROAS for weekly reporting, gross-margin ROI for the quarterly review, and incremental ROAS or marginal ROI before you move budget.
Attribute Conversions Without Double Counting
A lead clicks a search ad on Monday, returns through an email on Thursday, and closes three weeks later on a sales call the ad platform never sees. Last-click gives the email everything. The search platform may still claim the sale inside its own window. Finance sees one deal. Marketing's channel reports see two or three.
44.5% of surveyed marketing executives cite fragmented, non-unified data as their biggest measurement challenge, and 38.9% cite misalignment between data and media teams, as reported by AppsFlyer. The same research notes that organizational alignment is the leading ROI challenge for 22% of marketers, with unclear KPIs and incomparable data each affecting 19%.
A shared revenue definition
Write down what counts before you pick a model. Distinguish a lead, a qualified opportunity, closed-won revenue, gross margin, and customer lifetime value. Preserve the original source on the contact at first touch, keep UTM values consistent, store later touches, and sync closed-won deals back from the CRM. Report by cohort so a deal that pays in month four is not mixed with this week's form fills. We capture each visit and show which efforts drive conversions, including direct and organic traffic, so the early visit is still on the record when the CRM closes the deal. Closed-loop attribution is what makes that handoff stick.
| Model | How it credits | Best for | Watch for |
|---|---|---|---|
| Last click | 100% to the last touch before conversion | Quick operational view of short sales cycles | Ignores the channels that started the journey |
| First click | 100% to the first touch | Seeing which channels bring new prospects in | Ignores nurturing and closing touches |
| Linear | Equal credit to every touch | Long B2B journeys with many contacts | Overweights minor touches |
| Time decay | More credit to touches closer to conversion | Sales cycles of several weeks | Results depend on the half-life you set |
| Position-based | 40% to the first touch, 40% to the last, 20% split across the middle | Balanced view of discovery and close | Middle touches get little credit, and the 40/40/20 split is a choice, not a law |
| Data-driven | Credit learned from converting paths | High-volume accounts with clean data | Needs large samples and is hard to audit |
Pick one model and write it down
Choose a single model for reporting, write it as an allocation policy, and apply it to every channel so the comparison stays fair. Data-driven credit is attractive, but it needs a large, clean set of converting paths, and you will struggle to explain a weight in a budget meeting. For a shorter cycle, last click is fine as an operational view. For a multi-touch B2B deal, position-based or linear will stop the closing email from taking the whole win.
When sales, partners, product usage, and retention all influenced the deal, there is no correct silent split. The denominator is whatever the allocation policy says, checked against finance-approved revenue and, when precision is critical, an incrementality test. Form fills are a poor proxy for that economic value, especially for agencies, SaaS, and B2B teams.
Prove Lift With a Holdout Test
Attribution records which touchpoints showed up before a conversion. A holdout asks what would have happened if the campaign had not run. Those are different questions, and only the second one should move a large budget.
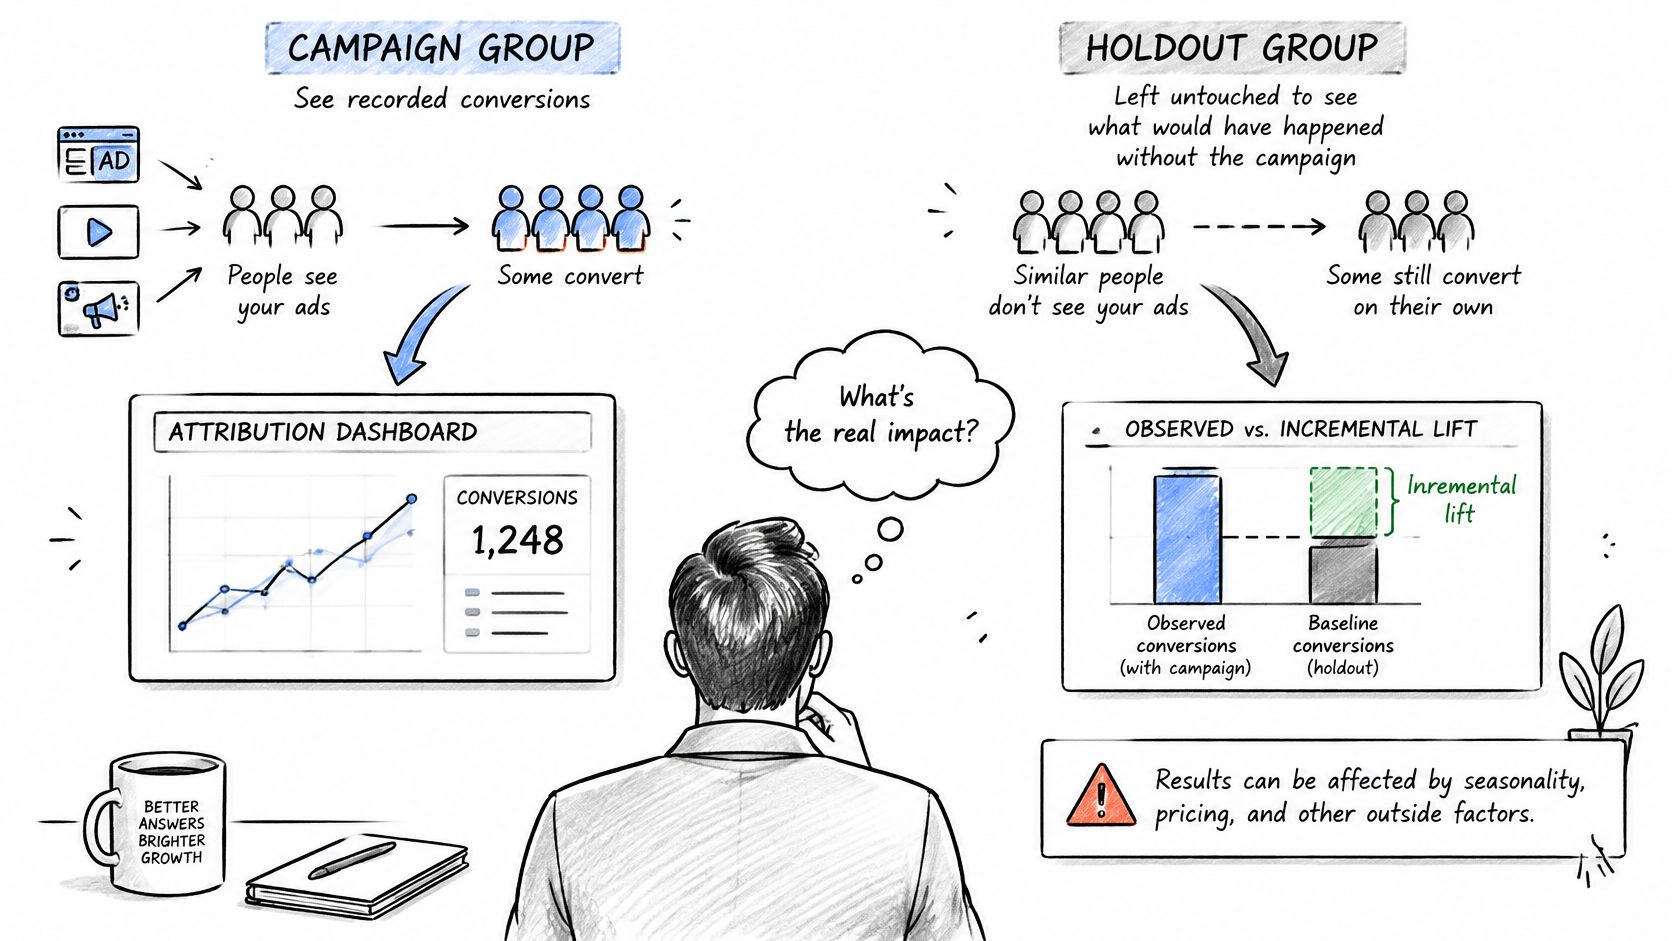
Measured describes a dual system: multi-touch attribution for weekly diagnostics, and incrementality experiments for budget validation. Attribution can flag funnel leakage, assisted conversions, time to conversion, and cost per qualified opportunity. It does not prove a touchpoint caused the outcome. In the 2025 report they cite, only 8% of marketers used incrementality testing, while 41% reported difficulty measuring ROI. Treat attributed ROAS as a directional signal and recalibrate it against a controlled result.
A geo holdout a small team can run
Geo tests work well for national or regional campaigns because they lean less on cookies, platform windows, and self-reported ad conversions.
- Choose one primary outcome before launch, such as qualified pipeline or gross profit. Pre-register it so a flattering secondary metric cannot become the story later.
- Split comparable regions or audiences into an exposed group and a held-out group, and suppress the campaign in the control.
- Run a pre-period check. If the groups already differed before you launched, the test is measuring history, not the ads.
- Set the sample with a power analysis so you can detect a lift that is large enough to matter commercially. An undersized test will "find" noise.
- Keep the test through at least one full buying cycle. Don't stop early because week two looks good.
- Calculate incremental revenue as test minus control, then divide by campaign spend. That quotient is incremental ROAS.
A short walkthrough of why the control group exists helps when you brief a teammate who has only ever read platform ROAS:
Common ways these tests fail: ending early, samples that are too small, audiences that leak into the control, changing creative and offer and bid at once, and treating one market's result as true for every market.
Act only when the lift is distinguishable from noise. An inconclusive test is a reason to keep measuring, not a reason to cut the channel.
Build One Dashboard That Separates the Three Numbers
One shared view beats three platform exports. Read the tiles in this order in a weekly review, and don't let a tile change budget unless its revenue matches finance's definition.
- Platform ROAS by channel, refreshed weekly, for bid and creative tweaks only. It is the fastest signal and the least safe one for a reallocation.
- Closed-won revenue by source, from the CRM and the saved UTM values, compared with platform totals every week. If search claims 60 sales and social claims 45 while the CRM shows 70 closed deals, this tile should flag the gap before the budget meeting.
- Gross-margin ROI, using a margin finance has signed off, reviewed quarterly to decide which channels keep funding.
- Holdout incremental ROAS, added after each test, and the only tile that should move money between channels.
- Marginal ROI at current spend, from tests at two or more spend levels, to decide where the next dollar goes.
Multi-touch attribution reporting can feed tiles one and two. Tiles four and five still need an experiment, not another model toggle.
Confirm and Improve Your ROI Number Before the Budget Meeting
Do these three things, in order, before the meeting.
- Pick the one figure the decision needs. Attributed ROAS for weekly channel tuning. Gross-margin ROI for the quarterly review. Incremental ROAS when the question is moving money between channels. Bringing all three into one slide and averaging them hides the decision.
- Run one holdout on the channel with the most disputed credit. That is usually paid social, where the platform total and the CRM diverge the most. Keep the test on a single change so you can name what moved.
- Write the allocation policy on one page. Sales and finance should use the same revenue definition, the same window, and the same rule for deals that marketing influenced but did not close alone.
Then tighten the number you already have.
- Trim channels whose incremental ROAS stays near 1x after a valid test. They are replacing revenue you would have earned anyway.
- Shift budget only toward channels whose marginal ROI still beats your target. A strong average return can hide a next dollar that no longer pays.
- Track discounts and refunds against first-order revenue so a promo doesn't masquerade as marketing profit.
- Shorten time to conversion where the CRM shows slow follow-up on qualified leads. A slow handoff makes a good source look expensive.
Our free tools cover the messy inputs behind those checks: a UTM Campaign Builder, UTM Validator, Google Ads Cost Calculator, Customer Acquisition Cost Calculator, Marketing Attribution Calculator, Sales Funnel Calculator, and GA4 Channel Grouping Validator. Clean UTMs and a real acquisition cost will move the ROI figure more than another dashboard theme.
The number is only as strong as its inputs. Repeat the six calculation steps next quarter, with the same outcome, the same window, and finance's margin, before you defend the plan.
Pull last month's CRM closed-won revenue, your true spend including fees, and one channel you don't fully trust. Run the margin ROI, then book a holdout on that channel before the next budget lock. If you want the original source sitting on every lead, meeting, and payment while you do it, start a SourceLoop trial and send closed outcomes back to the ad platforms instead of form fills.



 Paid Social


