
What Is an Attribution Model? Types and When to Use Each
What is an attribution model? Learn how single-touch and multi-touch models credit marketing touchpoints, their pros and cons, and when to use each.
An attribution model is a rule or data-driven algorithm that assigns credit for a conversion to the marketing touchpoints in a customer's journey. You're probably asking because a channel that looks profitable in one dashboard looks weak in another, and you have to decide where next month's budget goes. That conflict isn't usually a tracking mystery. It's often two different credit-splitting rules describing the same sale.
Table of Contents
- What an Attribution Model Does for Your Conversions
- Single-Touch and Multi-Touch Models Compared
- Single-Touch Models and Where They Mislead
- Richer Paths and Harder Work
- Attribution Is Not the Same as Causation
- Choosing a Model by Business Type
- Pick a Starting Model and Test It This Month
What an Attribution Model Does for Your Conversions
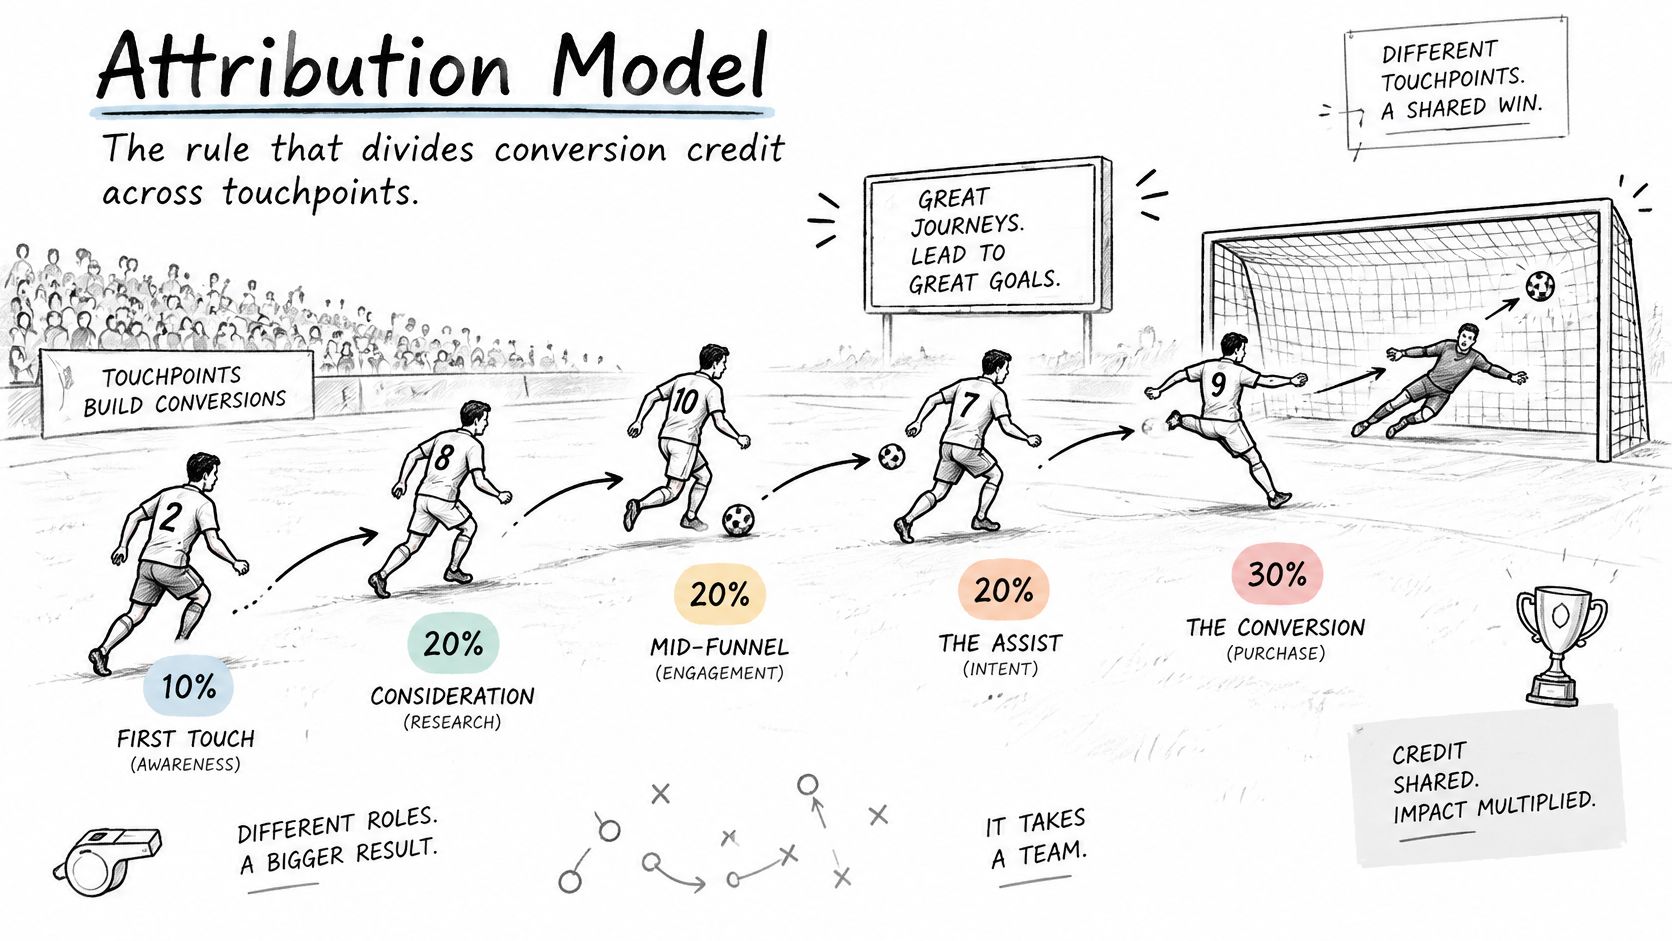
Think about what is an attribution model through a football goal. The scorer finished the move, one player played the final pass, and others built the attack. You can praise only the scorer, or you can share credit across the move. The rule you choose for dividing that credit is the model.
Say Google Ads reports 40 conversions, Meta reports 32, and TikTok reports 18, yet your shop or CRM recorded 50 actual sales. That's 90 claimed conversions against 50 real ones. Each platform is grading its own homework because each one saw part of the same journeys and claimed the result.
The model is your shared rule for settling that argument. It decides which touchpoints count, how much credit each one receives, and whether one conversion stays whole or gets split into fractions. Without that rule, you're adding overlapping claims and calling the total performance.
The simplest version to picture first
Last-click attribution gives all credit to the final qualifying interaction before conversion. Google's attribution documentation describes last-click as assigning 100% of conversion credit to that final touch, which makes reporting easy but ignores earlier discovery, consideration, and assist interactions. In November 2023, Google Analytics removed first-click, linear, time-decay, and position-based models from its standard options, leaving data-driven and last-click as the principal choices there.
That removal doesn't make the older models useless for thinking. It means you may need a separate view when you want to compare them, which is where a closed-loop attribution setup helps by tying the journey back to real leads and revenue.
Pull last month's conversions from each ad platform and your CRM, add the platform claims together, and compare that total with actual sales. The gap shows you why you need one agreed rule.
Single-Touch and Multi-Touch Models Compared
Models fall into two families. Single-touch models give all credit to one interaction. Multi-touch models spread credit across several interactions, either with a fixed formula or with estimates based on your account data. Neither family is automatically more honest. Each one answers a different question and hides a different part of the journey.
First-click asks, what started this relationship? Last-click asks, what immediately preceded the conversion? Linear treats every recorded touch as equal. Time-decay and position-based apply a preset opinion about which positions matter most. Data-driven estimates contribution from observed patterns instead of using the same fixed percentages for every path.
Attribution models compared by credit rule and use
| Model | Credit rule | Best used for | Main blind spot |
|---|---|---|---|
| Last-click | 100% to the final qualifying touch | Direct-response checkout tracking | Ignores discovery and assist touches |
| First-click | 100% to the first touch | Seeing which channels start journeys | Ignores everything that closed the sale |
| Linear | Equal share to every touch | A neutral baseline across the full path | Treats a banner view the same as a search click |
| Time-decay | More credit to touches nearer conversion, historically a 7-day half-life | Short sales cycles and ecommerce | Undervalues early awareness |
| Position-based | 40% to first touch, 40% to last, 20% spread across the middle | Balancing discovery and closing touches | Fixed percentages do not reflect your actual journeys |
| Data-driven | Credit estimated from observed account data | Accounts with high conversion volume | Opaque logic and needs large, clean datasets |
Read the table from left to right, but choose from the middle outward. Start with the situation in the third column that matches your sales cycle, then look at the blind spot and ask whether your current reports already show that distortion. If they do, that model will probably reinforce a mistake you are already making.
For example, an ecommerce team with same-day purchases may accept last-click's blind spot because there aren't many earlier touches to miss. A B2B team with demos booked weeks after first contact can't accept that same blind spot without starving the content and ads that create pipeline. The comparison in these marketing insights from Netco Design is useful additional reading if you want another plain-language breakdown of the same model families.
Practical rule: Pick the model whose blind spot you can monitor, not the one with the most impressive name.
Also remember the platform limit from the previous section when you shop for these options in Google Analytics. You can still reason with first-click, linear, time-decay, and position-based logic, and you can apply those rules in other reporting, even though they aren't standard choices in that interface now. The model is a reporting decision, not just a menu item.
Single-Touch Models and Where They Mislead
Say a B2B software buyer searches your brand name on Google on Tuesday. The following week she reads three blog posts, clicks a LinkedIn ad, attends a webinar, and then converts after the webinar follow-up email. That's one buyer, one conversion, and at least five meaningful touches.
Under last-click, the email receives all the credit. Your report makes the webinar follow-up look like the whole story, so the obvious budget move is more email and less content. Under a first-touch view, which is covered in more detail in this guide to first-touch attribution, the branded search receives everything. Now the blog posts and LinkedIn ad that built confidence disappear. Both answers identify a real touch. Both mislead if you treat them as the full cause.
Why single-touch still wins budget meetings
- Simple to explain: One channel gets one number, so finance and leadership can follow it quickly.
- Quick to set up: You don't need complex path rules to produce a report this week.
- Matches platform defaults: The view often resembles what ad managers already see in their accounts.
- Clear for quick checks: It's useful when you only need to confirm that conversions are being recorded.
Where the bill arrives
- Middle touches vanish: Comparison content, reviews, retargeting, and sales assists receive nothing.
- Branded search gets overweighted: It often captures demand created by earlier ads, content, referrals, or word of mouth.
- Early channels look weak: A channel doing discovery work can appear unprofitable because another touch closes.
- One-touch thinking spreads: Teams start cutting assists, then wonder why the closing channel has fewer ready buyers.
Single-touch is sound when purchase paths are short, when you run one main channel, or when you're doing a sanity check rather than a budget decision. An impulse purchase from one search ad doesn't need a complicated split. A considered purchase with research, colleagues, calls, and return visits does.
Run this test before you defend single-touch. Open your top 10 converting paths in analytics and count the touches in each one. If most paths have one touch, single-touch reporting is probably close enough. If most have five or more, it isn't simplifying the story. It's hiding most of it.
Richer Paths and Harder Work
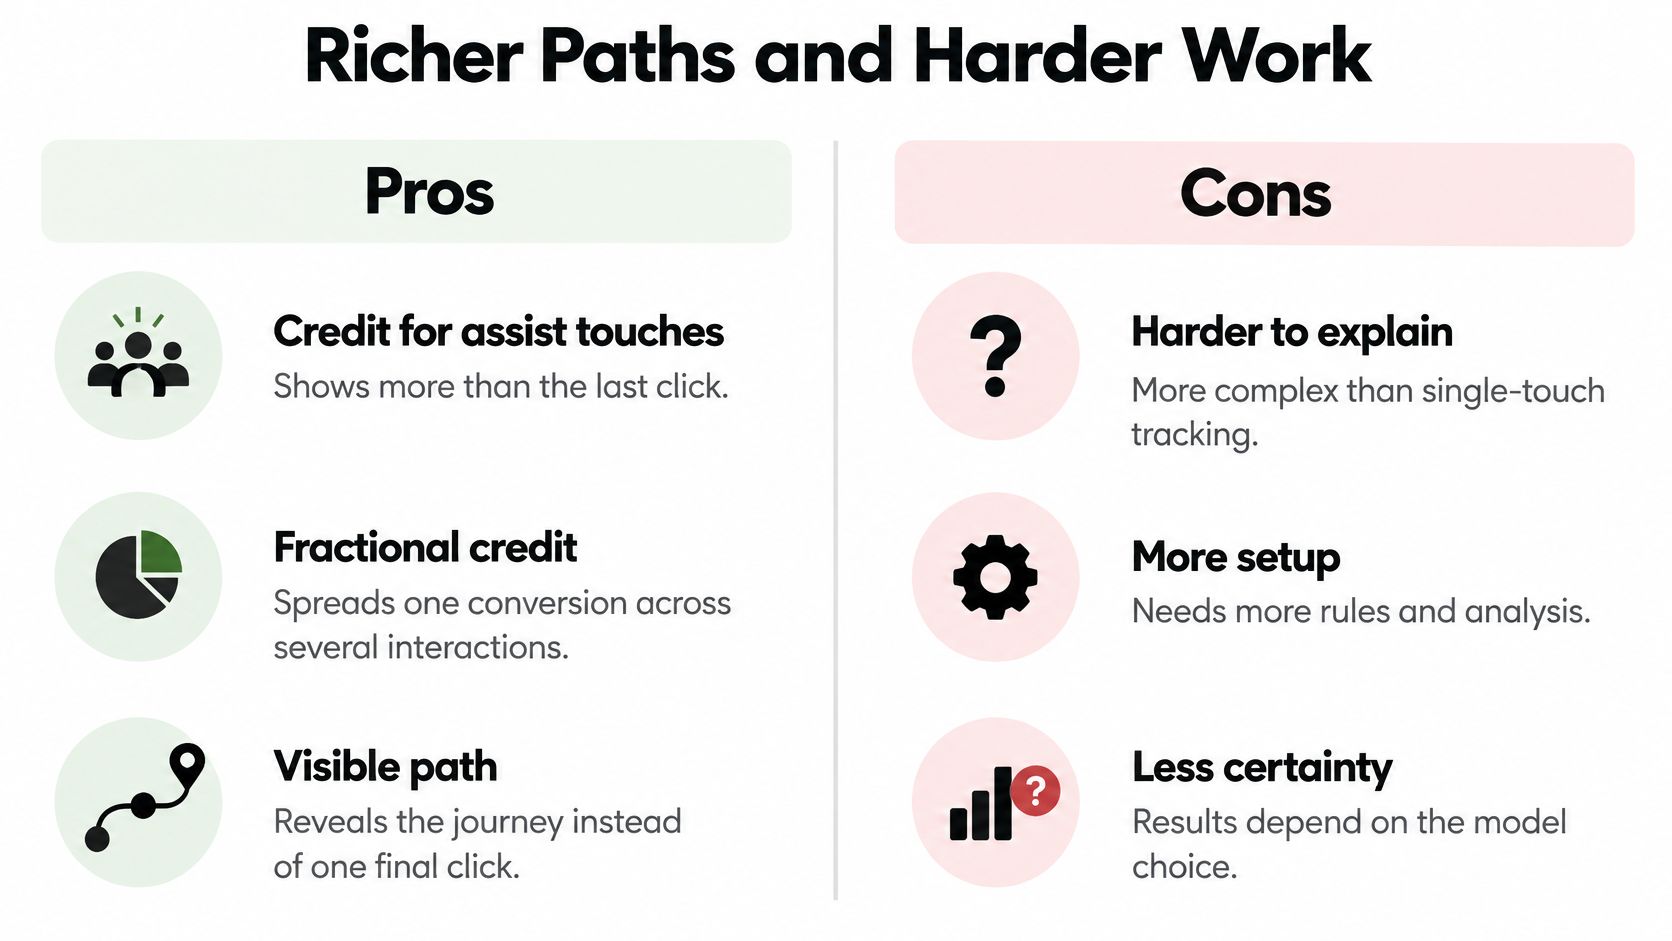
Multi-touch reporting adds three things single-touch can't show. It gives credit to assist touches, it allows fractional credit so one conversion can be shared across interactions, and it makes the path visible instead of collapsing everything into the final click. That fuller path is valuable when buyers research across days or weeks.
What you gain
- Credit for assist touches: Content, social ads, and webinars can receive value before the closing touch.
- Fractional credit: Several interactions can each receive part of one conversion instead of fighting for all of it.
- Visible path: You can see common sequences, repeated visits, and drop-off points across the journey.
- Better fit for longer cycles: B2B and high-consideration purchases don't get reduced to the last email or search.
What it demands from you
- Consistent UTM tagging: Campaign names must mean the same thing in every platform and report.
- Identity stitching: Visits across devices, forms, chat, and bookings need rules for when they belong to the same person.
- CRM connection: Ad clicks need to connect to leads, opportunities, calls, and revenue, not stop at a form fill.
- Offline conversions: Phone calls, meetings, and sales-closed outcomes must flow back into reporting.
- Enough volume: Data-driven estimates become unstable when conversion counts are thin or tracking is patchy.
This workload explains why richer measurement frustrates so many teams. In 2024, 80% of marketers were dissatisfied with their ability to reconcile results across different measurement tools, according to the Mobile Marketing Association's State of Attribution report. In a September 2024 survey of 357 marketing decision-makers, 41% identified difficulty tracing customer touchpoints as a marketing-attribution challenge, according to Ascend2 research reported by MarketingProfs.
Consider a webinar attendee who doesn't book on the landing page. She calls two days later and becomes a customer on the phone. Without call tracking tied to the campaign, the path breaks at the most valuable step. The webinar looks like an assist with no outcome, and the sale may land in an unknown bucket.
A transparent imperfect model beats a precise-looking model built on hidden gaps.
Do two things each month. First, compare CRM revenue with ad-platform conversions for the same period. Second, treat any gap as a tracking task to fix before you change the model. Switching from last-click to position-based won't repair missing calls, broken UTMs, or leads that never reached the CRM. Fix capture first, then argue about credit.
Attribution Is Not the Same as Causation
Say a buyer has already compared prices, read reviews, and put your product on a shortlist. A retargeting ad follows her for two days, she clicks it, and she buys an hour later. Attribution may give that ad a large share of revenue because it sat late in the path. But would she have bought anyway? That's a different question, and attribution alone can't answer it.
The short visual below introduces that distinction between credited presence and proven lift.
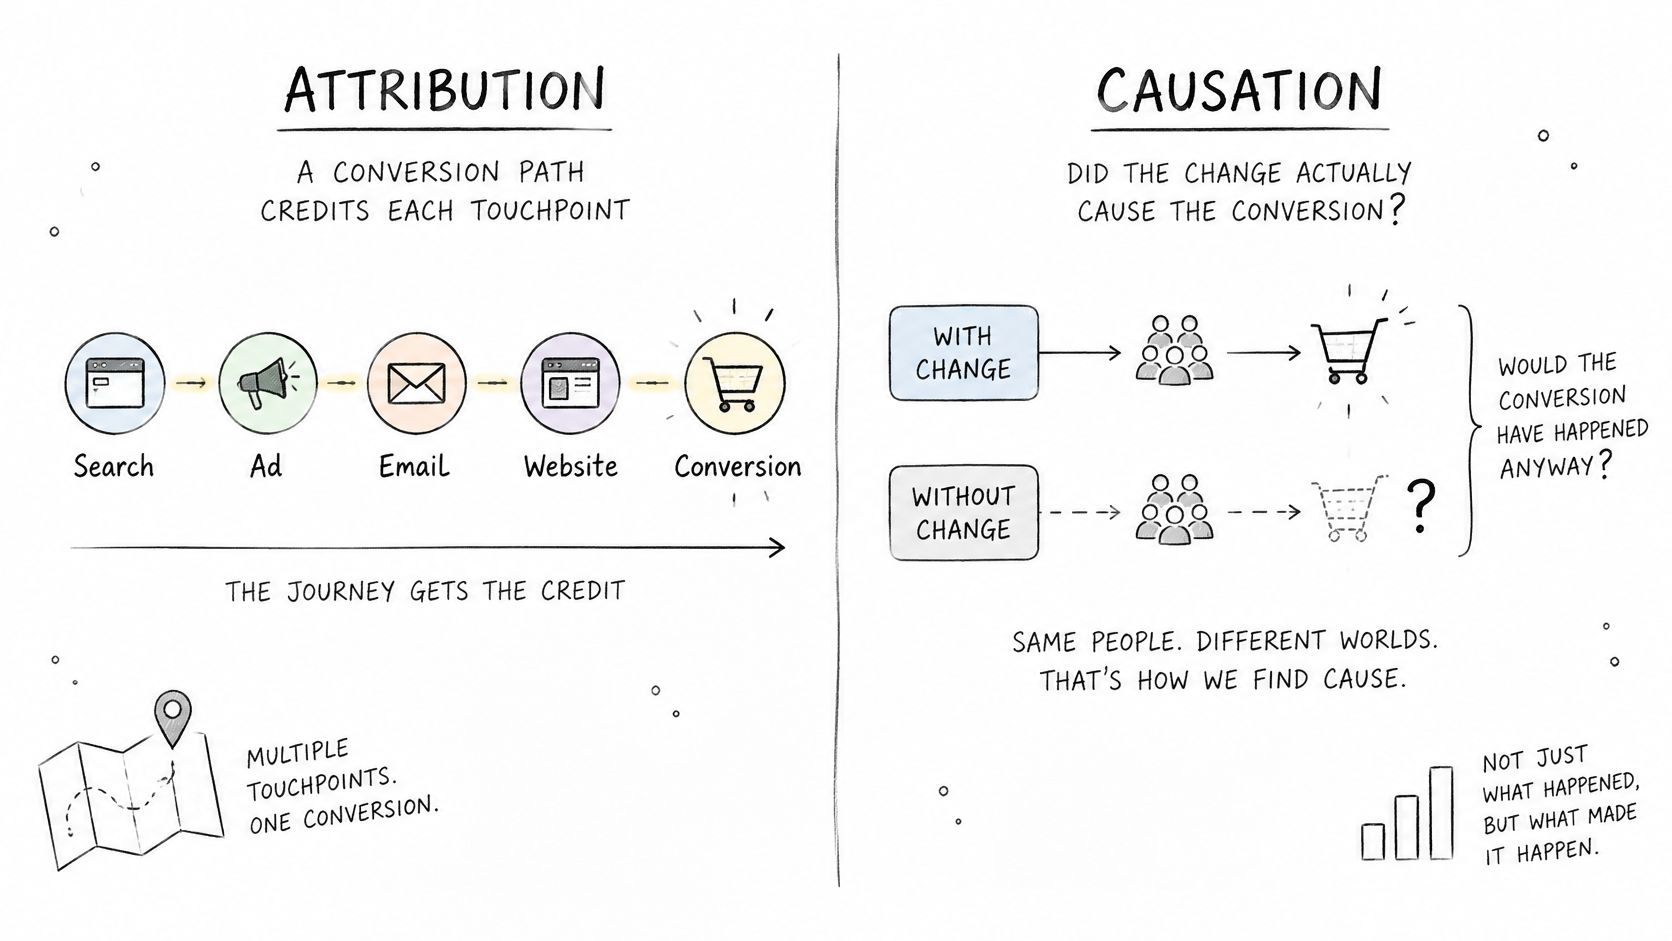
Google's explanation of attribution and incrementality distinguishes attribution, which credits touchpoints associated with a conversion, from incrementality, which estimates conversions that would not have occurred without the marketing activity. Google's 2025 Meridian updates focus on combining marketing-mix modeling with incrementality experiments to estimate true lift, which sits alongside journey reporting rather than replacing it with fancier credit splits.
That distinction matters because late touches are easy to credit. The model rewards proximity to the sale, and busy teams reward whatever the dashboard praises. For a broader view of testing whether ads changed outcomes, this overview of advertising effectiveness measurement connects attribution with lift-based thinking.
A 2025 practitioner survey reported by Retail Dive found that 43% of marketers said fragmented tools prevented a complete performance view, while only 25% used a clear model to measure incremental revenue and 37% could not isolate lift. Those gaps are exactly why holdouts belong beside attribution reports.
Three tests a lean team can run
- Holdout group: Exclude a comparable audience from one channel for two weeks, then compare conversion rates.
- Geo test: Switch a channel off in matched regions while leaving it on elsewhere.
- Platform experiment: Use a built-in control audience where the ad platform supports one.
The video below gives another explanation of why being present before a purchase is not proof that an ad caused it.
Only move serious budget when the exposed and held-out difference is larger than your normal week-to-week variation. Use attribution to diagnose the journey and spot suspects. Use experiments to decide where money moves.
Choosing a Model by Business Type
The right starting model depends on sales cycle length, the number of touches a typical buyer makes, and where the conversion happens. A one-click checkout, a three-month B2B deal, and a phone-closed lead should not share the same default just because one dashboard offers it.
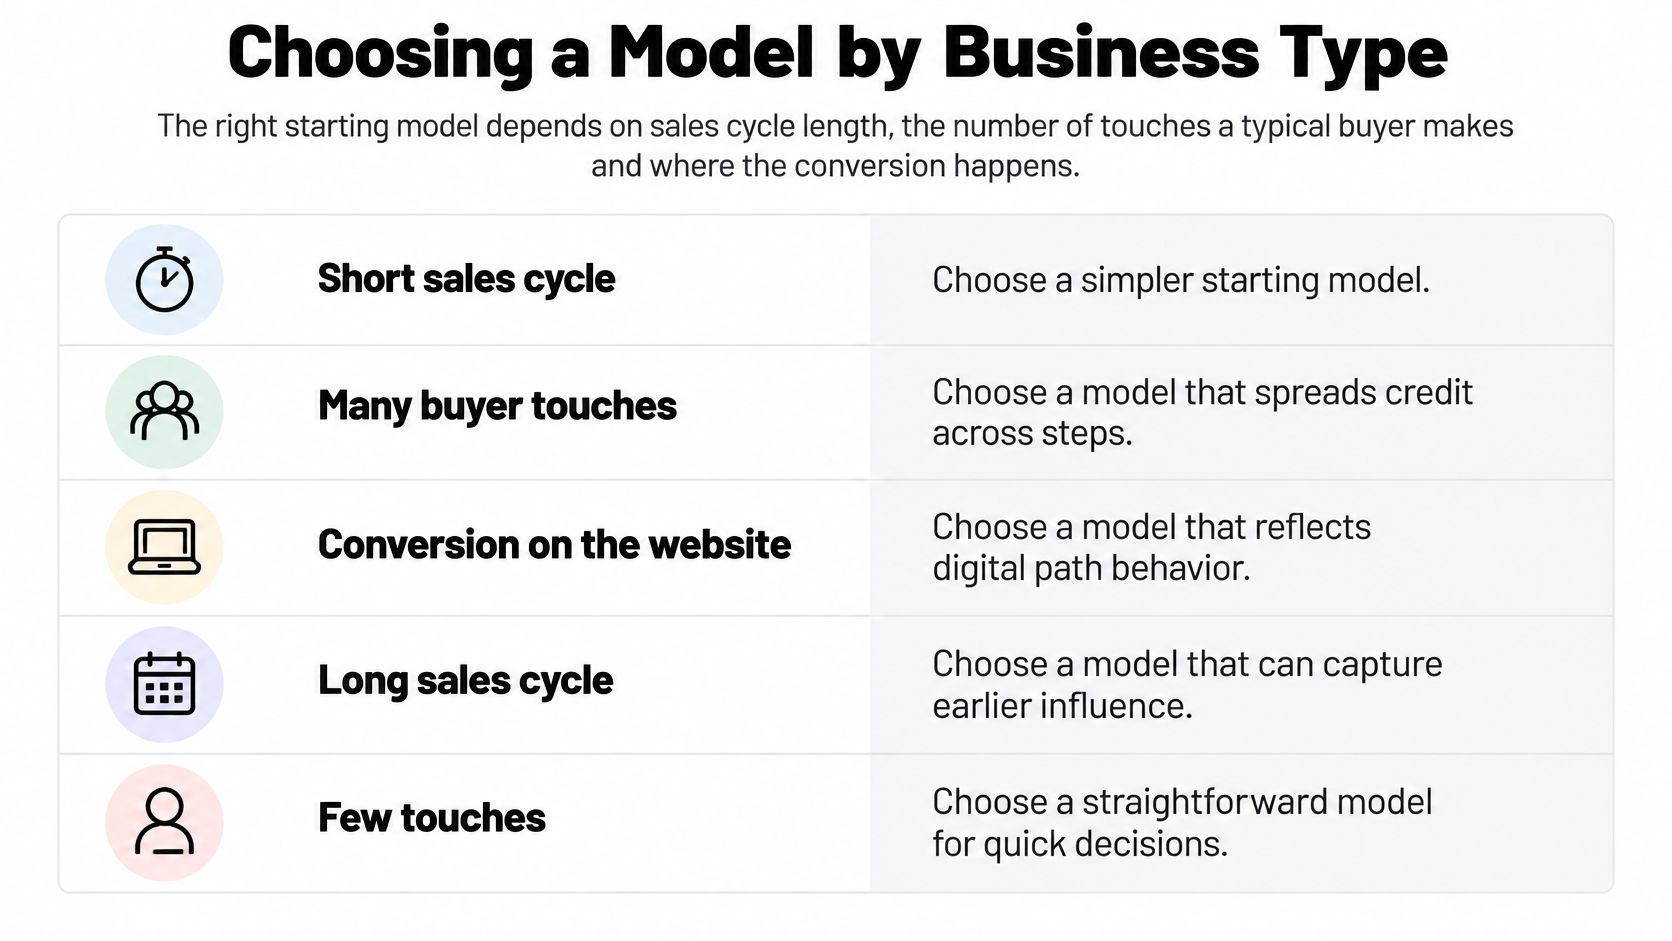
Starting attribution model by business situation
| Business situation | Starting model | Why it fits | Check before trusting it |
|---|---|---|---|
| Ecommerce with a short purchase path | Time-decay or last-click | Recent touches drive most sales | Returning-visitor sales are not overcredited |
| B2B with a three-month sales cycle | Position-based or data-driven | Early and late touches both matter | CRM deal stages are linked to ad clicks |
| Lead generation agency with phone closes | Position-based with call tracking | Calls are the real conversion and forms are assists | Calls are tied to the campaign, not only the landing page |
| Brand campaign with a long-view goal | Linear baseline with a lift test | Awareness touches rarely close a sale alone | Lift test results, not attributed revenue alone |
| Single-channel paid search | Last-click | Few touches to split between channels | Branded search overlap with other campaigns |
For ecommerce, recent intent often matters most, so time-decay or last-click can be a practical start. Your check is returning visitors. If loyal customers click a branded ad out of habit before a planned repeat order, the model may credit the ad for demand your product already earned.
For B2B, discovery and closing both matter because buyers research, consult colleagues, and return through different devices. Position-based gives visible weight to both ends, while data-driven may help when volume and tracking quality support it. Neither helps much if CRM deal stages aren't linked to the original ad clicks.
For phone-close lead generation, the form fill is often only an assist. The booked call or qualified conversation is closer to real value, so calls must carry campaign source data into the CRM. Brand campaigns need even more caution because awareness rarely produces a neat last click. A linear baseline can keep early touches visible, but a lift test tells you whether exposure changed behavior.
Single-channel paid search is the one case where last-click often stays reasonable. There are fewer channels fighting for credit. Still check branded search overlap, because branded terms can absorb credit for demand started by generic campaigns, partners, or offline activity.
Confirm the fit before you lock it in
- Path length: Count touches on your top converting paths.
- Channel count: List every paid, organic, email, partner, and offline source involved.
- Sales cycle: Measure time from first recorded visit to closed revenue.
- Offline flow: Confirm calls, meetings, and won deals reach reporting and ad platforms.
If those answers point in different directions, choose the simpler model for now and write down the known gap. A named limitation is easier to fix than a complicated model nobody trusts.
Pick a Starting Model and Test It This Month
Don't start by debating every model in a meeting. Start with evidence from your own accounts, choose one starting rule, and test whether its predictions survive contact with a holdout.
- Pull 90 days of data: Export conversions from each ad platform and from your CRM, then note the gap between platform totals and actual sales, leads, bookings, or payments.
- Pick one starting model: Use the chooser table and match it to your sales cycle and channel count. Write the model's blind spot in the report so readers see the limitation beside the numbers.
- Report unattributed conversions separately: Give unknown or unattributed conversions their own line. That keeps gaps visible and stops your team from assuming the model covers every journey.
- Run a two-week holdout: Hold back your largest channel from a comparable audience or region before moving budget. Compare the result with what the model predicted that channel was worth.
Comparing models on the same data matters. SourceLoop lets teams compare first-touch, last-touch, linear, position-based and time-decay models side by side, and many teams are tracking attribution within an hour of setup. That comparison doesn't prove causation, but it shows how much your budget story changes when only the credit rule changes.
Choose the model, record its blind spot, and schedule the holdout this month. If the holdout disagrees with the dashboard, believe the test and adjust the model. If they broadly agree, you have a starting rule your team can use without pretending it's perfect.
Start your free SourceLoop trial this week, connect your forms, bookings, calls, and CRM, and compare first-touch, last-touch, linear, position-based, and time-decay credit on the same conversions before you move another pound or dollar of budget.


 Paid Social


