
Attribution Modelling in Marketing: Which Model to Use
Attribution modelling in marketing explained: compare first-touch, last-touch, linear, time-decay and data-driven models, with metrics and accuracy checks.

Your prospect sees a LinkedIn ad, clicks a Google search ad later, then books a demo through a nurture email. At the next budget meeting, the advertising dashboards and your email report all claim credit for the same customer. Finance sees a sale. Marketing sees competing explanations.
Attribution modelling in marketing gives you a consistent way to divide that credit. The harder question is whether the channels receiving credit changed the outcome, and whether their apparent value survives a check against closed revenue.
Table of Contents
- What Attribution Modelling Is and Why It Matters
- Attribution Models Compared at a Glance
- How Each Model Splits Credit for One Customer Journey
- How Data-Driven Attribution Assigns Credit
- Metrics to Track and What Each One Tells You
- How to Check Whether Your Model Is Accurate
- Pick Your Model and Confirm It Against Revenue
What Attribution Modelling Is and Why It Matters
Attribution modelling assigns a share of a measured outcome to the interactions that preceded it. Before comparing models, agree on what you're counting:
- Touchpoint: A tracked interaction, such as an ad click, website visit, or email engagement.
- Conversion: The outcome you're measuring, such as a qualified lead, booking, or purchase.
- Credit: The portion of that outcome assigned to a touchpoint under your chosen rule.
The overlapping claims become easier to understand when you separate the customer journey from each platform's view of it.
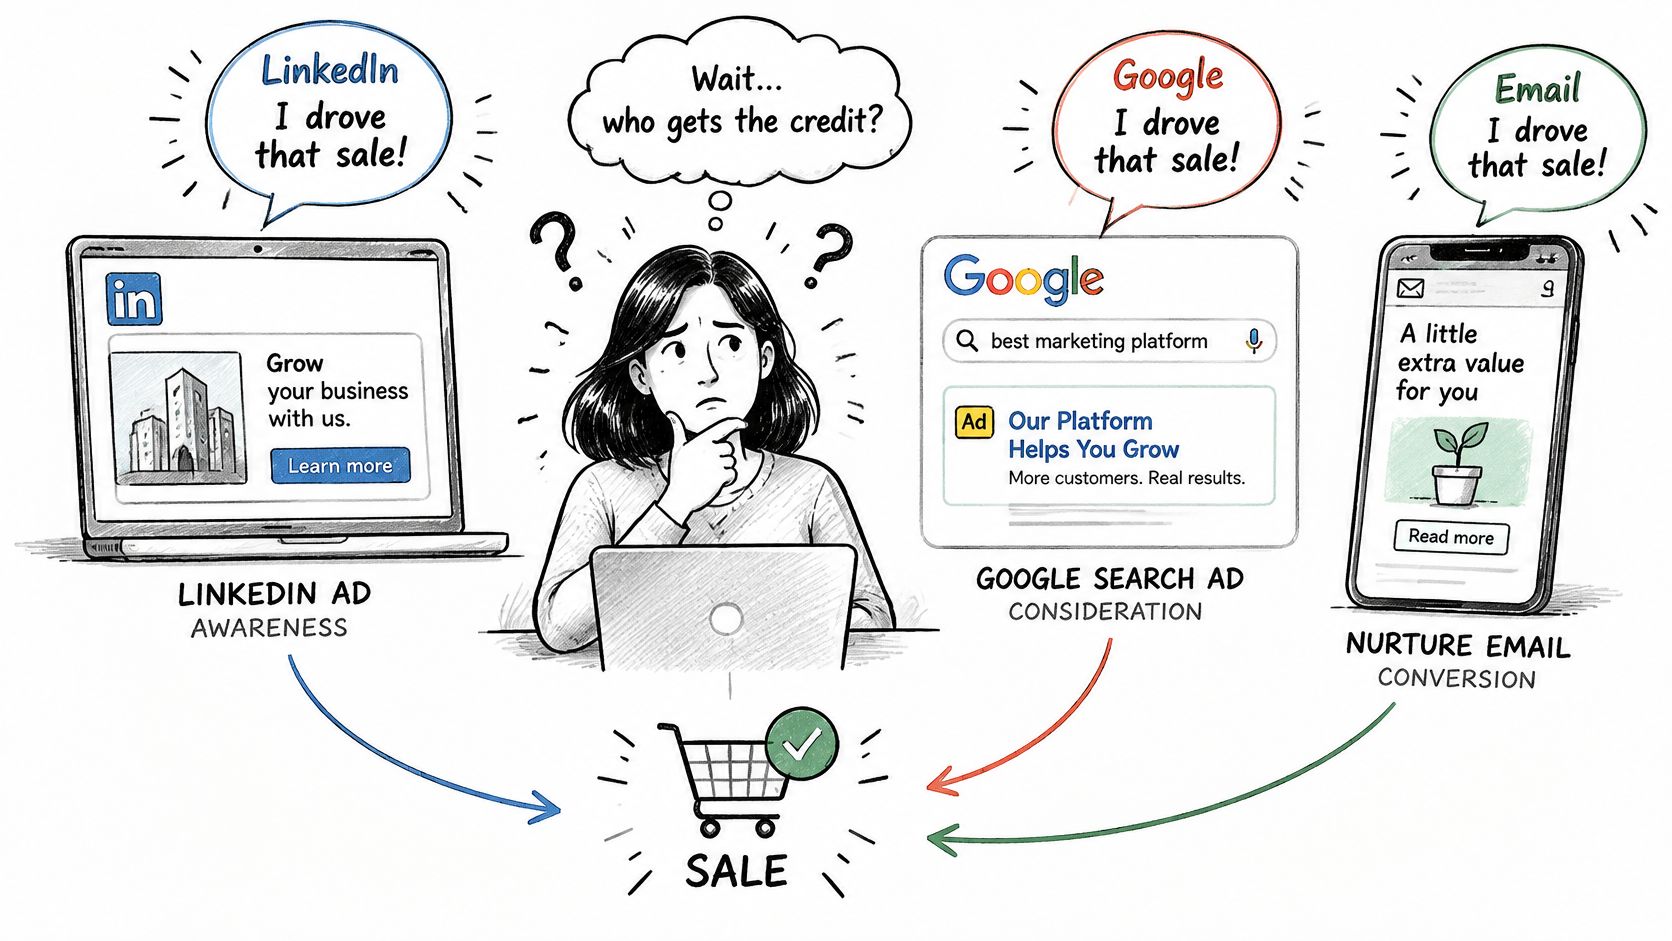
Think of attribution as splitting a restaurant bill. You could divide it equally, or ask the person who ordered the expensive main course to pay more. Neither rule changes the meal, but each changes who appears responsible for the cost.
A bibliometric review of multi-channel attribution describes the progression from aggregate, campaign-level measurement toward analysis of individual interactions across search, display, email, social, and websites.
Budget principle: A channel's credited contribution reflects both customer behaviour and the accounting rule you selected.
That matters when your team funds channels according to reported performance. A closing interaction can look indispensable while earlier work disappears from the report. Your task is to choose a defensible model, understand what its output means, and check whether its recommendations hold against business outcomes.
Attribution Models Compared at a Glance
Six attribution models: how they split credit and where they fail
| Model | How it splits credit | Best for | Main blind spot |
|---|---|---|---|
| First-touch | All credit to the first tracked interaction | Measuring tracked introductions | Ignores nurturing and closing |
| Last-touch | All credit to the final eligible interaction | Short, direct-response purchases and simple reporting | Overrewards closing channels such as branded search |
| Linear | Equal share to every eligible touchpoint | Journeys where every touch plays a visible role | Treats weak and strong interactions equally |
| Time-decay | More credit to touchpoints closer to conversion | Short purchase cycles with a clear buying window | Can undervalue early awareness |
| Position-based (U-shaped) | Larger fixed shares to the first and last touches, with the remainder shared across the middle | Longer journeys where introduction and closing matter most | Uses an assumed split rather than a measured contribution |
| Data-driven (algorithmic) | Shares based on modelled changes in conversion probability | Accounts with enough outcomes to train the model | Harder to interpret and potentially unstable with sparse conversions |
Choose the question before the model
First-touch helps you investigate how buyers first enter your tracked journey. Use it to evaluate introductions, not to conclude that the introductory channel completed the persuasion. The first interaction you recorded also isn't necessarily the buyer's first encounter with your brand.
Last-touch is practical when a buyer can move directly from an interaction to a purchase. Its limitation becomes obvious when branded search receives credit after a prospect has already researched your product and decided to buy.
Linear offers an understandable baseline for a team moving beyond winner-takes-all reporting. It acknowledges nurturing, but it can't distinguish a passive exposure from an interaction that resolved a serious buying objection.
Decide which assumptions you can defend
Time-decay suits situations where recent interactions plausibly matter more. The trade-off is that you choose how quickly older touches lose weight. A sensible calculation can still rest on an unsuitable buying-cycle assumption.
Position-based makes the introduction and closing interaction prominent while retaining a role for the middle. It's easy to explain to stakeholders, but the weighting is a policy choice, not a discovery about buyer psychology.
Data-driven can account for patterns that fixed rules overlook. However, an algorithmic label doesn't guarantee reliable results. Your team still needs understandable inputs, sufficient outcomes, and clarity about which conversion event the system models.
Shortlist a simple baseline and a model that reflects your buying process. Don't choose the more complicated option merely because its dashboard looks more polished.
How Each Model Splits Credit for One Customer Journey
Consider a hypothetical SaaS demo-request journey. The buyer encounters paid social on day 1, arrives through organic search on day 9, engages with a webinar follow-up email on day 14, and clicks branded paid search on day 15 to book.
For this calculation, assume every interaction qualifies as a touchpoint and the full journey falls inside the reporting window. The percentages below are illustrative rule outputs, not measured channel effectiveness.
Credit split for one demo-request journey, by model
| Model | Paid social (day 1) | Organic search (day 9) | Webinar email (day 14) | Brand paid search (day 15) |
|---|---|---|---|---|
| First-touch | 100% | 0% | 0% | 0% |
| Last-touch | 0% | 0% | 0% | 100% |
| Linear | 25% | 25% | 25% | 25% |
| Time-decay, illustrative 7-day half-life | 9% | 20% | 34% | 37% |
| Position-based, illustrative 40/10/10/40 split | 40% | 10% | 10% | 40% |
| Data-driven | Estimated from path comparisons | Estimated from path comparisons | Estimated from path comparisons | Estimated from path comparisons |
Read across the journey
Paid social goes from receiving everything under first-touch to receiving nothing under last-touch. That reversal doesn't tell you that either report is broken. Each report answers a different accounting question.
Our explanation of first-touch attribution helps distinguish the first recorded introduction from everything that happens afterwards. In this scenario, organic search and the webinar email disappear under either single-touch rule, even though both belong to the recorded journey.
Linear gives those middle interactions visible credit. However, equal treatment isn't evidence of equal influence. The email might have answered the buyer's decisive question, or it might have reached someone already ready to book.
Read down the model choices
For the illustrative time-decay row, calculate each touch's raw weight as 2^(-days before conversion / half-life), then divide by the sum of all weights. The rounded outputs favour the email and branded search because they occurred closest to the booking.
The position-based row instead makes paid social and branded search joint leaders. Its middle shares follow the chosen convention, not an estimate of what the buyer would have done without those interactions.
A literature review of attribution modelling documents how allocation methods can change channel recommendations, including the risk that last-click undervalues content-integrated activities.
The customer journey hasn't changed. Your channel ranking has changed because you changed the credit rule.
A data-driven row can't be filled from this successful journey alone. It needs comparisons across other paths. Export a completed journey from your own CRM, apply competing rules, and identify which funding decisions would change before accepting either ranking.
How Data-Driven Attribution Assigns Credit
A data-driven model estimates how the predicted chance of conversion changes across paths with different interactions. A channel can receive credit because its presence is associated with a change in that estimate, not just because it appeared near the purchase.
Google's data-driven attribution documentation describes comparing converting and non-converting paths. Inputs can include time to conversion, device type, interaction count and sequence, and creative type.
The comparison can be visualised as a journey, a comparison group, and a credit assignment.
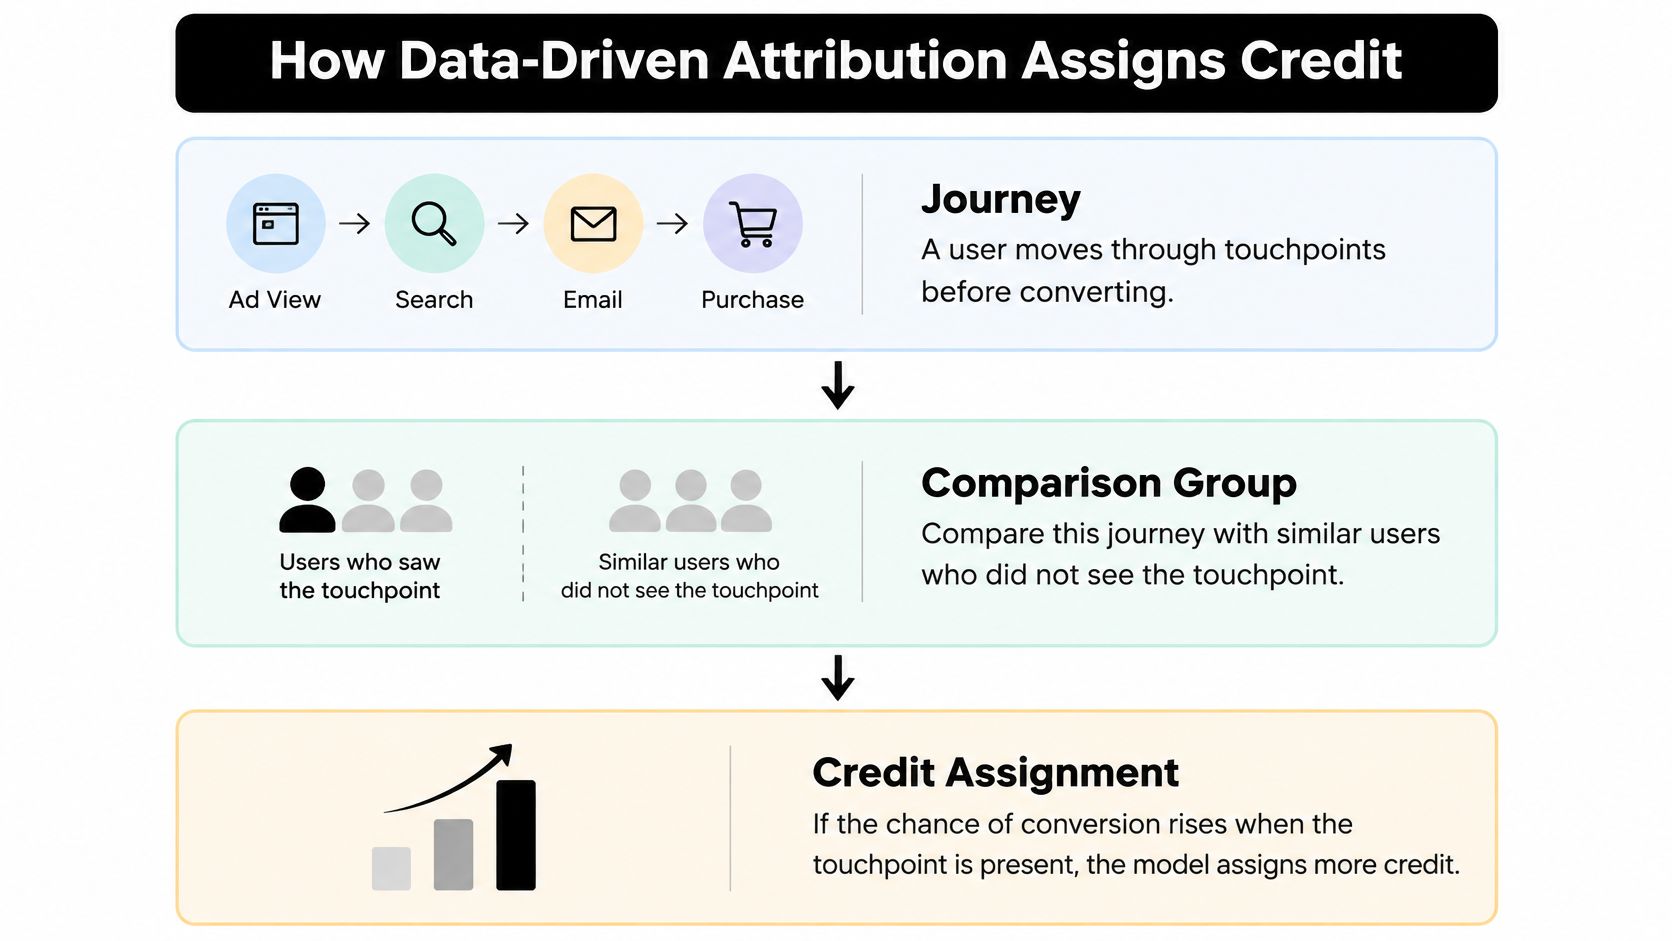
A retargeting ad might receive little credit if comparable buyers were already likely to purchase. A comparison article might receive more if its presence changes the model's predicted outcome. These are estimates across observed paths, not proof that either interaction caused an individual buyer to convert.
Preserve the inputs the model needs
- Complete path outcomes: Retain unsuccessful journeys as well as successful ones.
- Exposure timestamps: Record when each eligible interaction occurred.
- Identity matching: Preserve consented identifiers across devices and systems where possible.
- Conversion-stage fields: Distinguish enquiries, qualified leads, and closed revenue.
- Sufficient outcomes: Check whether the sample supports the level of detail in your reporting.
As a historical illustration of sparse-data constraints, Google's legacy Analytics documentation generally required at least 600 conversions within 30 days for data-driven attribution availability. That is not a universal current eligibility rule.
Before collecting identifiers, document how data is collected, used, and shared, and check that those practices meet the privacy rules in your markets. A published privacy policy can illustrate how an organisation describes its practices, but your own disclosures must reflect your implementation.
Fractional credit doesn't mean fractional customers. It means the model distributes an outcome among interactions. To test whether those allocations are useful, compare model recommendations with holdout results and revenue, rather than treating a change in channel credit as proof of causal impact. Keep models specific to their advertiser and conversion event. A demo-request model may not describe paid subscriptions.
Metrics to Track and What Each One Tells You
A useful dashboard pairs channel credit with commercial outcomes and data coverage. Without that context, your team can mistake a reporting improvement for a performance improvement, or cheap acquisition for profitable growth.
Agree on metric definitions with RevOps and finance before comparing campaigns. MakeAutomation's lead generation KPI definitions and formulas can support that terminology exercise, particularly when teams use acquisition and qualification measures differently.
Build a dashboard with visible limitations
Assisted conversions: Count converting journeys in which a channel appeared before the closing interaction. This makes earlier participation visible, but assists aren't additional sales. Avoid adding assisted counts to completed conversions as though they were separate outcomes.
Conversion share by model: Compare each channel's credited proportion under competing rules. A substantial rank reversal deserves investigation. It can expose sensitivity to assumptions rather than a genuine change in buyer behaviour.
Cost per acquisition or qualified opportunity: Divide the relevant spend by the corresponding outcomes. Use the qualification stage your sales team accepts. A low cost per form fill can conceal poor fit, duplicate enquiries, or contacts that never become viable opportunities.
Return on ad spend tied to revenue: Connect advertising cost to closed revenue or recorded payments, with a consistent treatment of refunds and renewals. ROAS isn't profit, and an initial payment doesn't automatically represent the full economics of a recurring customer.
Time lag from first touch to conversion: Inspect the distribution, not just a convenient average. Set the lookback window around the buying process you observe. A window that ends before buyers typically close excludes relevant earlier activity.
Match rate and unattributed share: Define match rate as the share of eligible outcomes linked to an advertising interaction. State the denominator and matching method. A high rate doesn't prove the match is correct, while a low rate limits how confidently you can generalise from matched customers.
Keep measurement gaps visible
Don't redistribute unknown outcomes across the channels you can identify. Report them separately, and investigate whether missingness clusters around particular devices, sales processes, or customer groups.
Our guide to measurement in marketing provides context for connecting these operational measures to business decisions. Keep the dashboard focused on the decisions your team needs to make, rather than filling it with every available metric.
Reporting rule: Compare the same outcome, cohort, cost definition, and observation window before treating a difference as a channel advantage.
Review metrics across model choices and reporting windows. If the apparent winner changes with a small configuration change, investigate before moving spend.
How to Check Whether Your Model Is Accurate
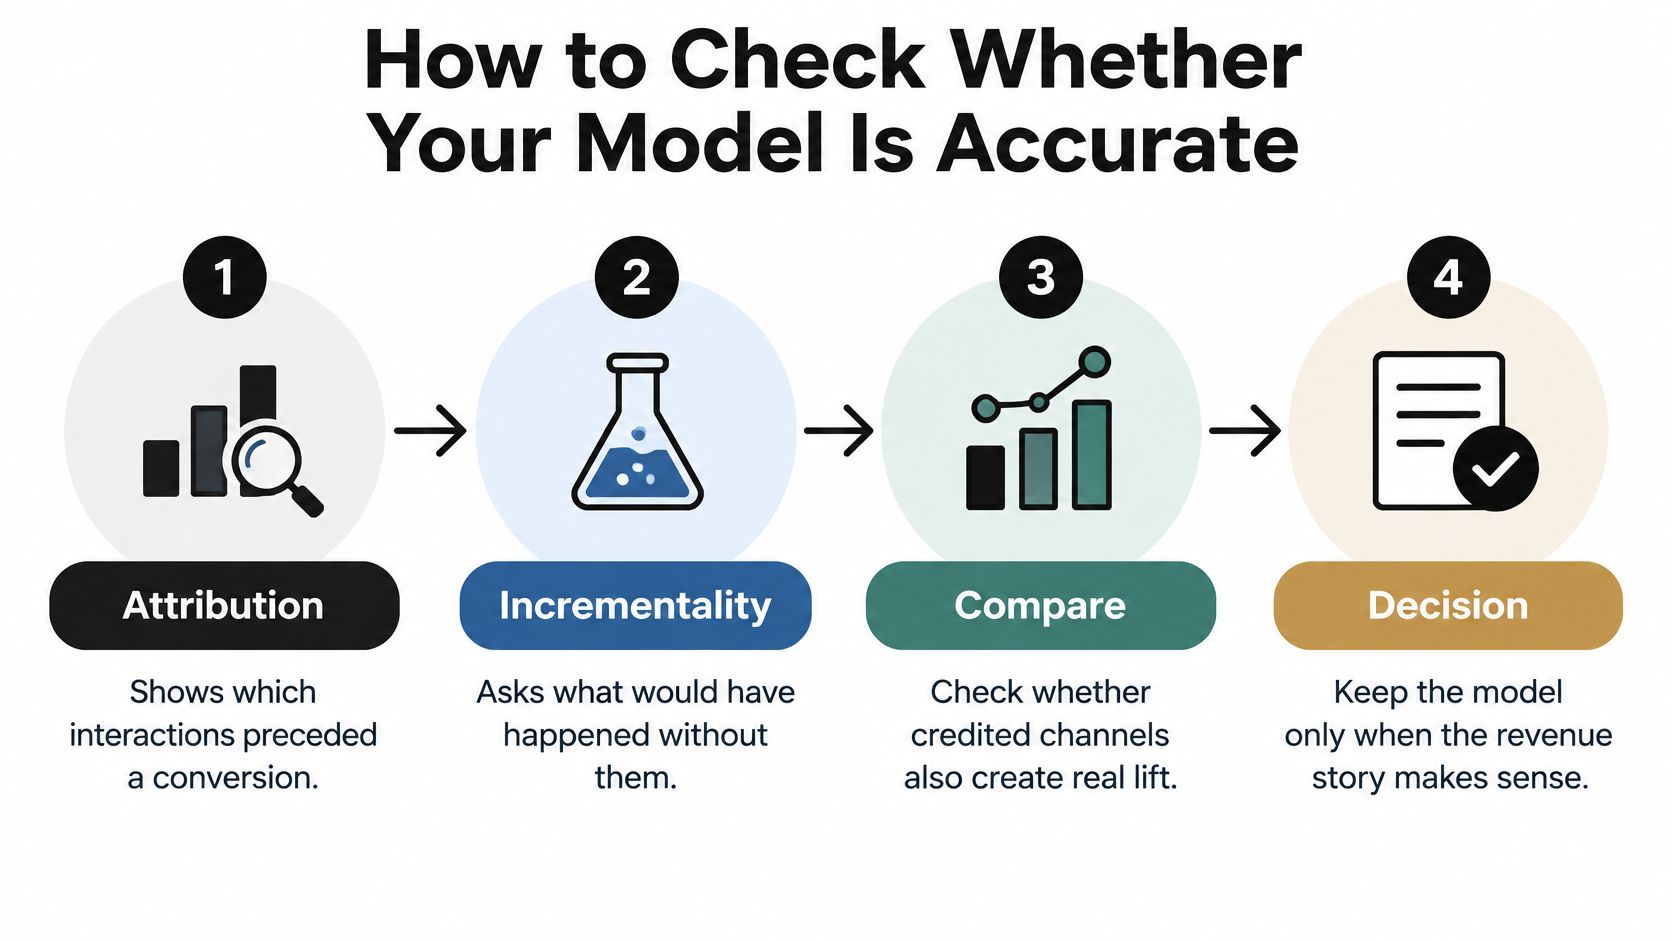
Attribution describes which tracked interactions preceded a conversion. Incrementality asks what would have happened without the marketing exposure. A channel can receive substantial credit while mostly reaching people who would have bought anyway.
A 2025 academic review on attribution and marketing measurement recommends triangulating multi-touch attribution with marketing-mix modelling and randomized incrementality tests as privacy changes complicate user-level tracking.
Use the following distinction when turning channel reports into decisions.
Audit the accounting before testing the recommendation
Compare channel rankings. Flag changes large enough to alter a funding decision. Record which assumption creates the reversal, such as prioritising recent interactions rather than introductions. Set your materiality threshold before reviewing results.
Reconcile credited totals. Sum fractional credit and compare it with the underlying eligible conversion count. Investigate duplicate events, excluded records, timezone differences, and mismatched reporting dates before interpreting channel shares.
Follow outcomes through the funnel. Rank channels at lead, opportunity, and closed-revenue stages. If an apparent acquisition winner falls behind after qualification, inspect lead quality and sales follow-up rather than averaging the discrepancy away.
Test whether credited channels create additional outcomes
Design a randomized holdout. Assign eligible people to exposed and withheld groups before delivery where feasible. Choose duration and sample size around expected effects, outcome frequency, and conversion lag. A convenient short test can miss delayed sales.
Use an appropriate experiment for major budget changes. Consider platform lift studies or carefully designed geo experiments when audience-level withholding isn't practical. Geographic tests need comparable markets and attention to spillover, seasonality, and simultaneous promotions.
Set confidence rules before optimisation. Define minimum usable outcome volume, aggregate sparse campaigns into meaningful channel groups, and report uncertainty. A small apparent shift shouldn't trigger automatic changes when the sample can't distinguish signal from variation.
Document and repeat. Save the model version, eligible audience, conversion definition, test conditions, and decision. Recheck after tracking changes, changes in the buying process, or substantial shifts in the channel mix.
A holdout evaluates a specific intervention in specific conditions. It doesn't certify every fractional allocation in the attribution report.
Use journey-level attribution to diagnose operational problems, experiments to validate causal claims, and broader modelling or blended financial analysis to guide strategic allocation. When those approaches disagree, investigate their scope and assumptions rather than declaring whichever result supports the preferred budget to be correct.
Pick Your Model and Confirm It Against Revenue
Starting model by buying situation
| Situation | Start with | Why it fits |
|---|---|---|
| Short purchase cycle with few touches | Last-touch, checked against linear | Provides a simple baseline with limited journey complexity |
| Long B2B cycle with many touches and CRM revenue | Position-based or time-decay | Makes introduction, nurturing, and closing visible under explicit assumptions |
| Enough conversions to train a model | Data-driven | Supports estimation from broader path patterns |
| Awareness-led brand campaigns | First-touch plus a lift test | Identifies tracked introductions while separately testing effect |
| Offline sales or cross-device journeys | Position-based with matched CRM revenue | Keeps the rule transparent while requiring disclosure of identity gaps |
Use the shortlist to guide a revenue review, not to declare a permanent winner.
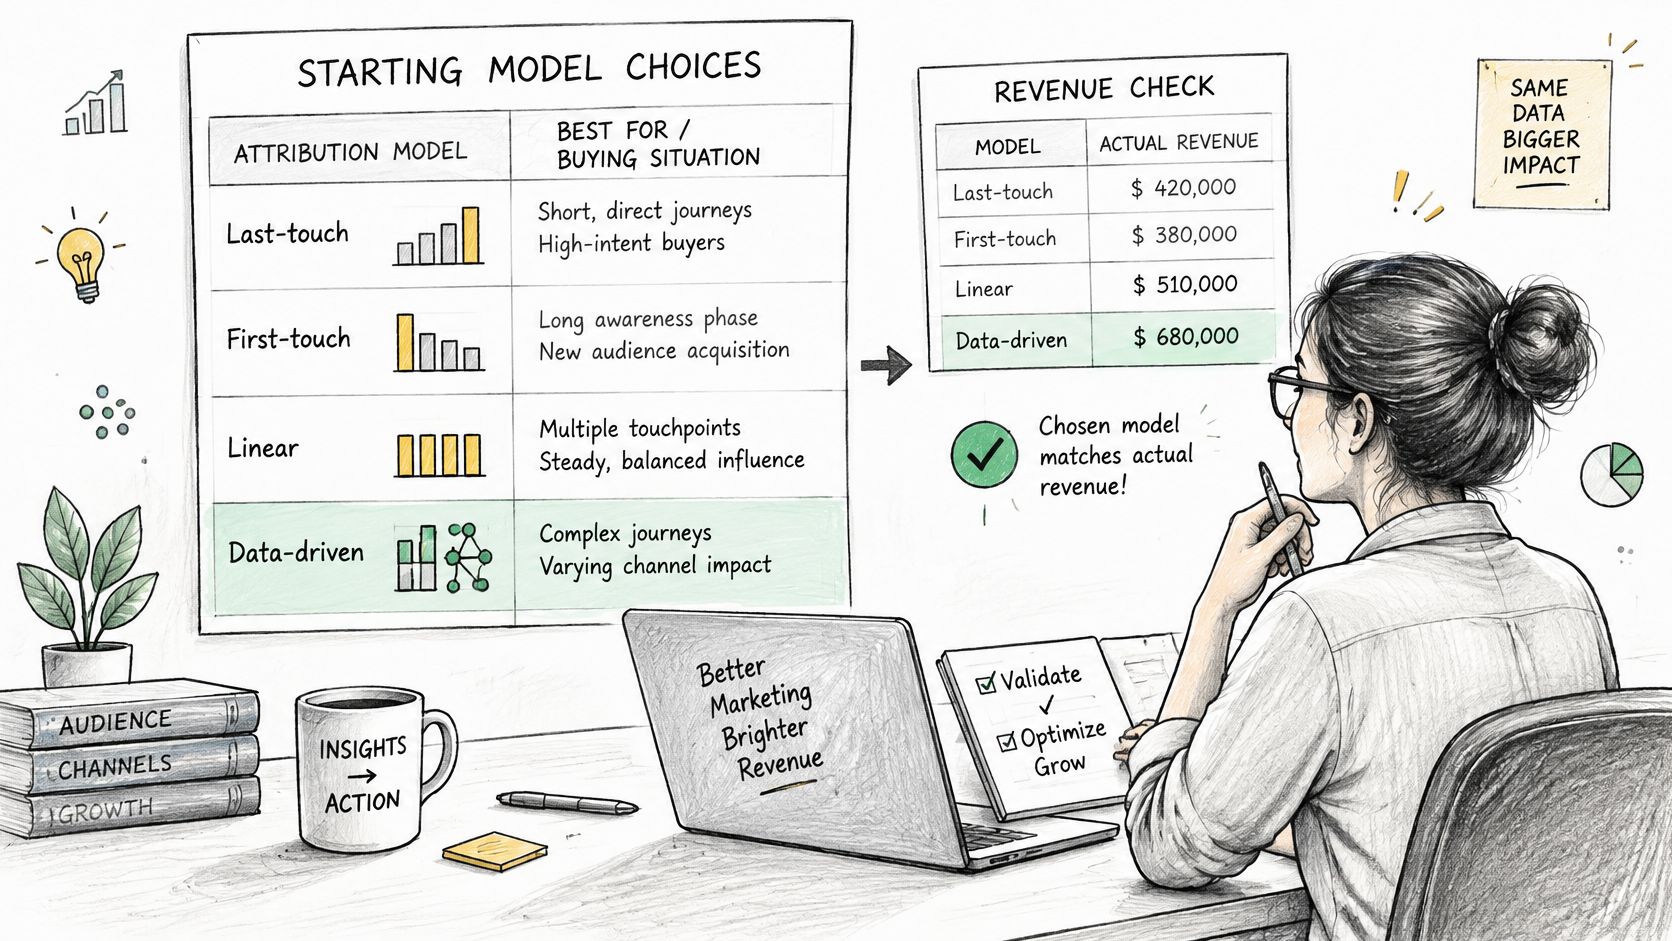
Separate revenue evidence from revenue allocation
Maintain distinct fields for observed revenue, matched revenue, modelled allocation, and unknown source. These aren't additive buckets: a payment can be observed, linked to a journey, and then allocated by a model. Keep the payment ledger authoritative and the source evidence inspectable.
Hashed first-party customer data can improve matching between advertising interactions and CRM outcomes. Google reports that advertisers using enhanced conversions for leads achieved 8% more measured Search conversions than standard offline conversion imports. That's improved measurement, not evidence that the implementation created additional sales.
Preserve event timestamps, deduplicate contacts and payments, and define account-level handling when several buyers influence a deal. Report match coverage, conversion lag, missing outcomes, and uncertainty alongside channel results.
For financial interpretation, SimpleLab Digital's marketing ROI formula and worked examples provide a reference for evaluating return beyond a credited-revenue column.
Use this video alongside the revenue-review discussion.
Our approach to closed-loop attribution connects acquisition reporting with downstream outcomes. At SourceLoop, we capture and send attribution data from every signup, lead, booking, and sale to your CRM and ad platforms, so those records can support the comparison.
Choose a baseline and a challenger model, compare them against closed revenue, and schedule a review before your next significant budget reallocation. Start by checking campaign tags with our free UTM Campaign Builder and UTM Validator, then use our Marketing Attribution Calculator to examine your allocation assumptions. Keep the model that supports a defensible revenue decision, and validate consequential changes with an experiment rather than a channel ranking alone.



 Paid Social


