
Digital Analytics for Marketing: A 2026 Guide
A practical guide to digital analytics for marketing: the metrics that matter, tracking setup, funnels, and when attribution is not causation.

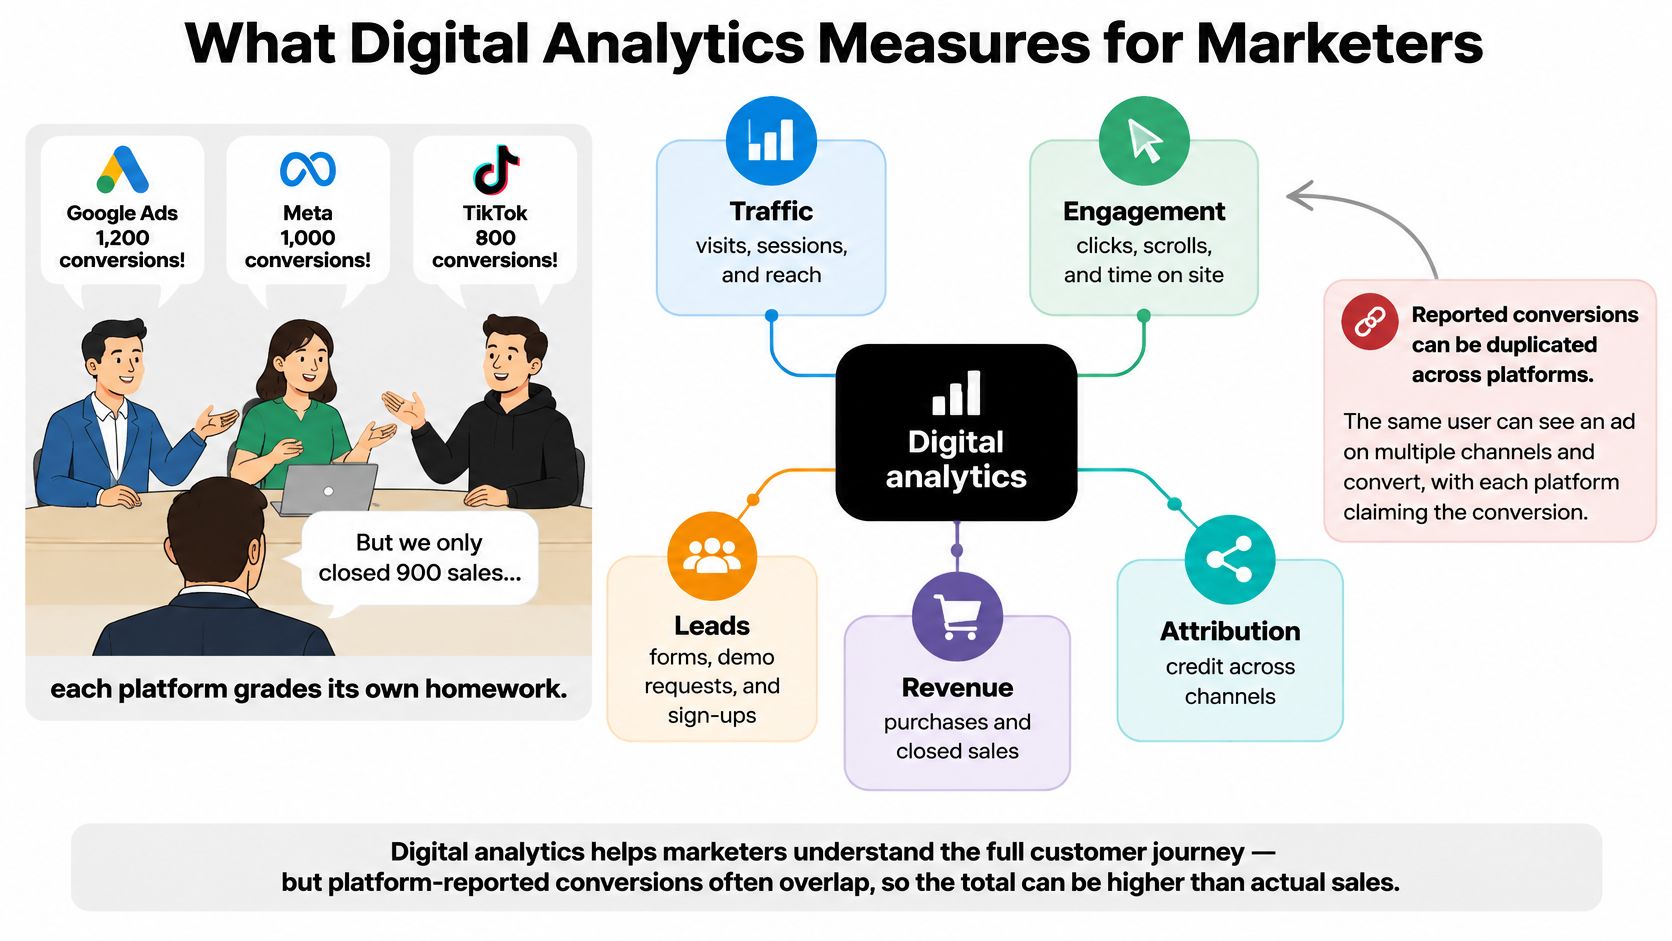
You're in the Monday budget meeting, and the math doesn't close. Google Ads reports one pile of purchases, Meta reports another, TikTok reports a third, and the orders that shipped are smaller than the sum. The same buyer can sit in three conversion columns because each platform grades its own homework. Finance asks which channel to scale. Nobody has a number that matches the bank deposit.
That gap is the job of digital analytics for marketing. It joins website, app, ad, and CRM events so a team can see which activity produces qualified leads, meetings, and revenue, not which ad system awarded itself the sale. Platform totals and model outputs are not the same thing as money collected.
I would not move a dollar until the observed conversion, the modeled estimate, and the invoice sit in three different columns. Journey credit is useful in the weekly ops meeting. It is not proof the channel caused the sale.
Table of Contents
- What Digital Analytics Measures for Marketers
- Marketing Metrics That Decide the Next Dollar
- How to Set Up Tracking From Click to Revenue
- Funnels Cohorts and Segments in Practice
- Attribution Credit Versus Real Incremental Lift
- Dashboards That Show What You Can Trust
- Decide What to Scale Test or Fix This Week
What Digital Analytics Measures for Marketers
Say the warehouse closed 31 orders and the three ad accounts together claim more than 80. The meeting stalls because everyone is defending a platform export. Digital analytics for marketing starts one step earlier than that argument. You record what a person did on your site or app, keep the click that brought them, and attach the outcome your sales or payments system recorded. Traffic is context. A qualified lead, a booked meeting, or closed revenue is the measurement.
The older habit was sessions and pageviews. A visit went up, a page loaded, and the report looked healthy even when nobody filled a form. Google's GA4 overview marks the break: Google introduced Google Analytics 4 in October 2020 as the successor to Universal Analytics, built on an event-based model meant to follow interactions across websites and apps. A prospect can see an ad, come back through organic search, open a chat, book a meeting, and pay weeks later. Events are how you name those steps instead of counting visits.
Events that replace vanity traffic
Replace "more visits" with actions someone can audit:
- Product view: they reached an offer, not just the homepage.
- Lead submit and signup: a form or account completed.
- Chat and booked meeting: a conversation or calendar hold, not a button click.
- Purchase and revenue: payment or invoice, with an amount.
An industry estimate in that same GA4 account put the tool on more than 15 million websites by 2025, after more than 21 million sites had used Universal Analytics. Scale does not make a session a sale. It does mean many teams now have an event model and still argue from platform exports.
The rule for every later decision is simple. A channel earns its keep when traffic becomes a qualified outcome. Rising visits, a pretty engagement chart, or a platform conversion total do not settle the budget. The working set is a short metric list, a click-to-revenue join, a funnel with one broken stage, a split between credit and causation, and one weekly call to scale, test, or fix.
Traffic is a clue. Revenue is the verdict.
Marketing Metrics That Decide the Next Dollar
| Metric | Question it answers | Typical signal | Misread to avoid |
|---|---|---|---|
| Sessions and users | How many people arrived | Context only, not a target | Treating traffic growth as success |
| Engagement rate | Did the visit do anything useful | Compare with your own baseline | Benchmarking unrelated site types |
| Conversion rate | Share of sessions that hit a business event | Lead gen often 2 to 5 percent; ecommerce often 1 to 3 percent | Optimizing a soft micro-conversion |
| Cost per acquisition | What a qualified lead or customer costs | Must beat margin or payback | Using a platform CPA alone |
| Return on ad spend | Revenue reported per ad dollar | Above 1 covers spend; the target follows margin | Adding platform revenues together |
| Pipeline or closed revenue | Did marketing create money | CRM stage or invoice, not the form | Stopping at lead count |
| New vs returning | New demand versus loyalty | Report the split by channel | One blended conversion rate |
Read the rows in the order you would change spend, not as a glossary.
Sessions and users only say the pipes are open. A 20 percent traffic jump after a broad match expansion can be cheaper clicks from people who will never buy. I would not put a traffic target on a scorecard.
Engagement rate is a diagnostic against your own last quarter. A content site and a pricing page should not share a benchmark. If engaged sessions rise while leads fall, the page is interesting and the offer is weak.
Rates, cost, and the money row
Conversion rate only helps when the event is a business event. For many lead-gen landing pages, a session-to-lead rate of 2 to 5 percent is a fair planning band. For many ecommerce stores, 1 to 3 percent session-to-purchase is a fair band. Both ranges are wide on purpose. Your own trailing 90 days beat a number borrowed from a different category. A scroll, a video play, or a "get the guide" click will inflate the rate and train the media algorithms on the wrong people.
Cost per acquisition means nothing until you set it next to gross margin or payback months. A $40 platform CPA looks cheap until the lead never reaches sales, or until product margin is $25. Pull CPA from qualified pipeline or from customers, and keep the ad account's CPA as a bidding input only.
Return on ad spend above 1 means reported revenue covered spend. It does not mean the business made money, and it does not survive if you add Google, Meta, and TikTok revenue into one total. Those columns overlap. Set the ROAS target from margin, returns, and the share of revenue you are willing to spend to acquire a customer. Then calculate it on deduplicated orders, not on three platform exports.
Pipeline or closed revenue ends the form-fill argument. A CRM stage or an invoice is the record. If marketing reports 400 leads and sales can name 80 that were real, the 400 is a volume clue and the 80 is the metric.
Do not blend new and returning
New versus returning answers two different questions. New visitors tell you whether demand generation works. Returning visitors tell you whether the site, email, and remarketing hold people who already know you. One blended conversion rate hides a paid social campaign that floods the site with one-time lookers and flatters a brand-search campaign full of people who were going to buy anyway.
Practical rule: Pick one volume metric, one efficiency metric, and one revenue metric. Ignore the rest until those three move.
Volume might be qualified leads. Efficiency might be cost per qualified lead. Revenue might be closed-won or net sales. If those three are flat, a prettier engagement chart is not a reason to raise the budget.
How to Set Up Tracking From Click to Revenue
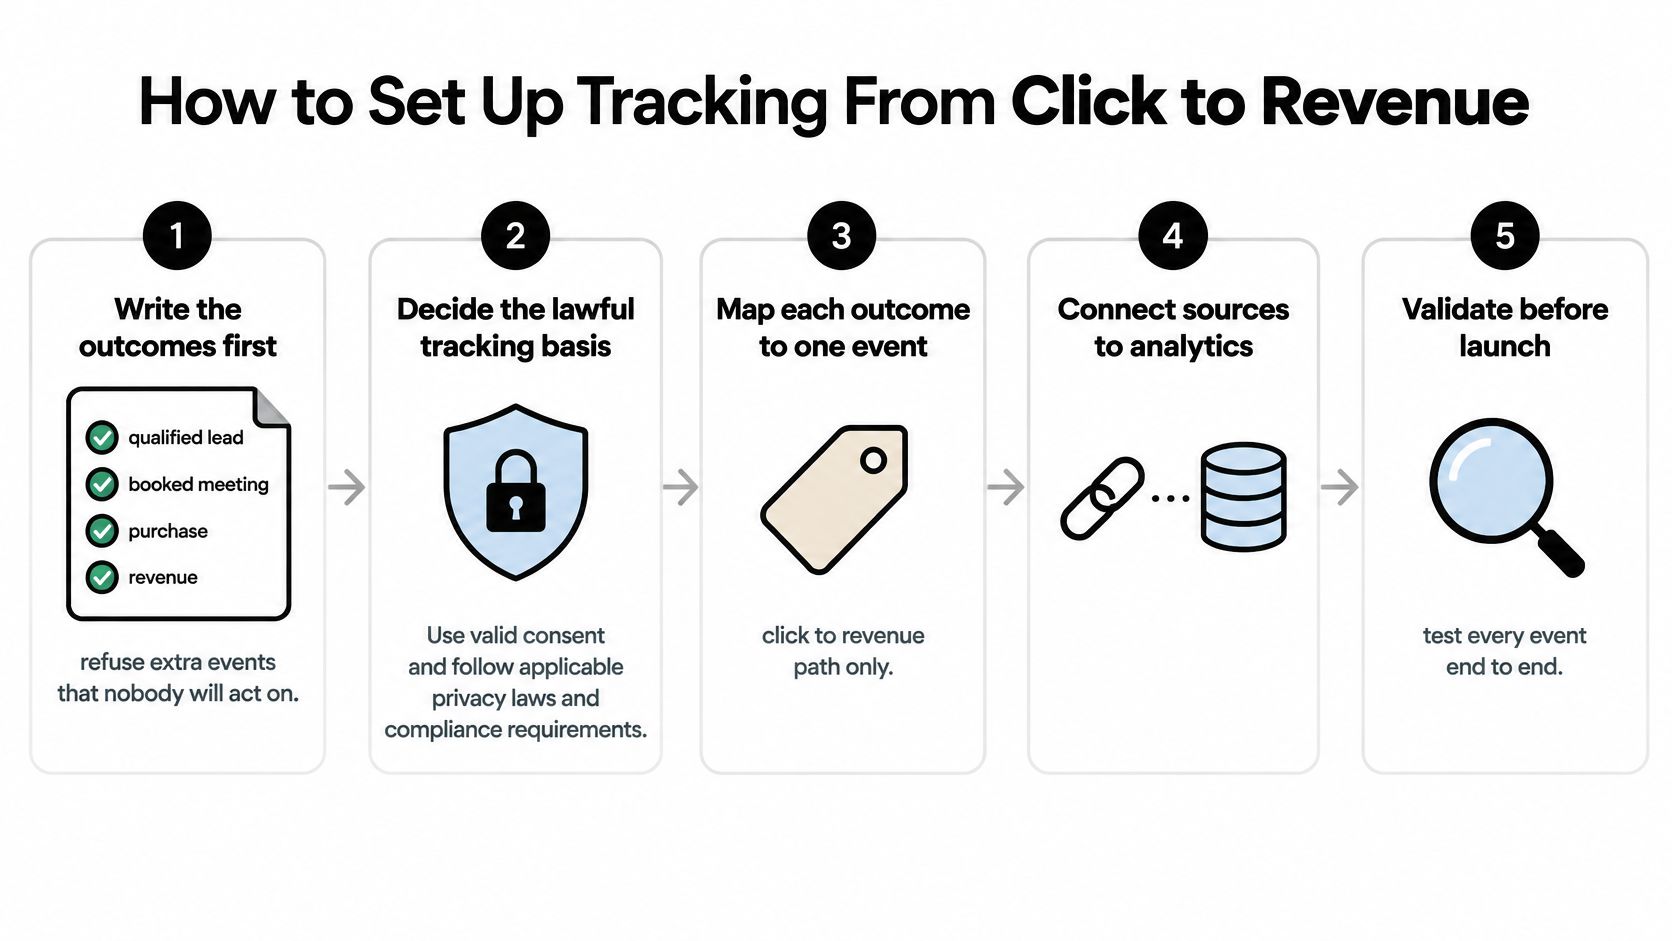
Write the path before you pick vendors. A tag manager loads tags. The analytics property stores events. A consent tool sets storage state before identifiers are written. Server-side collection keeps click IDs when the browser blocks a pixel. Teams comparing packaged analytics with a product-analytics stack can use why replace GA with PostHog as a plain look at ownership, events, and what you give up when you leave a default property. The sequence below works either way.
Seven steps and the way each one fails
- Write the outcomes first. Qualified lead, booked meeting, purchase, and revenue. Refuse extra events nobody will act on. Failure mode: a dashboard of micro-conversions that media platforms optimize while sales stays flat.
- Decide the lawful basis before tags fire. The EU's General Data Protection Regulation took effect on May 25, 2018 and set the benchmark for consent, transparency, minimization, access, and accountability. FTC-hosted privacy research from the GDPR rollout tracked a weekly panel of 1,084 analytics dashboards across 32 weeks in each of 2017 and 2018, and notes that Google aggregates sponsored-search data at the daily level partly for privacy, so hour-level precision on paid search is often gone. Failure mode: identifiers written before a lawful basis exists, so later you cannot tell a refused visitor from a broken tag.
- Standardize UTM source, medium, campaign, content, and term. Keep a short naming sheet so paid, email, and partner links do not splinter into "fb", "facebook", and "Facebook Ads". Failure mode: one campaign appears as six sources and looks too small to scale.
- Capture click IDs on the landing page. Store
gclidandfbclidas first-party data on your domain, next to the landing URL. Failure mode: the CRM has a lead and no click, so offline conversions cannot go back to the ad account. A practical pattern for how to track lead source is to persist that click with the form, rather than in a spreadsheet after the fact. - Fire the conversion from a durable path. A browser pixel alone is fragile: SourceLoop's server-side tracking captures 98% of conversions, compared with 62% for pixel-only tracking. Mark whether each hit was observed. Failure mode: iOS, ad blockers, and cookie loss delete the conversion and the channel looks dead.
- Write source, campaign, and click ID onto the CRM or payment record when a form, chat, call, or booking converts. Failure mode: marketing and sales reconcile by memory every Friday.
- Run one test lead per channel and confirm the event, the UTM, and the CRM field before you scale spend. Failure mode: a naming bug multiplies across a month of budget.
Credit recorded this way is operational. Each stored source and click ID shows a channel was present on the path; whether that channel caused the sale is a separate question, answered by lift tests and cohort comparison rather than by the tracking itself.
Direct and untagged visits still need rules. Use referrer data, landing-page heuristics, and direct-traffic detection so organic, referral, and true direct do not collapse into one bucket. A missing consent flag is a measurement gap rather than a dead channel. Advanced Consent Mode can load tags before the dialog and estimate unconsented journeys from consented ones. Store the consent state on the conversion so observed hits stay separate from modeled ones, and never write a modeled value into the CRM as if it were a named person.
The video below walks a click through to a recorded conversion if you want the sequence on screen before you touch production tags.
Five-minute check on the next lead
- Event: the business outcome fired once, not on the button click.
- UTM: source, medium, and campaign match the naming sheet.
- Click ID: present for paid, blank on purpose for organic.
- Consent: stored as granted, denied, or unknown.
- CRM or payment row: same person, same campaign, same amount.
If any line fails, fix that join before the next budget change.
Funnels Cohorts and Segments in Practice
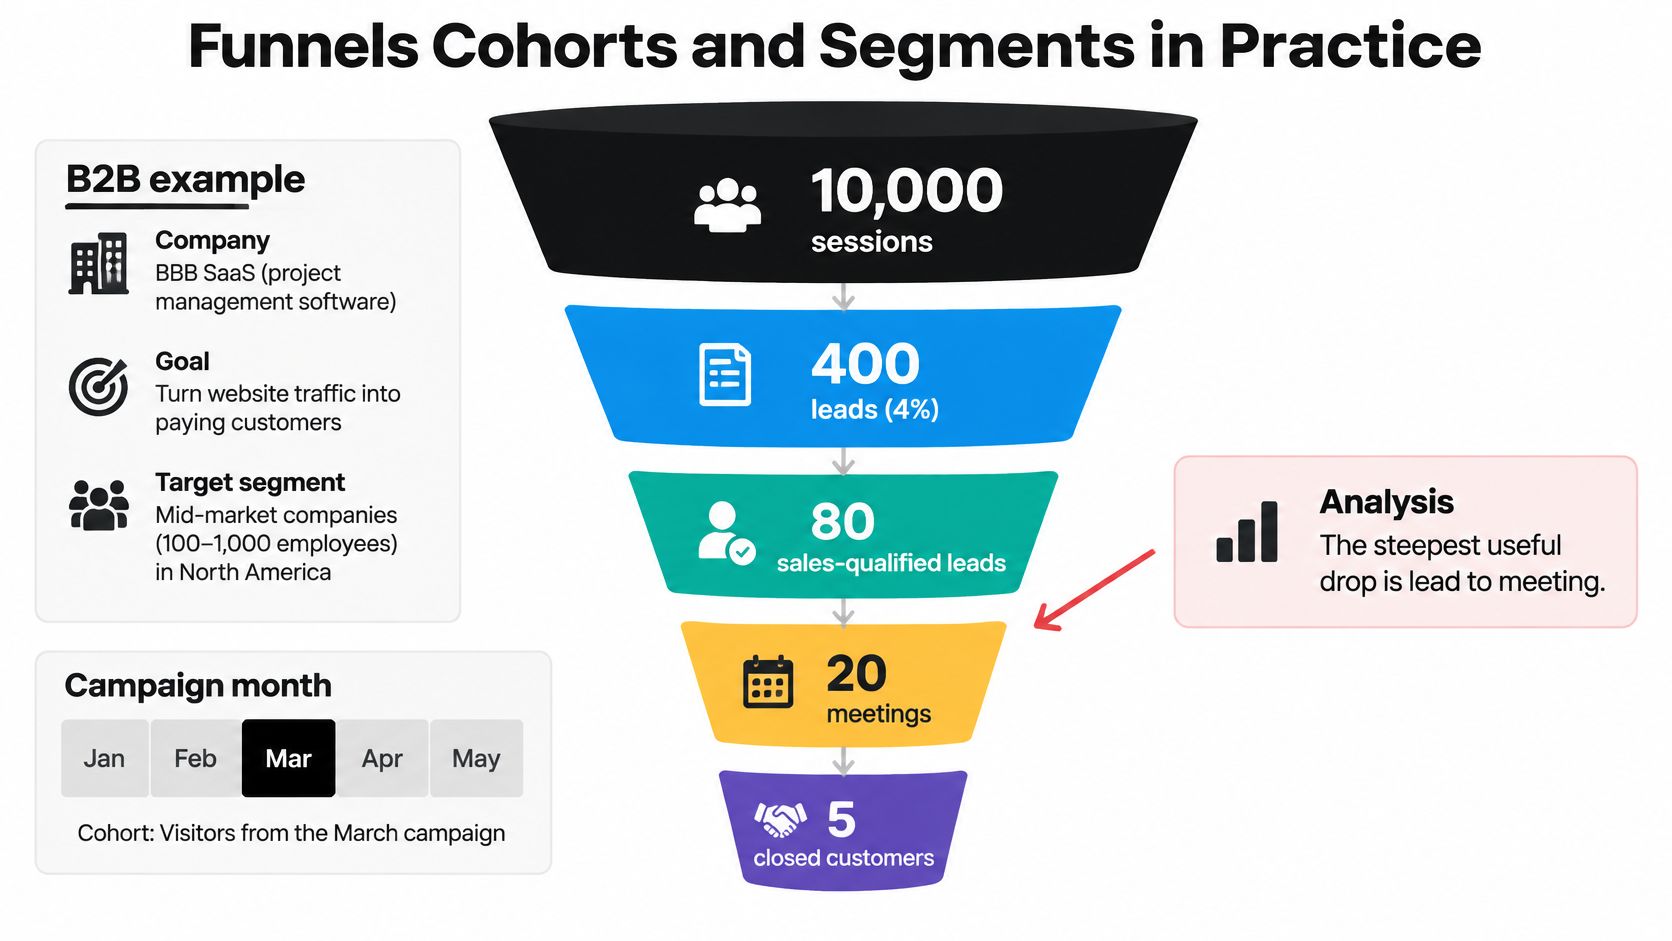
A B2B campaign month brings 10,000 sessions, 400 leads (4 percent), 80 sales-qualified leads, 20 meetings, and 5 closed customers. The session-to-lead step looks fine inside a 2 to 5 percent planning band. The ugly step is lead to qualified: 400 people raised a hand and 320 were not worth a seller's time. Buying more traffic repeats that waste. The next fix is lead quality or the offer.
Lag is not the same as failure
Take those same 400 leads as a cohort by signup week. Week 1 closes two customers inside 30 days. Week 4 has closed none yet. That is lag. A 30-day sales cycle cannot indict a lead created 10 days ago. Hold the recent cohort until it is as old as the one you trust, then compare close rate and revenue, not raw lead count.
Segment the 80 qualified leads by first channel, device, and new versus returning. Paid social might deliver cheap leads and almost no meetings. Organic search might deliver fewer leads and a higher close rate. Those are different problems. One needs a tighter form, a better offer, or a lower bid. The other may deserve more content or higher bids on queries that already qualify. A single "leads by channel" chart will tell you to feed the cheap source.
A funnel conversion analysis is worth building once the stages match how sales works, not how the ad account names conversions.
Same shape, different store
A DTC catalog uses the same idea with different stage names: product view, add to cart, checkout, purchase. The cohort is the week of first order, not the week of the first ad click, because repurchase and refunds show up after the click report has gone quiet.
One edge breaks a lot of funnel reviews. A funnel that starts at the ad click hides people who leave and come back through branded search. Keep a second view that starts at the first visit, with the ad click as a touch rather than the only door. Otherwise brand search looks like the hero and the ad that started the relationship looks idle.
Mark the single stage where your own volume dies. Ignore stages upstream of that until it moves. If meetings are the cliff, another 2,000 sessions will not hire you a closer.
Attribution Credit Versus Real Incremental Lift
A retargeting campaign collects a stack of assisted conversions and a beautiful ROAS. Then you hold out 20 percent of the audience and sales barely dip, because those buyers were already on the way to purchase. Journey credit answered who touched the buyer. It did not answer whether the buyer would have converted anyway.
A 2025 Google and BCG survey found that only 44 percent of senior marketing analytics professionals use attribution, marketing-mix modeling, and incrementality experiments together, even though 80 percent of U.S. senior analysts say incrementality insights have a high impact on revenue growth. BCG also reports that nearly one-third of marketers call cross-channel media-effectiveness evaluation their biggest measurement challenge, and it recommends checking model assumptions with real-world experiments.
| Method | Question it answers | Use it for | Do not use it to |
|---|---|---|---|
| Multi-touch attribution | Which touches appear on converting journeys | Weekly creative, keyword, and campaign ops | Prove the channel caused the sale |
| Holdout or geo test | What happened versus a group that did not see the channel | Checking a channel that looks too efficient | Daily bid or creative tweaks |
| Marketing-mix modeling | How spend levels relate to aggregate outcomes | Annual or quarterly budget shares | A single ad variant |
| Platform-reported conversions | What the ad system thinks it earned | In-platform bidding feedback | A cross-channel total |
Give each method one job
Multi-touch attribution is operational credit. Use it to see that a creative, a keyword, or a partner link keeps showing up on journeys that become qualified pipeline. Change the ad, the query, or the landing page from that pattern. Do not treat the credit split as causation. Last-click versus linear versus time-decay only changes how you divide the same observed journey. None of those names creates a control group.
A holdout or a geo test is what you run when credit looks too good. Retargeting, brand search, and affiliate coupons fail this test often. In the conflict case, cut or cap the channel even though the attribution report objects. The test is too slow for Tuesday bid changes. It is the right tool before you double a line that already looks efficient. If you are unsure how long a view should count, setting a view-through attribution window is a concrete walkthrough of the window choice, which is a credit rule, not a lift result.
Marketing-mix modeling earns its place once you have enough history to relate spend levels to aggregate outcomes. Use it for annual or quarterly shares across channels, including channels with no click. Do not ask it which headline won last week.
Platform-reported conversions stay inside the ad system so bidding has feedback. They are not a cross-channel total. Adding them double-counts the Monday meeting you started in.
How to reconcile a fight between reports
Use first-party journeys to spot the pattern. Classify outcomes as qualified pipeline or revenue, not as raw form fills. Run a periodic controlled test on the channel whose credit looks extreme. Only then change the annual mix. For a fuller pass at advertising effectiveness measurement, keep the test design and the credit report in separate columns so a pretty ROAS cannot replace the holdout.
Optimize incremental growth, not the credit report.
Dashboards That Show What You Can Trust
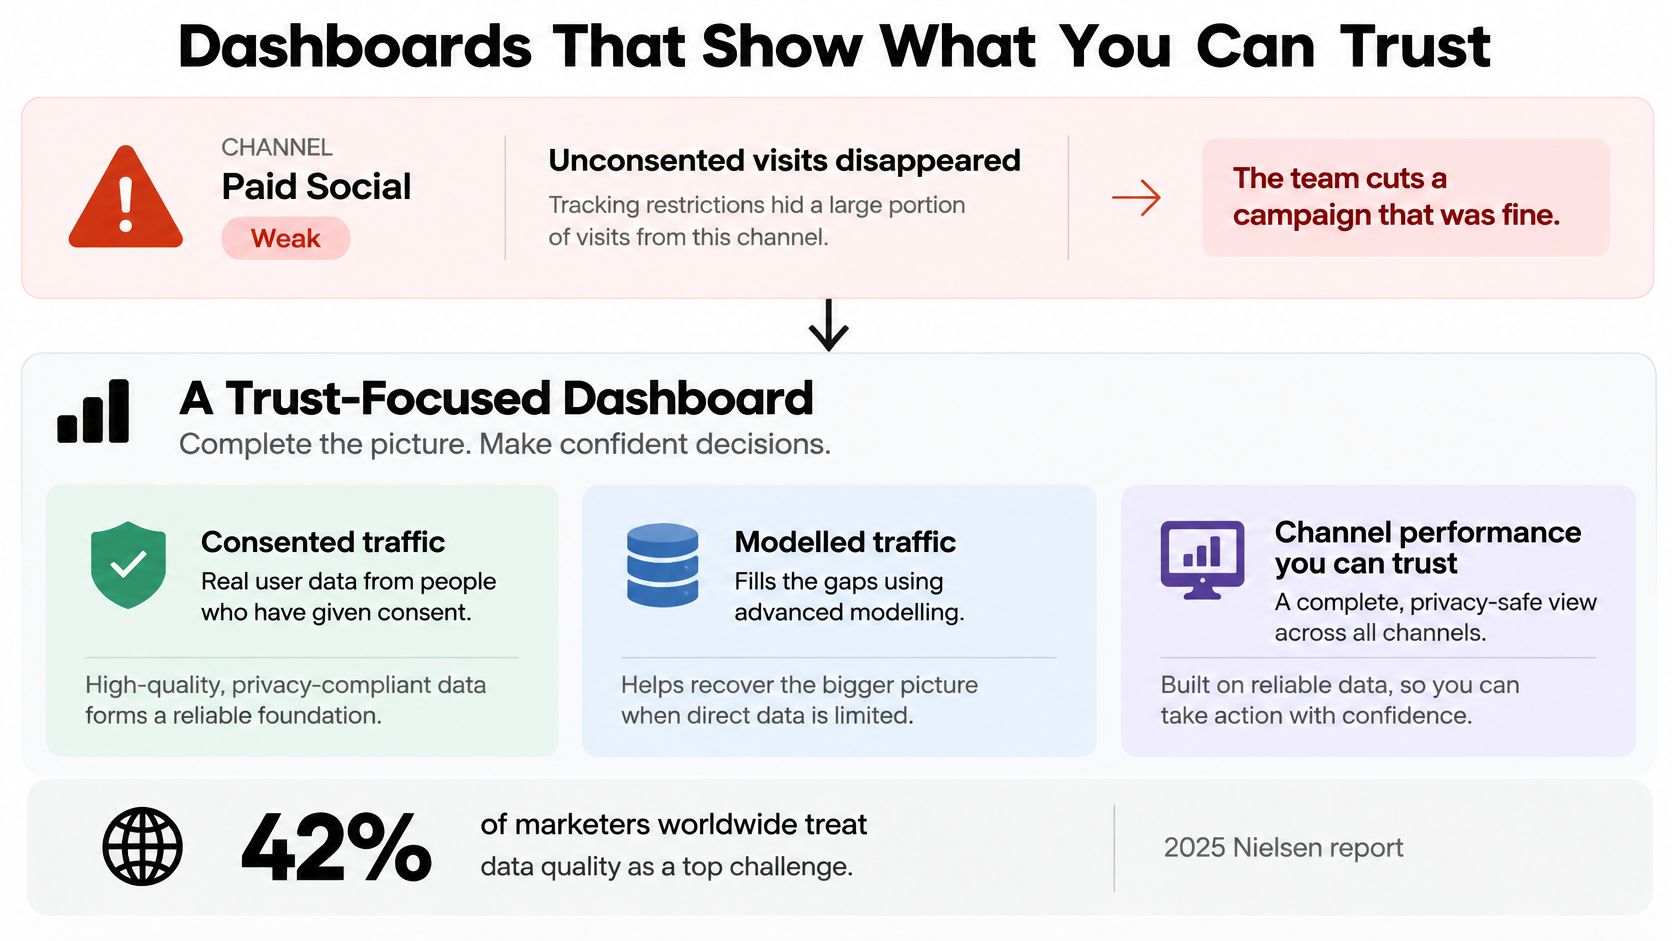
A channel looks weak on Monday because unconsented visits never reached the pixel, so the team pauses a campaign that was fine. The report did not show a demand problem. It showed a collection problem. Consent gaps, browser restrictions, and model fills all produce that false dip, and an automated bidding rule will keep spending against it until someone reads the rows underneath.
A 2025 Nielsen report on AI in marketing describes broad adoption of AI in measurement alongside persistent concern about privacy rules and cookieless browsing. Recent reviews of attribution research add a sharper caution: deep-learning models can improve predictive accuracy, but their credit assignments are not causally identified without experiments, and privacy techniques such as differential privacy trade some precision for protection. Better prediction is still prediction. A tighter privacy budget widens the error bar you are pretending is a decimal point.
That is the frame for the whole screen. Attribution credit is an operating convention that tells bidding where to look. It is not proof that a channel caused revenue. The dashboard's job is to keep the two kinds of numbers apart so credit can do its job without impersonating lift.
Observed rows and modeled rows
Split every conversion view into observed and modeled. Keep consent state, country, device, timestamp, and model version on the row, because those fields explain why a number moved. Calculate CPA and revenue twice. Observed only is the audit number finance can tie to a CRM record or a payment. Observed plus modeled is the planning number, and you watch the gap by country, not with one site-wide fudge factor. Consent rates, browser mix, and conversion propensity differ by market, so a single multiplier makes a healthy country look worse and a thin one look better.
Google's consent-mode guidance sets the minimum scale before modeling is even eligible: at least 1,000 daily events with analytics storage denied for seven days, at least 1,000 daily users with storage granted on seven of the previous 28 days, and about 700 ad clicks over seven days per country-and-domain grouping for Google Ads conversion modeling. Google's impact report defines consent-mode impact as modeled conversions divided by observed conversions, measured at domain-by-country level, refreshed weekly, and it may appear about seven days after launch.
| Check | Threshold | If you are short |
|---|---|---|
| GA4 behavioral modeling | 1,000 denied-storage events a day for seven days, and 1,000 granted users on seven of the prior 28 days | Plan from observed behavior only |
| Google Ads conversion modeling | About 700 ad clicks over seven days per country and domain | Keep that country observed-only |
| Consent-mode impact | Modeled divided by observed, domain by country, refreshed weekly | Do not apply one site-wide factor |
| First usable read | About seven days after launch | Do not judge a banner or tag change on day one |
What belongs on the weekly screen
Four tiles are enough:
- Revenue by channel: deduplicated, from CRM or payments.
- Observed versus modeled: with the gap called out by country.
- The funnel stage that is stuck: one stage, not twelve.
- One experiment in flight: the holdout or geo test, with an end date.
Guardrails matter more than another chart. Investigate jumps that follow a consent banner or a tag change before you treat them as performance. Show a range when the model is thin, not a false decimal. A person approves any budget move a model recommends, because the model is reporting credit, not causation. Organic reporting has the same honesty problem, and the guide on why SEO tracking metrics matter makes the case for keeping rankings, clicks, and revenue in separate tiles so a traffic bump cannot pose as pipeline.
When a market sits under the modeling bar, leave its tile observed-only and label it that way rather than filling the gap with an estimate nobody can audit. An honest blank beats a manufactured decimal. The reader should be able to tell, before any budget moves, which rows were measured and which rows were inferred.
Decide What to Scale Test or Fix This Week
In 2025, 32 percent of global marketers said they measure traditional and digital media spending fully, according to Nielsen's survey of 1,400 marketing professionals. Many teams are not there. Start from one digital revenue or qualified-pipeline figure finance already accepts, for the last 28 days, and leave every other system out of this pass.
- Pull observed revenue or qualified pipeline by channel. Leave modeled rows out. If a country is below the modeling bar, it is already observed-only. You want the number a controller can match.
- Name the single funnel stage where volume dies. Fix that stage, not the traffic above it. A lead-to-meeting cliff is a quality or sales-response problem. More sessions will not move it.
- Scale the channel whose revenue still holds after you remove view-through conversions and same-day branded search. What remains is closer to demand you might lose if you cut the spend.
- Park extra spend on any channel whose attribution looks strong but has no holdout or geo test. Put that test on the calendar. Credit can keep the current bid. It cannot justify a raise.
- Fix the one broken join. It is usually a missing click ID, an unstored consent flag, or a form that never reaches the CRM. Then send one new test lead and read it end to end.
One sentence finance can check
Write the decision as scale, test, or fix, and put the revenue number beside it. "Scale non-brand search, $42,000 observed pipeline, view-through and same-day brand removed." "Test retargeting, credit is high, no holdout yet." "Fix the demo form, click ID never lands on the contact."
Server-side collection is the practical difference when the pixel is the broken join. It captures 98 percent of conversions, compared with 62 percent for pixel-only tracking. The snippet should record source, campaign, click ID, and landing page on your own domain as first-party data. More than 750 marketing teams, agencies, and SaaS companies already run that pattern. When the join is the blocker, SourceLoop can store source, campaign, and click ID on your domain and pass the qualified outcome back to the CRM. If you are not ready for that, keep the UTM sheet until the test lead carries its campaign without a manual paste.
Scale, test, or fix. Put the revenue figure next to the verb, or do not take the decision to finance.
Pick one channel from last month and run the five checks before Friday's budget call. If the click ID, the consent flag, or the CRM field fails, fix that join first. When you want the visit, the campaign, and the closed dollar on one record, start a SourceLoop trial and send a single test lead through your busiest form. Do not raise spend until that lead shows the source your finance lead can verify.



 Paid Social


