
How to Calculate Return on Ad Spend: Formula and Examples
Learn how to calculate return on ad spend with a step-by-step formula, worked examples, and fixes for multi-touch attribution and lifetime value.
In 2025, more than three-quarters of surveyed U.S. advertising buyers said they expected or were already seeing higher return on ad spend from generative-AI implementation, according to TD Securities' survey of 54 senior ad buyers representing roughly $26 billion in advertising spend. Every one of those buyers will eventually face the same awkward question. Did the number improve, or did the definition change?
A campaign with $10,000 of spend and $50,000 of attributed revenue has a revenue ROAS of 5.0x. Adjust the numerator for a 40% gross margin and it reads 2.0x. Replace attributed revenue with the revenue the ads caused and it can fall to 1.5x. One campaign, three defensible figures, three different budget decisions. Calculating ROAS well is less about the division and more about knowing which numerator you're dividing, and why.
Table of Contents
- ROAS Formulas and When to Use Each
- How to Calculate ROAS in Four Steps
- Worked ROAS Examples for Ecommerce and Lead Campaigns
- Adjusting ROAS for Attribution Models and Modeled Data
- Attributed ROAS Versus Incremental Return
- Adding Lifetime Value and Offline Revenue to ROAS
- Confirm Your ROAS Before You Move Budget
ROAS Formulas and When to Use Each
ROAS is one division: conversion value ÷ ad spend, reported as a multiple or a percentage. A campaign that returns $24,000 of attributed revenue on $6,000 of spend reads 4.0x, or 400%. The fragile part is the numerator, because "conversion value" can mean four different things and each one points to a different budget decision.
Marketing Brew's 2025 advertising and marketing report places ROAS among the most-used metrics for measuring marketing spend. That reach hides a comparability problem: two teams can both report 4.0x while one counted booked revenue and the other counted lead value.
| Metric | Formula | Use it when |
|---|---|---|
| Revenue ROAS | Conversion value ÷ ad spend | Comparing campaigns that sell products with similar margins |
| Margin ROAS | (Revenue × gross margin rate) ÷ ad spend | Product or fulfillment costs are material |
| Incremental ROAS | (Sales with ads minus estimated sales without ads) ÷ ad spend | You need to know whether ads caused the sales |
| Expected-value ROAS | (Leads × P(qualified) × P(closed given qualified) × deal value) ÷ ad spend | Form fills are not revenue and sales cycles are long |
Each row answers a different question. Revenue ROAS asks which campaign sells more. Margin ROAS asks whether selling more still clears the cost of goods. Incremental ROAS asks whether the ads caused any sale that would not have happened anyway. Expected-value ROAS asks what an unclosed lead is worth before the pipeline proves it.
Pick by decision, then freeze the basis. Creative testing can use revenue ROAS because product, price and margin are held constant. Scale decisions need margin ROAS. Channel budget reviews need incremental ROAS. Lead campaigns need expected-value ROAS until closed revenue catches up.
Two guardrails make any row usable. Numerator and denominator must share currency, dates, refunds, taxes, discounts and campaign scope, or the gain comes from inconsistent accounting rather than better advertising. And ROAS is not ROI: ROI subtracts cost, while ROAS only divides value by spend. A 4.0x revenue ROAS at a 30% gross margin returns 1.2x gross profit per dollar of spend, a 20% ROI after ad cost and before overhead.
Benchmarks are the weakest input. Quartile's 2023 benchmark report measured Amazon DSP ROAS up 25% year over year across more than 5,300 retail brands, which describes that auction more than your cost structure. Compare every ROAS with break-even first: the revenue multiple needed to clear margin, then the margin multiple needed to clear operating cost. When the number sags, the cause usually sits in the offer or the creative rather than the formula, and ad creative basics for SaaS marketers covers what to test first.
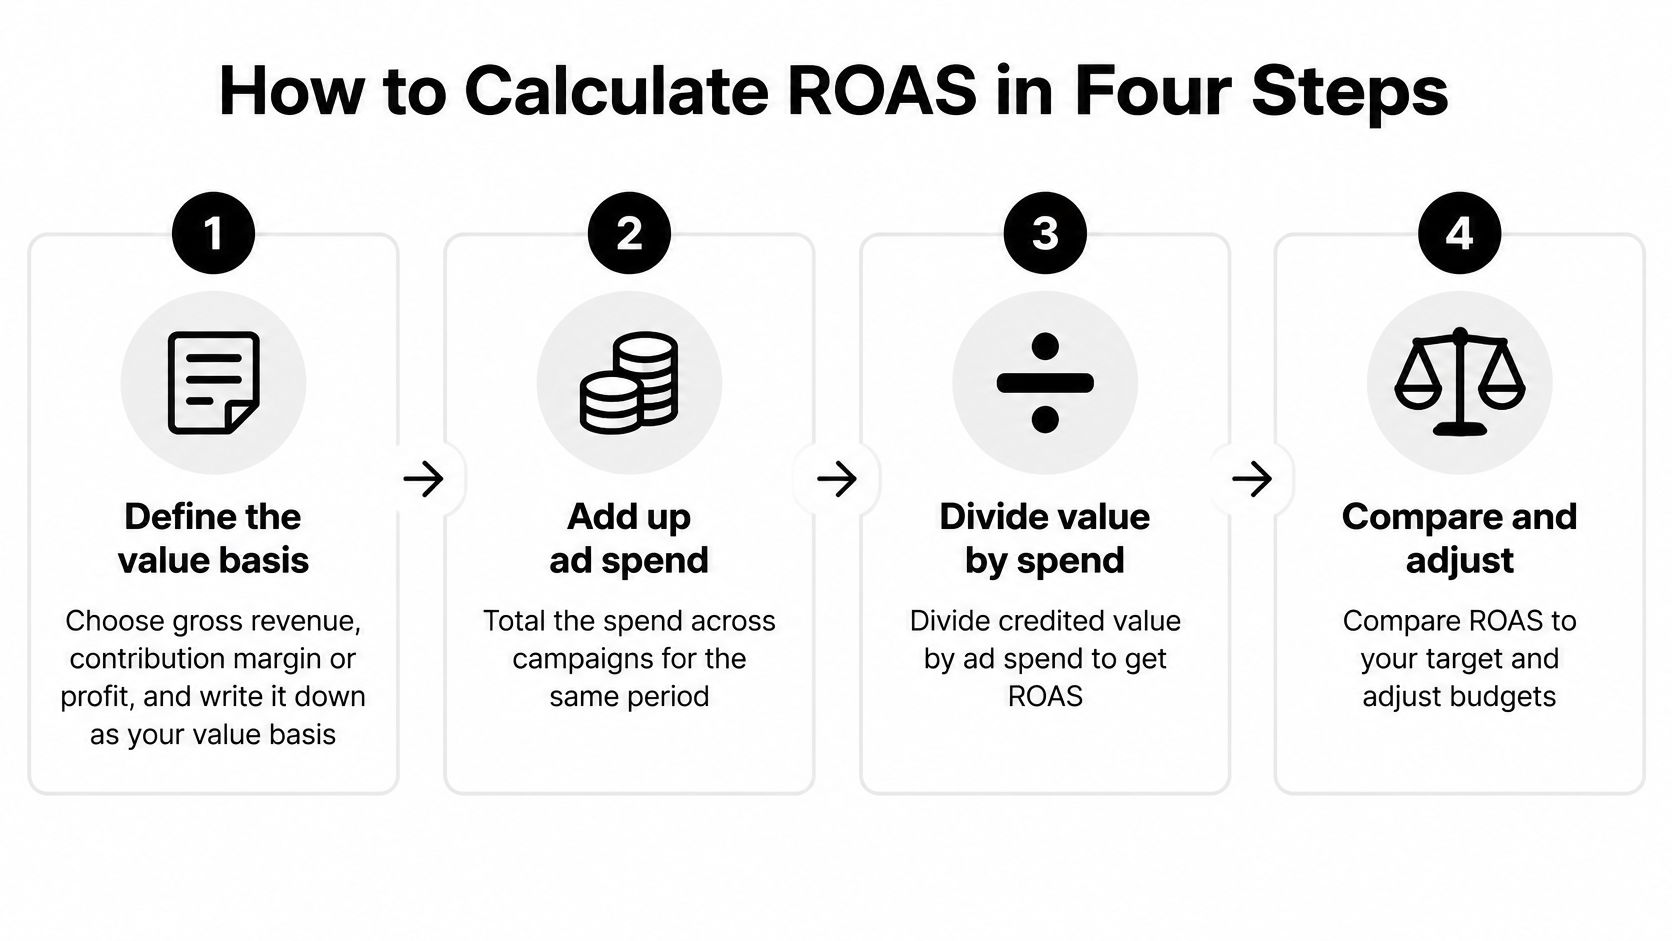
How to Calculate ROAS in Four Steps
Four decisions and one division. Skip any of the decisions and the division still returns a number, which is the problem: it looks precise and means nothing.
Define the value basis. Choose gross revenue, contribution margin or profit, and write the choice down. The basis moves the answer more than any optimization does, and a report that doesn't name its basis can't be compared with one that names a different one. The common slip is letting one dashboard report revenue and another report margin.
Assign value to every eligible conversion. That includes qualified offline outcomes such as signed deals or attended appointments, not only the form fills the ad platform can see. Counting only the pixel-visible conversion undervalues long sales cycles and overvalues cheap, low-quality leads. The slip here is treating a form fill as revenue while the deal is still three calls away.
Select one attribution rule and one conversion window. Both are inputs to the arithmetic, and changing either moves the number without any change in performance. Freeze them for the reporting period and print them beside the figure. Teams get caught switching from a 7-day to a 30-day window mid-quarter and calling it a turnaround.
Divide attributed value by spend for the same period. Same dates, same currency, same campaign scope. Pulling revenue for a calendar month and spend for a 30-day rolling window is the most reliable way to manufacture a win that never reaches the bank account.
What the division looks like with real numbers
Take $50,000 of attributed conversion value from $10,000 of ad spend. That's 5.0x, or 500%. Google applies the same arithmetic in its "conversion value per cost" metric, dividing total conversion value by the cost of all ad interactions, and its target-ROAS example uses $5 of value per $1 spent to produce a 500% target (Google Ads help).
Now apply margin. At a 40% gross margin, the same $50,000 becomes $20,000 of gross profit, so the margin ROAS is 2.0x. The break-even ROAS is 1 divided by the margin rate, which is 2.5x at 40% margin. The campaign clears break-even by roughly double before a dollar of shipping, payment fees or staff time is counted.
A healthy result, then, is not a big multiple. It's a number that clears break-even and holds across at least two full conversion windows, which is the thinnest evidence that the performance is real rather than a good fortnight.
Worked ROAS Examples for Ecommerce and Lead Campaigns
Start with the case often misread. An ecommerce campaign spends $10,000 and reports $50,000 of revenue, a clean 5.0x. Then the margin column lands. At a 25% gross margin, the same business reporting 4.0x on $40,000 of revenue ends up with a 1.0x gross-profit return before shipping, payment fees and staff time. Multiply it out: $40,000 of revenue at 25% is $10,000 of gross profit, exactly the $10,000 of spend. The campaign pays for its media and contributes nothing else.
The revenue line looks healthy in both versions. The margin line is the one that tells you whether you can afford another $10,000.
The lead campaign, step by step
Lead generation needs the expected-value variant because the conversion isn't revenue yet. Say a campaign spends $8,000 and returns 100 leads. Historically, 40% of those leads qualify, and 25% of the qualified ones close at an average deal size of $3,000.
- Qualified leads: 100 × 0.40 = 40
- Closed deals: 40 × 0.25 = 10
- Expected revenue: 10 × $3,000 = $30,000
- Expected-value ROAS: $30,000 ÷ $8,000 = 3.75x
- Margin-adjusted: $30,000 at a 35% margin is $10,500, or roughly 1.3x
Cost per lead is $80. Cost per closed deal is $800. The form-fill count alone suggests $80 buys a result; the closed revenue says $800 buys a customer, and those are different purchases.
| Scenario | Ad spend | Conversion value | ROAS | Margin-adjusted ROAS |
|---|---|---|---|---|
| Ecommerce, 40% gross margin | $10,000 | $50,000 revenue | 5.0x | 2.0x |
| Ecommerce, 25% gross margin | $10,000 | $40,000 revenue | 4.0x | 1.0x |
| Lead generation, 35% margin on closed deals | $8,000 | $30,000 expected revenue | 3.75x | 1.3x |
Treat the layout as a format to copy, not a benchmark to beat. Fill in your own spend, conversion value, revenue ROAS and margin-adjusted ROAS for every campaign, then read the rows against each other. Rerun the arithmetic with your own inputs before comparing campaigns, because a result that looks strong in one row turns weak in another once margin is applied.
Adjusting ROAS for Attribution Models and Modeled Data
The attribution rule is part of the calculation, not a setting hidden somewhere in admin.
| Model | How credit is split | Best used for | Main risk |
|---|---|---|---|
| Last-click | 100% to the final click before conversion | Short sales cycles with direct response ads | Overstates bottom-of-funnel channels such as branded search |
| First-click | 100% to the first recorded touch | Judging which channels start demand | Ignores the touches that close the sale |
| Linear | Equal share to every touch | Simple balanced view of longer journeys | Gives weak touches the same weight as decisive ones |
| Time decay | More credit to touches closer to conversion | Campaigns with a short consideration period | Undervalues early awareness spend |
| Position-based | 40% first, 40% last, 20% spread across the middle | Balanced B2B or lead journeys | The split is a convention, not evidence |
| Data-driven | Credit set by the modeled contribution of each touch | Accounts with enough conversion volume | Needs volume and is hard to audit |
One sale shows how much the rule matters. Say a $2,000 purchase starts with a paid social click, continues through an email, and finishes on a paid search ad that cost $500. Last-click hands all $2,000 to paid search, so the journey reads 4.0x. Linear splits credit three ways at about $667 each, which drops paid search to 1.33x and lifts the other two channels off zero. First-click gives everything to paid social. Credit is finite, so any model that shifts it changes ROAS without changing spend or sales.
Separate observed conversions from modeled ones
Some reported conversions are estimated rather than observed, and consent is usually the reason. Google says Consent Mode uses modeled conversions to fill measurement gaps when users don't consent, and that eligibility can require at least 700 ad clicks over seven days per country and domain grouping. It also notes that modeled conversion values can appear in the conversion-value column and feed bidding strategies such as Target ROAS, while data-driven attribution affects conversion columns and automated bidding (Google Analytics help).
That means a headline ROAS can blend observed purchases with statistically estimated ones. Report observed ROAS, modeled ROAS and a range, and treat a small move in a modeled figure as noise rather than a signal to reallocate.
Write the model and the window next to every ROAS figure, in the same font size as the number. A figure without them is a rumour.
A customer of ours put the operational value of that discipline plainly: multi-touch attribution on every call showed which ads start a booking and which ones close it, which no single-model report could do. For the credit rules themselves, this guide to revenue attribution shows how credit moves between channels, and attribution modelling in marketing covers how those rules behave once they're wired across touchpoints.
Attributed ROAS Versus Incremental Return
A branded search campaign can report 8x attributed ROAS and still be the worst line in the budget, because most of those shoppers typed the brand name after seeing a podcast ad or a retargeting banner. The platform counted the sale.
The ad didn't cause it.
Attributed ROAS is the value credited by a chosen model divided by spend. Incremental ROAS estimates the extra value advertising caused: sales with ads minus estimated sales without ads, divided by ad spend. The IAB's cross-channel measurement guidance states the distinction directly, holding that ROAS should identify its revenue basis and that attributed and incremental ROAS answer different questions, so a ROAS figure must not imply causality.
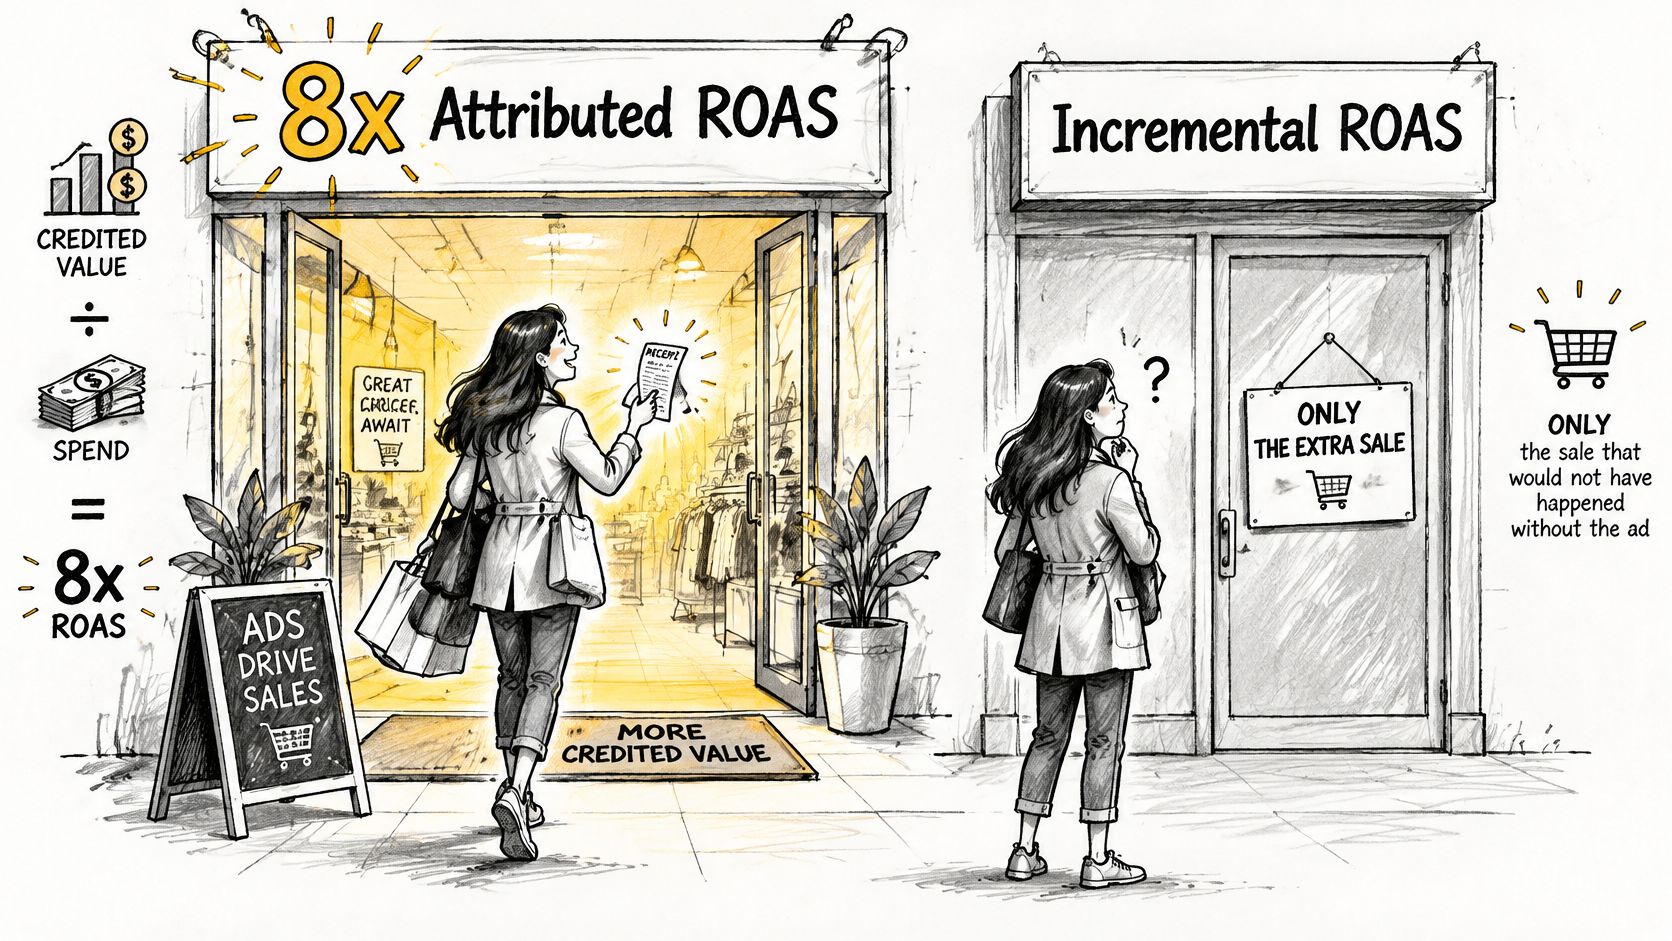
Run the arithmetic on a real gap. A campaign generates $50,000 of sales with ads, and a defensible estimate puts sales at $35,000 without them. That leaves $15,000 of incremental revenue, which is 1.5x on $10,000 of spend, against a 5.0x attributed figure. Both numbers are correct. Only one tells you what happens when you switch the campaign off. And both were calculated on booked revenue, so restating them on margin rather than revenue shifts the spread again, which is why the revenue basis belongs in the label rather than the footnote.
Building the no-ads baseline
You don't need a data science team. You need a comparison group. A randomized holdout withholds ads from a share of the eligible audience and compares purchase rates. A geo experiment pauses spend in matched regions and watches whether sales fall by as much as the platform implies. Both give you a baseline you can defend in a budget meeting, and both need a minimum sample and a confidence interval before you act on them. Noisy small samples and long sales cycles make short-window ROAS rankings unreliable, which is the other reason not to reallocate on a Tuesday afternoon.
Randomized incrementality testing is generally treated as the strongest way to estimate advertising's causal impact, and triangulating across marketing-mix modeling, multi-touch attribution and experiments is recommended for tactical and strategic decisions. Google's guidance on measuring ad impact covers the experimental side of that work.
Where attributed ROAS inflates
Three placements do most of the damage: branded search, which intercepts demand created elsewhere; retargeting, which follows people already deep in the funnel; and email-assisted journeys, where the ad sits in a sequence the customer would have completed anyway. A branded click often lands in the final hour of a journey that ran for weeks, so even a multi-touch model hands it revenue it merely collected. None of these placements are worthless. They just report returns they didn't earn.
Why two valid reports disagree
Platform, multi-touch and incrementality views should be calculated over the same conversion window, then reconciled on identity resolution, deduplication, view-through treatment and offline-conversion lag. Google's comparable conversion methodology excludes view-through conversions and their associated values when it calculates platform-comparable ROAS, which is exactly why two honest reports can land on different numbers. Working through a structured approach to advertising effectiveness measurement across those views, rather than picking a favourite, is the only way to spot which one is flattering you.
The rule that survives contact with a budget review: when a lower platform ROAS comes with a higher incremental result, trust the experiment and move the money.
Adding Lifetime Value and Offline Revenue to ROAS
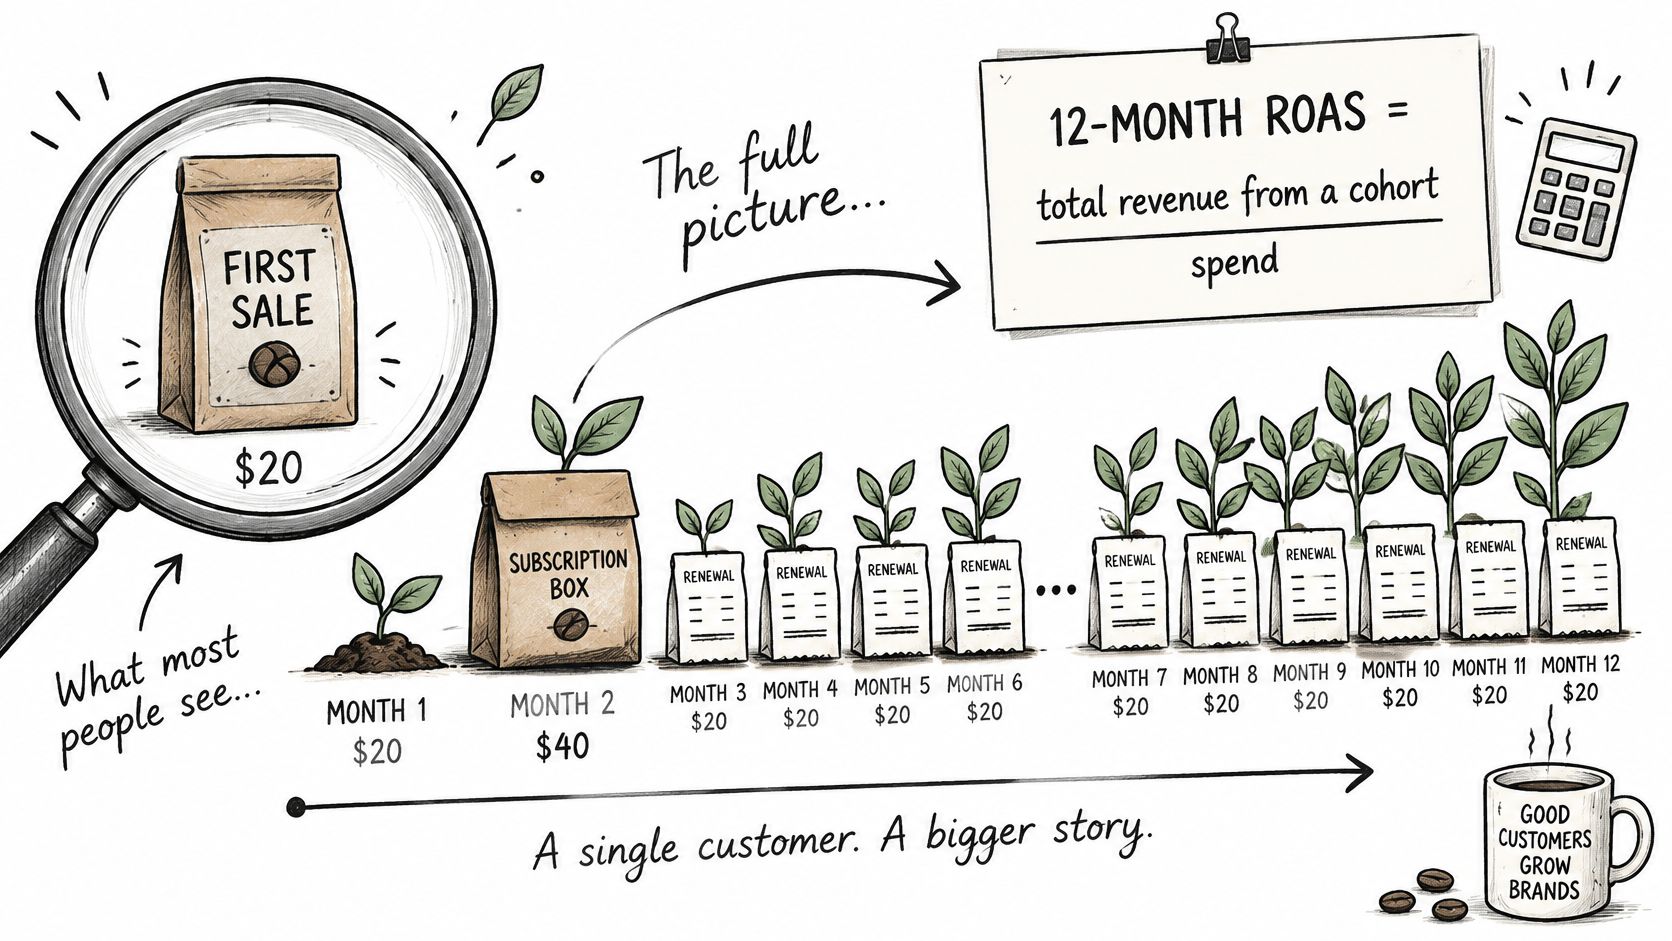
First-purchase ROAS measures the opening month of a relationship that may run for years. For subscriptions, repeat-purchase categories and anything with real retention, that snapshot understates the campaign. For discount-driven one-off products, it overstates it.
Fix the window before you compare
The cohort formula is simple: 12-month ROAS equals total revenue from customers acquired in the campaign within 12 months, divided by the campaign's ad spend. Take $10,000 of spend that acquires 200 customers who each spend $60 on the first order. That is $12,000 of revenue, or 1.2x revenue ROAS, short of the 2.5x break-even a 40% margin requires. On the margin basis, the first order returns $4,800, a 0.48x result against the 1.0x margin break-even. Same campaign, same spend, two honest numbers, and both say month one loses money.
Wait 12 months. The cohort spends $150 each in total, or $30,000, which is 3.0x revenue ROAS and 1.2x on margin. The campaign that failed break-even in month one clears it by month twelve. A 90-day cohort and a 12-month cohort will never be comparable, so fix the window and hold it fixed before you rank anything.
Getting offline revenue back to the click
Qualified leads become deals weeks later, and the value that counts is the value that arrives. Refunds, cancellations and chargebacks all reduce it. A pixel that fires on checkout records revenue the business later hands back, and a pixel alone misses a large share of conversions: server-side tracking captures 98%, against 62% for pixel-only. Pass qualified outcomes and deal values back to the ad platforms, match each one to the click that earned it, then reconcile the total against the CRM or payment system. When the platform figure and the finance figure agree, the ROAS is solid enough to act on.
Closed-loop attribution does that matching. SourceLoop syncs conversions by deal value and can send only qualified leads back to Google Ads and Meta, so a deal closing weeks after the first click still carries its campaign, and recurring revenue stays tied to the source that earned it. Ploomly's team put it this way:
"We started sending only qualified demos back to Google Ads as conversions. Within six weeks, paid search was filling our calendar with buyers who fit our ICP, and close rates followed.", Marco, Ploomly
Check the lag between spend and revenue before cutting a campaign that is still maturing.
Confirm Your ROAS Before You Move Budget
Five checks separate a number you can act on from a number you'll regret.
- Confirm the value basis. Revenue, margin or profit, named in the report and identical across every campaign you're ranking.
- Match the model and the window. Two reports using different rules aren't a comparison, they're two separate stories.
- Reconcile against finance. Platform credited revenue minus CRM or payment revenue is the gap you need to explain before scaling.
- Check the sample. A ranking built on 100 leads and a half-finished sales cycle is a hypothesis, not a result.
- Label observed and modeled figures separately, so nobody optimizes toward an estimate as if it were a purchase.
Then apply a threshold instead of a vibe. Scale when revenue ROAS clears break-even (1 divided by the margin rate) and the incremental result holds up. Hold when the number is noisy or the window is still open. Cut when both attributed and incremental returns stay below break-even across two full windows.
Break-even, not benchmark. A campaign above break-even is profitable even if it looks small next to an industry average, and one below it is a loss even if it looks impressive in the platform.
Three outcomes, using the numbers from earlier. The ecommerce campaign at 5.0x with a 40% margin clears its 2.5x break-even and can scale. The lead campaign at 3.75x clears its 2.86x break-even at a 35% margin but rests on 100 leads and a sales cycle that hasn't finished, so it's held. A campaign at 3.0x on a 25% margin sits under its 4.0x break-even and gets cut if its incremental return also stays below the line.
Pull last quarter's spend and revenue now, campaign by campaign, and recalculate each one on the margin basis instead of the revenue basis. Mark which campaigns clear break-even and which only looked good at the top line, and you'll have a shortlist of budget moves that are defensible to finance. SourceLoop ties ad spend to real ROAS across Google, Meta, TikTok and more, and the free tools on the site, including a Marketing Attribution Calculator, a Customer Acquisition Cost Calculator and a Google Ads Cost Calculator, will run the arithmetic on your own inputs. Setup takes minutes, the 7-day trial is free, and pausing a single campaign that brings no leads is enough to cover the cost of the plan.




 Paid Social


