
Multi Touch Revenue Attribution: A 2026 Guide
Learn how multi touch revenue attribution links every touchpoint to closed revenue, which model fits your team, and where the numbers can mislead your budget.

You're in a budget meeting and the numbers don't reconcile. Every platform claims the sales, finance sees fewer closed deals, and nobody can agree which channel earned what. Multi touch revenue attribution solves that argument by splitting each closed deal's value across the touches the buyer had, then forcing the total to match real revenue. It doesn't prove causation by itself, and that distinction matters. Treat it as an auditable allocation of observed sales, pair it with holdout tests, and you'll know where the numbers stop being causal.
Table of Contents
- Why Platform Conversion Counts Add Up to Too Much
- What Journey Data Your Revenue Attribution Needs
- Six Attribution Models and How Each Splits Revenue Credit
- How to Map Closed Revenue Back to Each Touchpoint
- When Attributed Revenue Overstates What Marketing Caused
- Common Pitfalls and How to Avoid Them
- Choosing Attribution Tools Without Overbuying
- Pick a Model and Test It Against Real Lift
Why Platform Conversion Counts Add Up to Too Much
Say Google Ads reports 40 conversions, Meta reports 32, and TikTok reports 18. Their dashboards total 90 sales, while your CRM shows 50 closed deals. The platforms have counted overlapping claims, not ninety distinct customers.
Each ad platform can credit a conversion after its ad touched the buyer, even when another channel also influenced the same purchase. The reports may each be internally consistent, yet adding them together can count one deal several times.
Each platform grades its own homework.
Multi touch revenue attribution replaces competing platform claims with a shared ledger. A closed deal enters once, at its observed value, then that value is allocated across recorded touchpoints in the buyer's journey. The credits must add up to the deal's value, not to a separate conversion claimed by every platform.
Who Feels the Overcount First
Agencies face the problem when clients ask why reported conversions exceed actual bookings. In-house teams encounter it when they defend marketing spend with figures finance cannot reconcile. B2B teams have a further challenge: a lead may take a quarter to become revenue, leaving the early touch easy to overlook by the time the deal closes.
The practical value is seeing different roles in the journey. A SourceLoop customer says multi-touch attribution on every call showed which ads start a booking and which ones close it. For paid search campaigns that drive calls, that distinction helps separate search that initiated an inquiry from search that captured demand near the end.
The shared ledger still records observed paths, not what would have happened without an ad. It can show how revenue is allocated among recorded touches, but that allocation alone cannot establish which touch caused the sale. Holdout tests address that separate question by comparing outcomes with and without exposure. Use both views: attribution to audit where observed revenue is assigned, and experiments to judge where the numbers stop being causal.
What Journey Data Your Revenue Attribution Needs
A model can't fix missing fields. Start with what every touch must carry, and what breaks when it doesn't.
| Field | What breaks without it |
|---|---|
| Stable person or account key | One buyer appears as three people and the journey splits |
| Timestamp | Touch order and lookback windows cannot be applied |
| Channel and campaign identifiers | Credit cannot be traced to a budget line |
| Consent status | Reports include people you may not legally track |
| Conversion stage | A form fill and a paid invoice are counted alike |
| Revenue amount and currency | Totals do not add up across markets |
| Linkage quality score | Guessed matches look as reliable as confirmed ones |
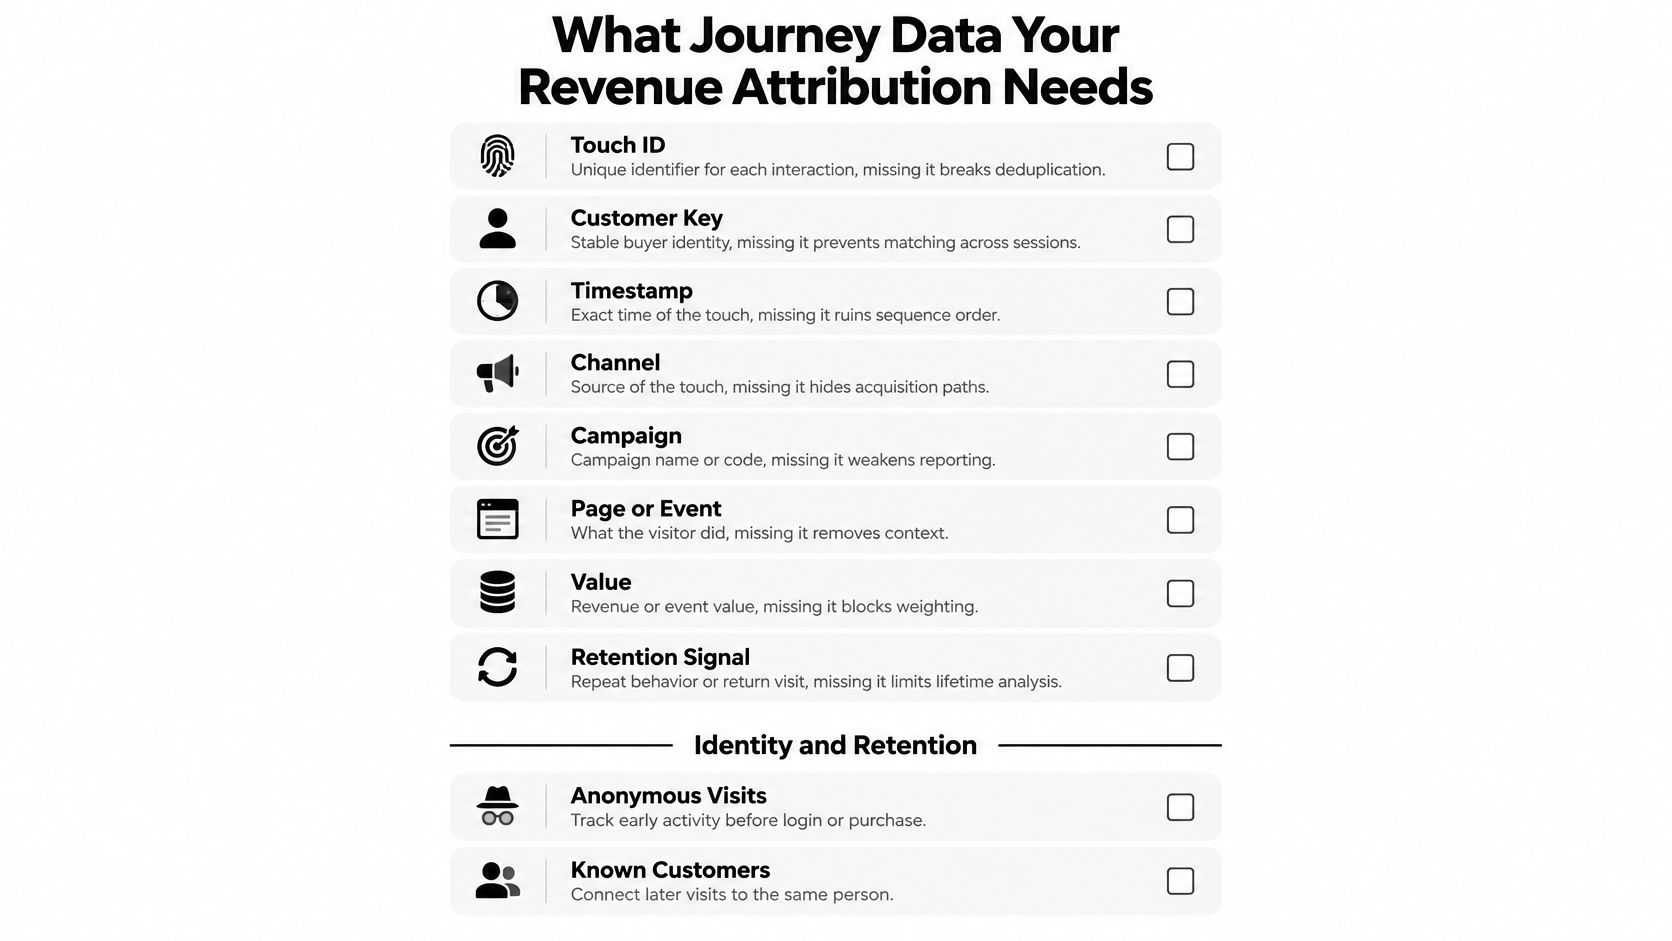
That field list isn't bureaucratic. The IAB State of Data 2023 guidance describes a pipeline as one that preserves event-level lineage and models the journey as a time-ordered sequence, with each touch retaining a stable person or account key, timestamp, channel and campaign identifiers, consent status, conversion stage, revenue amount, currency, and linkage quality.
Linking Anonymous Activity to a Known Buyer
Most journeys start anonymously. Someone reads two pages on a phone, returns on a laptop, then fills a form a week later. At that form fill, booking, or purchase, you link the earlier anonymous touches to the now known contact and record match confidence rather than assuming certainty.
When a lead converts through any form, chat or booking, we attach all 8+ attribution data points to the lead and push it to the CRM. Leads without UTM tags are attributed using referrer data, landing-page heuristics and direct-traffic detection, but they're labeled lower confidence so nobody reads a guess as a fact.
Keeping the Record Auditable
Store raw touchpoints unaltered. If you overwrite them when rules change, you can't rerun a model or audit last quarter's report. Offline payments and CRM outcomes then join back to the originating journey through explicit lookback windows, so a deal closed in month four matches touches from the right period, not everything that ever happened.
Cross-device journeys test this hardest. If your identity key fails, one buyer's phone visit, laptop session, and sales call become three partial journeys, and every model built on them understates assist touches.
Six Attribution Models and How Each Splits Revenue Credit
A model is a rule for dividing one deal's value. Change the rule and the channel totals move, even though no customer did anything different.
| Model | How credit is split | Works best when | Main blind spot |
|---|---|---|---|
| First-touch | 100% to the first recorded interaction | Measuring which channels start journeys | Ignores everything that nurtured the deal |
| Last-touch | 100% to the final interaction before conversion | Spotting the channels that close sales | Overrates branded search and retargeting |
| Linear | Equal share to every recorded touch | Long journeys with many touchpoints | Treats a casual visit the same as a demo request |
| Position-based | 40% first, 20% middle, 40% last | Balancing discovery and closing | The 40/20/40 split is a convention, not evidence |
| Time-decay | More credit to touches closer to conversion | Short sales cycles | Undervalues early awareness in B2B |
| Data-driven | Credit set by each touch's statistical contribution | Enough conversion volume to train on | Needs clean journey data and can be hard to audit |
One Deal Through Four Models
Say a $10,000 deal involved paid search, a webinar, and a sales email, in that order. First-touch gives paid search the full $10,000. Last-touch gives the email the full $10,000. Linear gives each touch roughly $3,333. Position-based gives $4,000 to paid search, $2,000 to the webinar, and $4,000 to the email.
Same buyer, same revenue, four different budget stories. That's why switching models moves budgets without changing results. The model is a lens, not a verdict.
Attribution research moved beyond single-touch rules for exactly this reason. Li and Kannan's 2014 study, summarized in the American Marketing Association's overview of multi-touch attribution, used a three-stage Bayesian model across six online channels, display, email, referral, direct, organic search, and paid search. It separated consideration, visits, and purchases, so a channel could assist a visit without taking sole credit for the sale.
Practical rule: Keep one model steady for a full quarter, and compare two models side by side before you move budget.
Rule-based models are transparent. Finance can follow the arithmetic in a spreadsheet. Data-driven models can fit your actual patterns better, but they need steady conversion volume to learn from and their weights are harder to explain when a channel's share shifts.
If you're building the underlying journey record first, it helps to track the full customer journey before arguing about percentages. Without complete touches, even a model is just splitting credit among the interactions you happened to capture.
How to Map Closed Revenue Back to Each Touchpoint
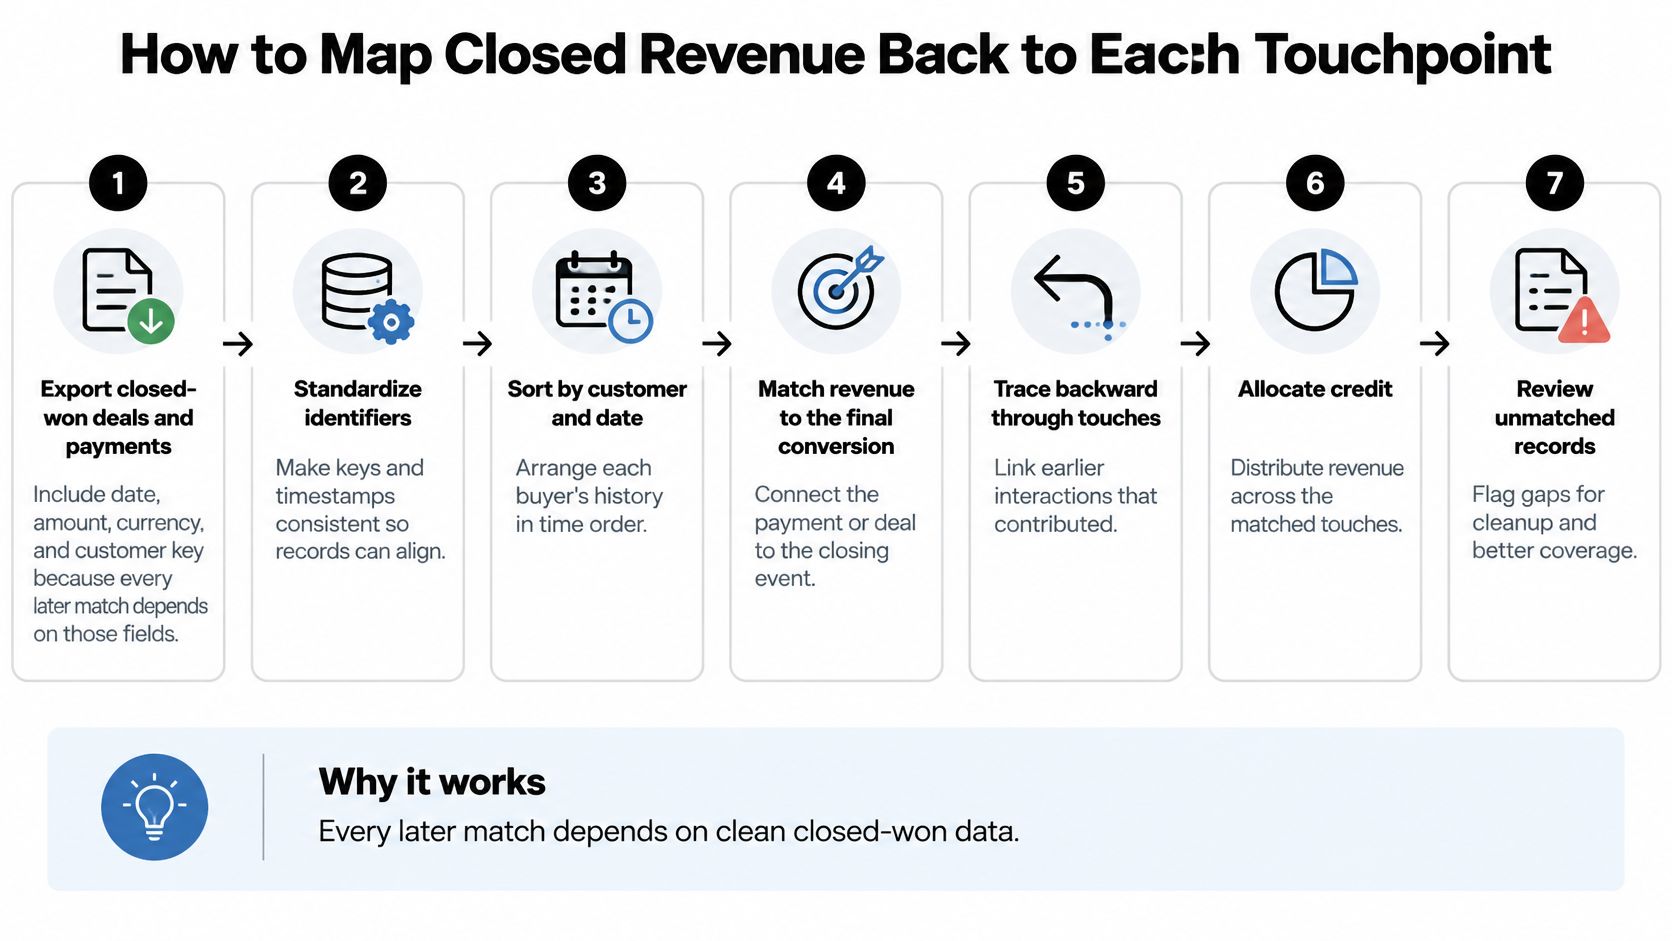
Mapping is the unglamorous work that makes multi touch revenue attribution defensible. Follow these seven steps in order.
- Export closed-won deals and payments with date, amount, currency, and customer key, because every later match depends on those fields.
- Remove duplicates and net refunds against the original purchase, so double entries and reversed sales don't inflate revenue.
- Match each revenue event to touches inside the lookback window, because too short a window drops real journeys and too long a window credits unrelated touches.
- Apply your chosen model to each journey and write credit to a per-touch ledger, so every model reads from the same record.
- Report three figures separately, observed attributed revenue, qualified pipeline, and closed-won revenue, so they aren't confused in a budget meeting.
- Reconcile the ledger total against the CRM and payment processor, and investigate any gap above a small tolerance such as 2 percent in a hypothetical monthly check.
- Review with channel owners and flag unmatched journeys rather than assigning them credit, so no channel is rewarded for sales it can't be shown to have touched.
Different Revenue Events Need Different Rules
Not every dollar should follow the same rule. Renewals, refunds, and upsells break a one-size ledger if you force them through it.
| Revenue event | Credit rule | Lookback window |
|---|---|---|
| One-time purchase | Credit touches before the payment date | 30 days |
| Recurring renewal | Credit the original subscription source | Fixed at signup |
| Refund or cancellation | Reverse the credit on the refund date | Matches the original purchase |
| Closed-won B2B deal | Credit at close date using opportunity value | 90 to 180 days |
| Upsell or expansion | Credit touches in the expansion journey | 90 days |
| Unmatched payment | Show as unattributed, do not assign | Not applicable |
Teams building this end to end often formalize it as closed-loop attribution that connects spend to closed revenue, where the payment record, not the platform report, is the final authority.
The check that proves your mapping works is simple. The attributed total must equal the payments and closed deals it came from. If it doesn't, you don't have an attribution problem yet. You have a bookkeeping problem.
When Attributed Revenue Overstates What Marketing Caused
Here's the confusion to clear up first. Attribution allocates observed revenue among touches. It doesn't prove what would have happened without those touches.
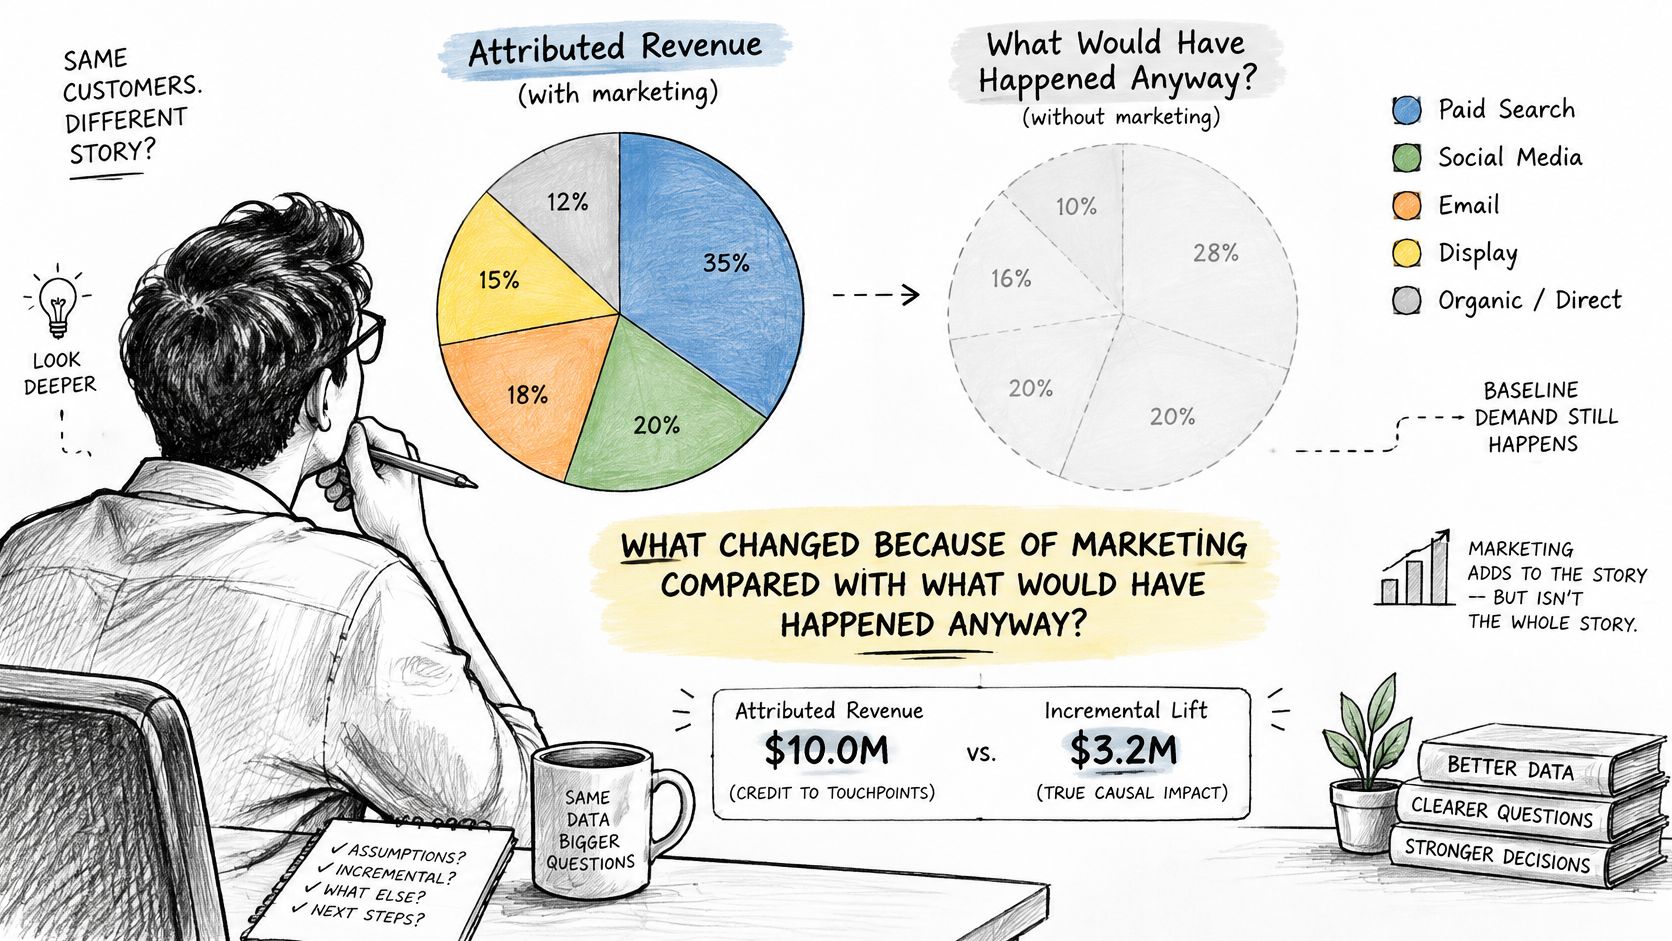
The IAB Cross-Channel Measurement Best Practices guide frames multi-touch attribution as an allocation system, not a causal measurement system. It defines the causal question as what changed because of marketing compared with what would have happened without it, which requires a credible counterfactual, bias control, and separation of signal from noise.
Branded search shows the gap clearly. A buyer who already decided to purchase may click your brand ad to reach your site. Attribution gives that click credit. Retargeting does the same with people already returning, and direct traffic often captures demand created elsewhere.
Many teams haven't closed that gap. Practitioner data summarized in a Retail Dive article on smarter marketing reporting found only 25% of marketers use a clear model for measuring incremental revenue, while 37% cannot isolate lift at all.
A Simple Holdout in Plain Numbers
Keep 10 percent of an audience unexposed for four weeks as a hypothetical test. Scale both groups to the same size. If the exposed group produces 100 conversions and the holdout produces 90, the channel's incremental share is about 10 percent of its reported conversions, not all of them.
Randomized user holdouts, geo experiments, matched markets, and synthetic controls all estimate that counterfactual in different settings. If you want a broader primer on pairing allocation with causal checks, it helps to learn how teams measure advertising effectiveness beyond platform-reported conversions.
The video below walks through that distinction between association and lift in practical terms.
Keep three questions separate. Which touches were present, which were associated with conversion, and which caused additional conversions? Use attribution for diagnosing journeys and experiments for budget decisions.
Common Pitfalls and How to Avoid Them
Most attribution failures aren't model failures. They're counting and confidence failures that make a reasonable model produce indefensible totals.
- Double-counting: Each platform claims the same sale. Fix it by taking credit from one shared ledger, never from the sum of platform reports.
- View-through counted like clicks: An ad seen but not clicked may have had no effect. Label view-through credit separately and weight it lower.
- False precision: When many journeys are unmatched, decimal places imply certainty you don't have. Report rounded ranges and show the unmatched count beside each total.
The Operational Gap Behind the Bad Numbers
Identity and data fragmentation make those pitfalls common. The Supermetrics Marketing Data Report 2025 found 66% of marketers worried about tracking users across channels as third-party cookies decline, 57% expected attribution and measurement to become more difficult, and 41% said they could not effectively measure marketing across channels. In another 2025 survey cited there, 44.5% of marketing leaders viewed fragmented, non-unified data as their biggest measurement challenge, while 38.9% cited misalignment between data and media teams.
That misalignment shows up in ordinary details. Duplicate contacts split one buyer. Refunds stay in revenue. A renewal gets credited to last month's campaign. Sales and marketing use different revenue definitions, so both reports are internally logical and mutually incompatible.
Show the unmatched journeys openly. Hidden gaps become false confidence.
Agree one revenue definition across sales and marketing before you debate models. Name an owner for the ledger who can reject bad joins and duplicate records. Review the numbers monthly, including refunds, cancellations, and consent-limited journeys, instead of only checking the channel totals that look good.
Choosing Attribution Tools Without Overbuying
Score every candidate against the work it must do. A polished dashboard that can't reconcile to payments isn't an attribution system.
- Event-level storage: Keeps each raw touch with timestamp, key, and consent status, so you can rerun models later.
- Offline joins: Matches CRM outcomes and payment events to journeys using configurable lookback windows.
- Three-figure reporting: Shows observed attributed revenue, qualified pipeline, and closed-won revenue separately.
- Match confidence: Records how sure each identity link is and labels lower-confidence matches.
- Export and reconciliation: Writes the per-touch ledger to a warehouse or spreadsheet so finance can check totals against the payment processor.
- Experiment support: Holds out audiences or splits geographic markets so lift tests can run alongside attribution.
- Access control: Limits who can edit credit rules and logs every change.
Match the Tool to Your Team Size
A small team with one main channel can start with a spreadsheet ledger if the fields are clean and the total reconciles. That sounds modest, but it beats buying software that only restates platform conversions.
Agencies reporting to several clients need more discipline. Keep a separate ledger per client, use a model you can explain in a meeting, and make sure client revenue never mixes in shared reports.
Before committing, run any candidate on one real month of data. Check whether its attributed total matches the closed deals from that same period. If it can't pass that test, extra features won't save it.
Cost belongs in that same evaluation, especially the analyst time needed to maintain joins and rules. Our breakdown of what marketing attribution software should cost helps you compare license price against implementation and ownership effort, so you don't overbuy sophistication your data can't support yet.
Pick a Model and Test It Against Real Lift
You don't need a perfect model to start. You need a stable model, a reconciled ledger, and one causal test on the channel most likely to be overcredited.
- Choose one model for your sales cycle. Use time-decay or position-based for short cycles such as e-commerce purchases. Use linear for longer B2B journeys, and data-driven only when conversion volume is high enough to train it.
- Set lookback windows by revenue event. Apply the purchase, B2B deal, renewal, refund, and upsell rules from your mapping table consistently.
- Run one holdout or geo test on your largest branded search or retargeting channel, since those channels often claim sales that would have arrived anyway.
- Compare attributed share with measured lift. Put the channel's percentage of attributed revenue beside the percentage the test caused.
- Move budget only where both views agree. Where they diverge, hold spend flat until a second test resolves the gap.
What to Do This Month
Agencies need the transparent model and shared ledger in place before any budget moves, because clients will ask which deals sit behind the totals. In-house teams need the same discipline with finance, even if the meeting is less formal.
Tracking attribution within an hour of setup is common, so the constraint usually isn't installation time. It's agreeing what counts as revenue and who owns the exceptions. If you're tying this work to return calculations, our guide on how to measure marketing ROI from attributed revenue shows how to connect the ledger to spend without double counting pipeline as cash.
Define one revenue number, name the ledger owner, pick one model for the quarter, and launch one holdout test before the month ends. That sequence gives you numbers you can explain, audit, and improve.
Ready to replace platform claims with one revenue ledger your finance team can check? Start your free 7-day SourceLoop trial, connect your forms, bookings, CRM, and Stripe payments, and run your first reconciled month through the model you choose. You'll see which touches start journeys, which ones close them, and exactly which sales remain unattributed, so your next budget decision rests on auditable revenue, not competing dashboards.



 Paid Social


