
What Is Digital Marketing Attribution? a Plain Guide
What is digital marketing attribution? Learn how credit is assigned to touchpoints, how models differ, and where attribution falls short.

One buyer, four touches, one $1,000 sale. The paid social video started the path, the organic-search blog post kept it alive, the retargeting ad brought it back, and the branded search ad caught the click at the register. Which channel earned the budget? Attribution is the set of rules that answers that question, and it is now routine work for marketing teams rather than a side experiment.
Three systems in your stack will report three different numbers for the same month. The ad platform takes credit for 190 conversions. Your analytics tool counts 240 sessions that ended in a signup. The payment processor shows 260 payments. Nobody is lying, and nobody is rounding. Each system runs its own rules about who deserves credit, so Thursday's budget meeting can turn into a guess with nice formatting.
The catch: changing the model changes which channel looks worth funding. Credit reports observed contribution along the path, not proof that a touch caused the sale.
Table of Contents
- What Digital Marketing Attribution Means
- Attribution Models Compared Side by Side
- Why the Same Sale Gets Different Credit
- What Data Connects Touches to Revenue
- Where Attribution Misleads and How to Check It
- Choose a Model and Test It on Your Data
What Digital Marketing Attribution Means
Watch a goal and you'll argue about the assist. The striker finished it, but the winger beat two defenders to create the chance. Attribution asks the same question about a sale and answers it with a formula instead of an opinion. Google's Analytics documentation describes it as assigning credit for a conversion to the ads, clicks, channels and other interactions that occurred along the customer journey.
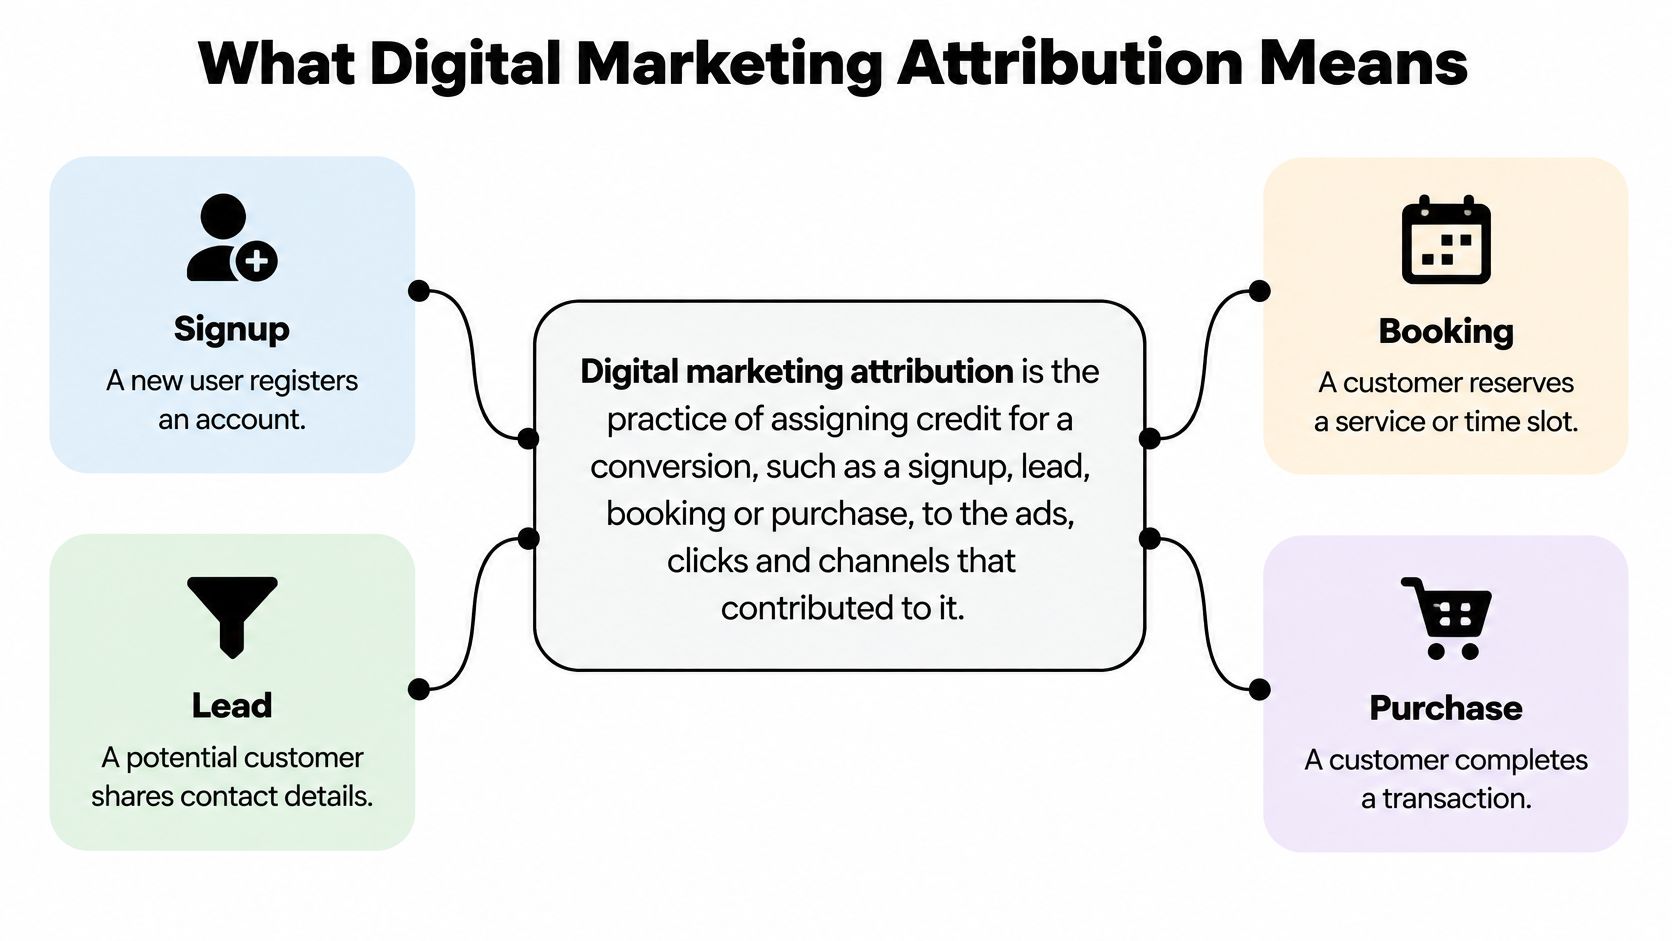
Three words carry most of the weight. A touchpoint is any interaction before the sale: an ad click, a video view, a blog read, a branded search. A conversion is the result being credited, whether that's a signup, a lead, a booking or a payment. Credit is the share of that result each touchpoint receives, written as a percentage or as money.
Now the running example. A buyer sees a paid social video twelve days before purchase. Eight days out, they read a blog post they found through organic search. Three days out, they click a retargeting ad. On the day of purchase, they search your brand name, click the ad and buy for $1,000. Four touchpoints, one sale, one thousand dollars to divide.
Without a model, every platform claims its own piece of that sale, which is how a team ends up reporting more conversions than it made. Attribution exists to force a single answer. It's also the reason the profession keeps arguing, since 51.5% of brand marketers told Marketing Week's Language of Effectiveness survey, run with Kantar and Google, that they use digital attribution to measure campaign success, while the rest are still deciding what they trust.
So the question worth answering is narrow: which touchpoints did that $1,000 sale pass through, and how much does each one deserve?
Attribution Models Compared Side by Side
Six models cover almost everything you'll meet inside a reporting tool. They run from a single fixed rule to an algorithm that learns from your own conversion data.
| Model | How credit is assigned | Best suited for | Main blind spot |
|---|---|---|---|
| Last-click | 100% to the final interaction before conversion | Short sales cycles and direct response | Ignores early discovery touches |
| First-click | 100% to the first interaction | Seeing which channels start journeys | Ignores everything that closed the sale |
| Linear | Equal share to every touchpoint | Long journeys where each step matters | Treats a minor email like a demo request |
| Time-decay | More credit to touches nearer conversion (Google uses a 7-day half-life) | Campaigns with a clear launch window | Undervalues early awareness |
| Position-based | Fixed weights, commonly 40% first, 40% last, 20% middle | Balancing discovery and closing | Weights are a judgement, not measured |
| Data-driven | Credit set from observed conversion behavior | Accounts with enough conversion volume | Needs large data and is hard to audit |
Last-click is the default in most reports because it's simple to compute and easy to defend. Current attribution reporting in Google Analytics offers three options, which its team lists as data-driven attribution, paid-and-organic last click, and Google-paid-channels last click, announced in its marketing platform blog. Under paid-and-organic last click, direct traffic is ignored and the full value of the key event goes to the last channel clicked.
First-click answers a different question: which channels open journeys at all. It's the right lens for deciding whether top-of-funnel spend earns anything, and the wrong lens for judging a closing channel.
Where the weighting gets interesting
Linear splits credit evenly, which feels fair until you notice it treats a newsletter footer link the same as a demo request.
Time-decay fades earlier touches. Google's documentation sets a 7-day half-life on its version, so an interaction eight days before conversion earns half the credit of one a day before.
Position-based is a fixed judgement: commonly 40% to the first touch, 40% to the last, and the remaining 20% spread across the middle. It's popular in B2B because it rewards both the channel that opened the relationship and the one that closed it.
Data-driven models drop the fixed rules. Google's model documentation describes a counterfactual approach that estimates how conversion probability changes when a given ad interaction is added to or removed from a path, using both converting and non-converting journeys as evidence.
No model is correct. Each one reads the same journey differently. Choose by the business question you're asking, then check the choice again next quarter.
Uptake is uneven. In 2025, just 32.4% of U.S. marketers reported using a multi-touch model for organic-growth measurement, according to an Omniscient Digital survey.
Why the Same Sale Gets Different Credit
Take the four-touch journey and run it through the rules one at a time. The path doesn't change. Only the split does.
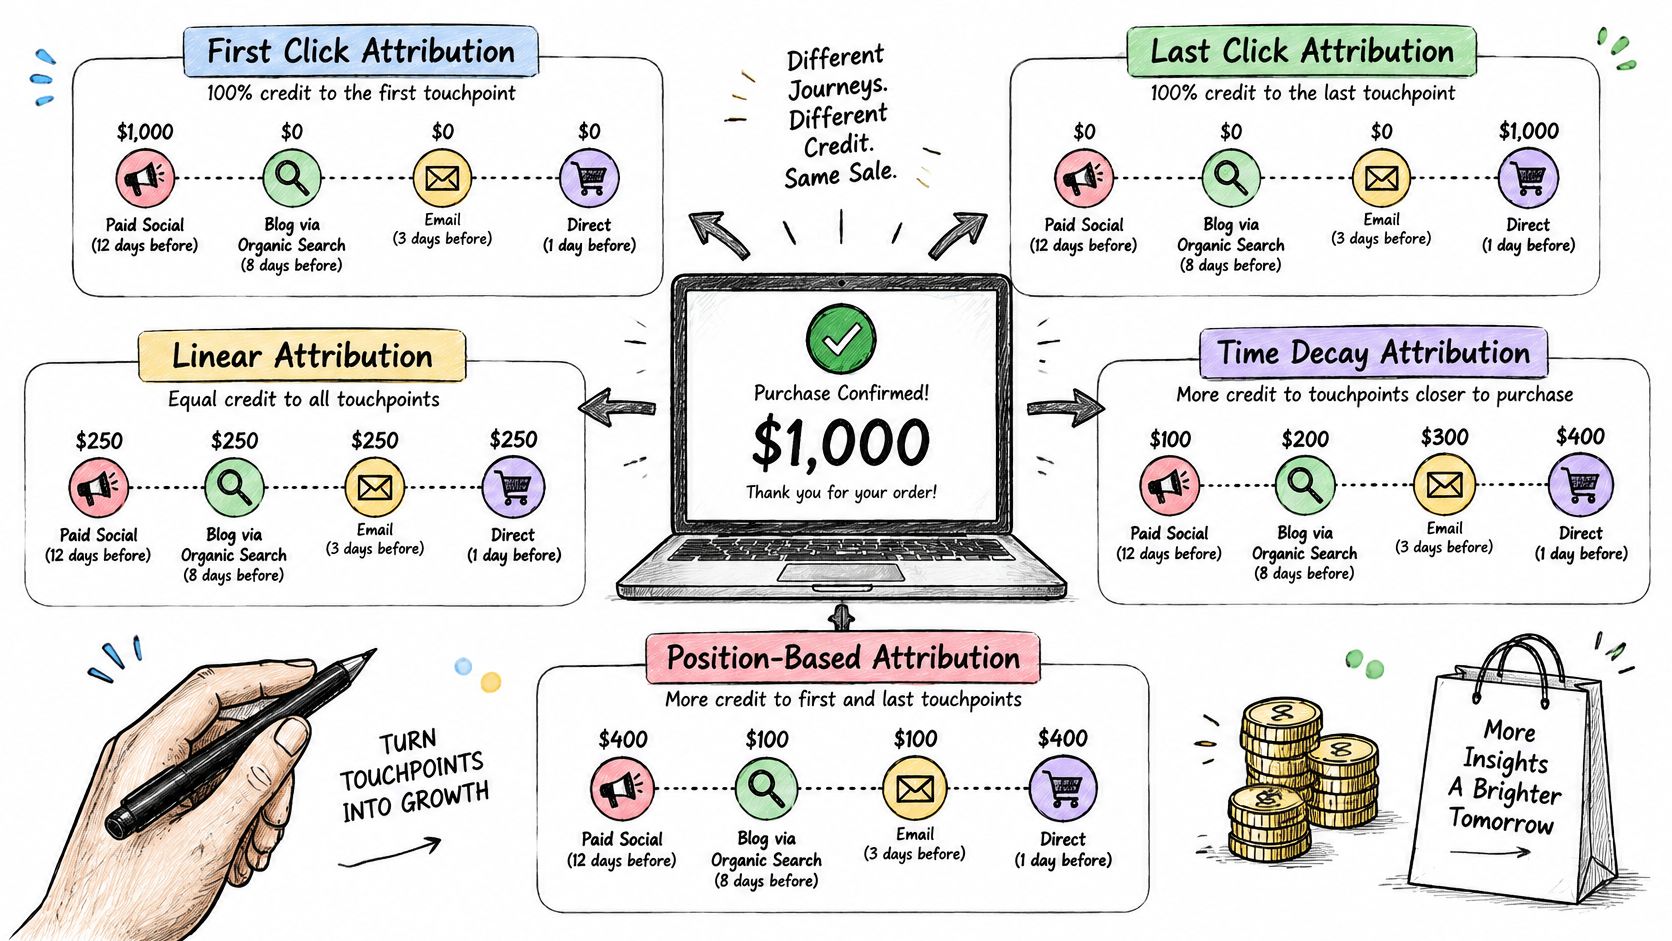
Under last-click, branded search walks away with the entire $1,000. Paid social, the blog and retargeting get nothing. Under first-click, the paid social video collects the whole $1,000 and everything after it is worth zero. Both reports are defensible and both are useless on their own.
Under linear, each of the four touchpoints takes $250. Clean, even, and wrong for a journey where a twelve-day-old video and a same-day brand search clearly did different jobs.
Under time-decay with Google's 7-day half-life, the weights come out at roughly 0.30 for paid social, 0.45 for the blog, 0.74 for retargeting and 1.00 for branded search. Normalised across the $1,000, that's about $122 to paid social, $181 to the blog, $297 to retargeting and $400 to branded search.
| Touchpoint | Last-click | First-click | Linear | Time-decay |
|---|---|---|---|---|
| Paid social video (12 days before) | $0 | $1,000 | $250 | $122 |
| Organic blog read (8 days before) | $0 | $0 | $250 | $181 |
| Retargeting ad (3 days before) | $0 | $0 | $250 | $297 |
| Branded search (day of purchase) | $1,000 | $0 | $250 | $400 |
Here's where the model stops being a reporting detail and becomes a budget decision. If you're working through an attribution walkthrough with the numbers on screen, this is the part worth pausing on.
A team reading the last-click column sees branded search as the hero and paid social as dead weight. Cut the social budget and the report improves immediately, because branded search keeps converting people who already decided to buy. Three months later, new-customer volume drops and nobody can explain why, since every remaining channel still shows strong attributed revenue. The report was never measuring causation. It was measuring who stood closest to the till.
Rule of thumb: when two models disagree about a channel, that channel has earned a closer look before it earns more budget.
What Data Connects Touches to Revenue
Model choice is an afternoon's work. Making the underlying data trustworthy is a quarter's work, and it's where most attribution projects stall. Adobe's State of Performance Marketing report found 48% of marketers naming data integration and silos as the biggest challenge to accurate measurement, 49% citing siloed or incomplete data, and 48% citing cross-channel deduplication. In the same report, 66% said they worry about tracking users across channels and 57% expect attribution to get harder as third-party cookies fade.
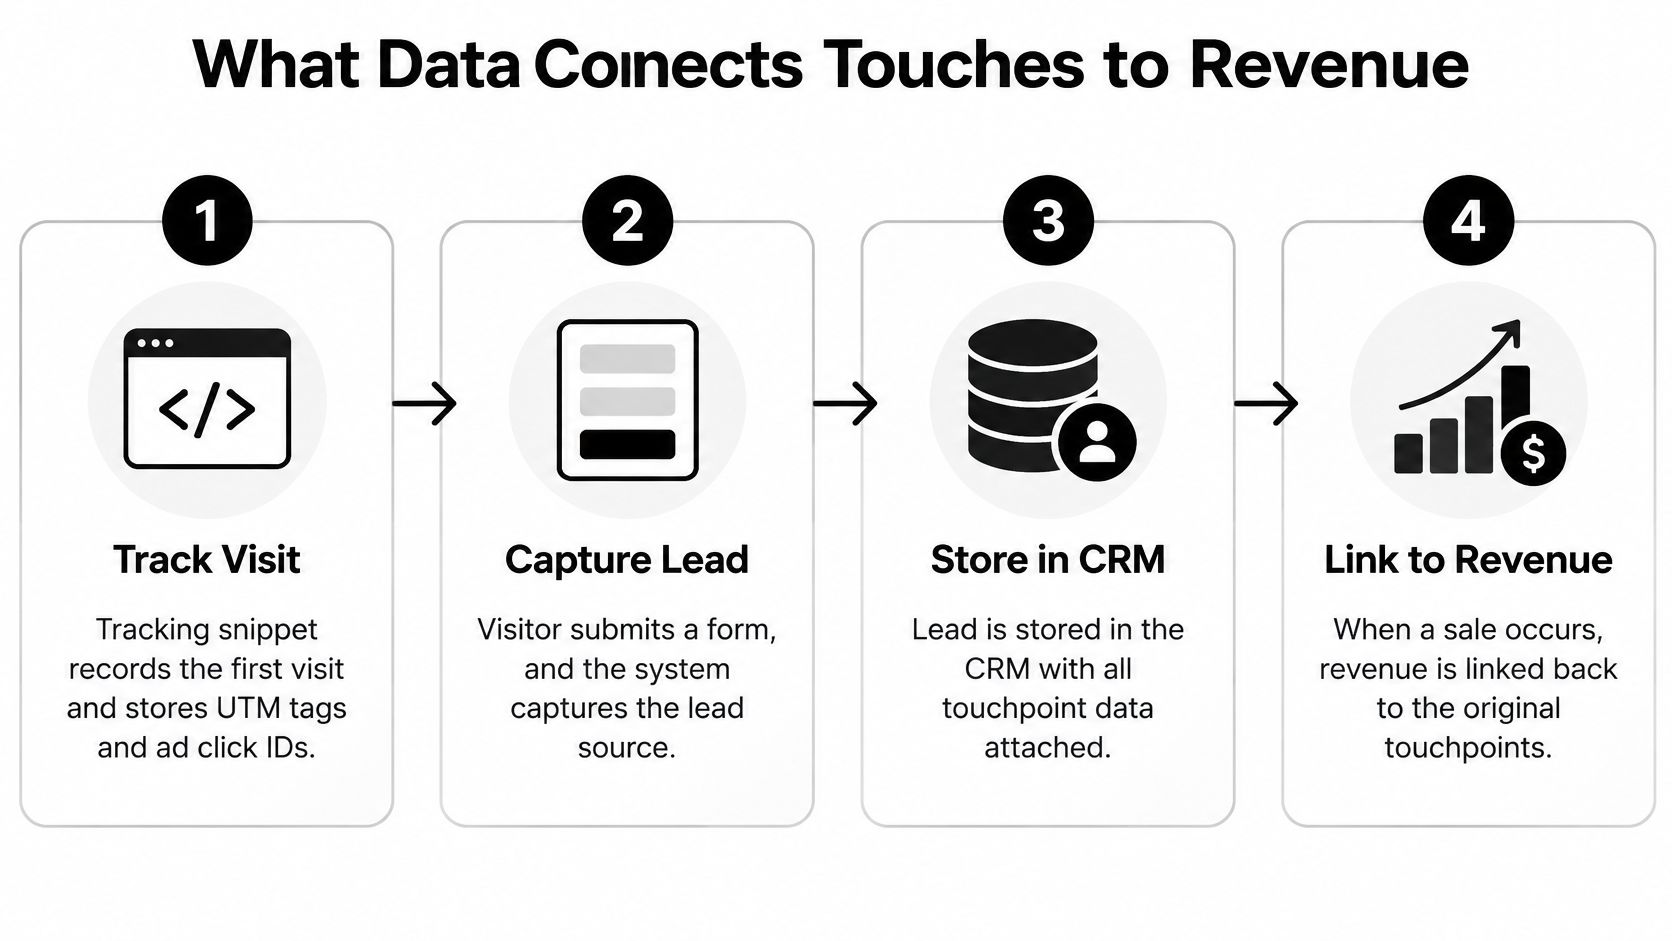
Follow one lead from visit to payment
- The visit. A tracking snippet fires on the first page view and stores UTM parameters and the ad platform's click ID against an anonymous visitor.
- The form. The moment someone submits a form, starts a chat, books a meeting or calls, that stored history attaches to a named lead.
- The CRM record. The lead becomes a deal with an owner and a value, and the source fields travel with it.
- The payment. Invoice or payment data closes the loop, and qualified conversions sync back to Google Ads or Meta so bidding learns from real customers rather than form fills.
Every link breaks in a predictable way. Untagged links land in direct traffic. Click IDs vanish when someone switches from phone to laptop or declines cookies. Two platforms count the same sale. A deal closes over the phone and the revenue never returns to the marketing database. Leads without UTM tags don't have to be a dead end: SourceLoop attributes them using referrer data, landing-page heuristics and direct-traffic detection.
| Data source | What it adds | Common gap |
|---|---|---|
| UTM-tagged links | Campaign, source and medium for each click | Untagged links fall into direct traffic |
| Ad platform click IDs | Ties a click to the ad that earned it | Lost when users switch devices or decline cookies |
| Website events | Visits, form submits and chat starts | Blocked by consent choices or ad blockers |
| CRM records | Lead status and deal value | Often typed in by hand and not matched to the visit |
| Payment records | Real revenue per customer | Usually stored apart from marketing data |
| Call and booking logs | Phone calls and meetings | Need call tracking to link each call to a campaign |
Four checks before you trust a report
- Tag every link: one untagged campaign dumps its credit into direct traffic.
- Pass the visitor ID through forms: without it, a lead loses its history at the exact moment it becomes valuable.
- Store source fields in the CRM: first touch, last touch, campaign and click ID belong on the deal record, not just in the analytics tool.
- Reconcile revenue to payments: if the attribution report and the invoice total don't match, the report is the one that's wrong.
Label each number with its origin before anyone builds a budget case on it. Server-side events, modeled conversions, platform-reported outcomes and CRM revenue are four different kinds of evidence with four different biases. If the event setup itself is shaky, this guide to setting up Google Analytics properly from 3228 Digital covers the plumbing, and once the events are clean the next step up is closed-loop attribution, where the click record and the revenue record finally sit in the same table.
Where Attribution Misleads and How to Check It
A shopper types your brand name into Google, clicks the ad, and buys ninety seconds later. Last-click hands that ad the full $1,000. Did the ad cause the sale, or did it intercept someone who was already coming? Attribution can't tell you. It can only tell you which touchpoint was present when the conversion happened.
That gap between credited contribution and real lift is wider than most introductions admit. Only 25% of surveyed marketers reported using a clear model to measure incremental revenue, and 37% said they couldn't isolate lift at all, per Brandwatch's 2025 marketer survey. Meanwhile confidence runs high: in 2024, 84% of global marketers said they were extremely or very confident in their ROI measurement capabilities, up from 69% in 2023, according to Nielsen's 2024 Annual Marketing Report.
Descriptive attribution maps touchpoints to conversions you already observed. Incrementality asks whether those conversions would have happened anyway. Those are two different jobs and they need two different tools.
Three checks separate them, and any one of them beats another dashboard:
- A holdout test. Pause retargeting for a randomly selected group of users for four weeks, then compare conversion rates against the group that kept seeing ads.
- A geo experiment. Switch a channel off in matched regions and watch whether total revenue moves. If it doesn't, the channel was collecting credit, not creating demand.
- A conversion-lift test. Run it inside the ad platform to see whether exposed users converted more often than a withheld control group.
Some channels attract credit for demand that already existed: branded search, retargeting, email to existing customers, direct traffic. Others create demand that click-based models barely see: podcasts, video, events, anything people hear about and then search for later. Once you're weighing spend against actual return, this walkthrough on how to track marketing profit keeps the money side honest.
For teams stuck reconciling fast touchpoint data with slow experiment results, the working answer is triangulation. Use digital analytics for marketing day to day for direction, use holdouts and geo tests to validate any change big enough to matter, and never pick the model that makes your favourite channel look best.
Choose a Model and Test It on Your Data
Start with two models, not one: last-click and position-based, run side by side. The gap between them shows exactly where your budget decision is fragile. This isn't a small concern for leadership, since 76% of B2C marketing, media and advertising executives named improving campaign-performance measurement and analytics a top priority in 2024, in Wakefield Research's study sponsored by LiveRamp.
Then run four steps:
- Pull channel totals for both models over the last 90 days.
- Flag every channel where the two models differ by more than 20%.
- Run a four-week holdout or geo test on one flagged channel.
- Set the model used for budget decisions, and review it each quarter.
Short cycles dominated by one channel can live on last-click. Long B2B cycles suit position-based. A campaign with a clear launch window suits time-decay. Data-driven only works once you have enough conversions to learn from. SourceLoop's models cover first-touch, last-touch, linear, position-based and time-decay, so the comparison runs in the same place as the reporting, and free tools like the UTM Campaign Builder and Marketing Attribution Calculator handle the setup checks. Once the model is settled, the guide on how to measure marketing ROI shows how to hold each channel to a return target instead of a credit share.
Two questions close the loop: which channel changed the most when the model changed, and what did the test show?
Pick the sale you understand best, the one where you can name the email, the ad and the search that brought the customer in. Run last-click and position-based on that sale, write down the gap, then go find out which number is closer to the truth before anyone moves a budget line. If you'd rather not rebuild the plumbing yourself, SourceLoop installs with a single lightweight snippet, many teams are tracking attribution within an hour of setup, and the free 7-day trial includes the full multi-touch stack with funnels and dashboards.



 Paid Social


