
How to Use the SourceLoop Anonymous Visitors View
Unidentified visitors, every anonymous browser that came to your site. See engagement, location, device, attribution, and the full pre-conversion journey.
On this page
- What the Unidentified visitors list answers
- Step 1: Pick your date range and filters
- Step 2: Read the row
- Step 3: Read the attribution columns
- Step 4: Read the technical columns
- What you won’t see here (compared to the Contacts table)
- Step 5: Open the journey drawer
- Step 6: Spot the patterns that matter
- Step 7: Export to CSV
- What’s next
The Unidentified visitors list, under Contacts in the left sidebar, is the other half of SourceLoop’s Contacts page: everyone who has come to your site but hasn’t converted yet. No email, no name, no phone number, just an anonymous browser, its sessions, and the attribution attached to those sessions.
It’s the right view for diagnosing top-of-funnel performance: are paid clicks coming in but not converting, is one campaign driving unusually engaged anonymous visitors, are organic visitors browsing deeply but bouncing without filling a form.
Open it from the left sidebar of the Contacts page, Visitors -> All visitors.
What the Unidentified visitors list answers
In one screen:
- How many anonymous visitors arrived in a date range, and from which channels
- How deeply they engaged (sessions, pageviews, an engagement bucket)
- Where they came from geographically, on what device, in what browser
- Their first-touch and last-touch attribution, even though they haven’t converted
- Their full per-visitor journey, every page they viewed, every ad they clicked
Step 1: Pick your date range and filters
Same controls as the Contacts table:
- Date range: defaults to the last 30 days
- Column header filter: quick filter per column (dropdown for Channel / Device / Country; text input for everything else)
- Filter builder: multi-condition filter across any dimension
- Column visibility menu: toggle which columns appear
The page-level filters at the top apply across both Leads and Unidentified visitors lists, so swapping between them keeps your filter context.
Step 2: Read the row
Each row is one anonymous visitor (one unique browser, cookie-based). The default columns:
| Column | What it shows |
|---|---|
| Visitor | Either “Anonymous” with an incognito-style avatar, or the name / email if SourceLoop has captured any identifying detail short of a full conversion. |
| Engagement | Highly / Moderately / Slightly active, with a visual bar. Derived from session count + pageview count. |
| First seen | When the visitor first arrived (relative, e.g., “2 days ago”). |
| Last seen | When their most recent session ended. |
| Country | Country with flag emoji (from the converting session’s IP). |
| City | City from the same. |
| Pageviews | Total page loads across all sessions. |
Step 3: Read the attribution columns
Same first-touch / last-touch column pairs as the Contacts table:
| First touch | Last touch | Meaning |
|---|---|---|
| First Channel | Latest Channel | Paid Search, Organic Social, Direct, etc. |
| First Source | Latest Source | The utm_source value |
| First Medium | Latest Medium | The utm_medium value |
| First Campaign | Latest Campaign | The utm_campaign value |
| First Term | Latest Term | Search term |
| First Content | Latest Content | The utm_content value (hidden by default) |
| First Landing Page | Latest Landing Page | URL of the first arrival and the most recent arrival |
For a visitor who has only had one session, First and Latest match. For repeat visitors, the two diverge, useful for spotting “first arrived via Paid Search, came back via Direct” patterns.
Step 4: Read the technical columns
| Column | What it shows |
|---|---|
| Device | Desktop, Mobile, or Tablet |
| OS | Operating system (hidden by default) |
| Browser | Browser name (hidden by default) |
Toggle the hidden columns via the column visibility menu when you need them.
What you won’t see here (compared to the Contacts table)
The Unidentified visitors list is intentionally stripped of every identified-contact field:
- No name, email, phone, or company
- No status, qualified flag, lead score, expected revenue, or revenue
- No conversion type (because there’s no conversion yet)
- No click IDs in the table (still tracked underneath, visible in the journey drawer)
- No inline editing, the view is read-only
The moment a visitor identifies themselves (submits a form, books a meeting, starts a chat with an email, pays), they’re promoted to the Contacts table and disappear from here.
Step 5: Open the journey drawer
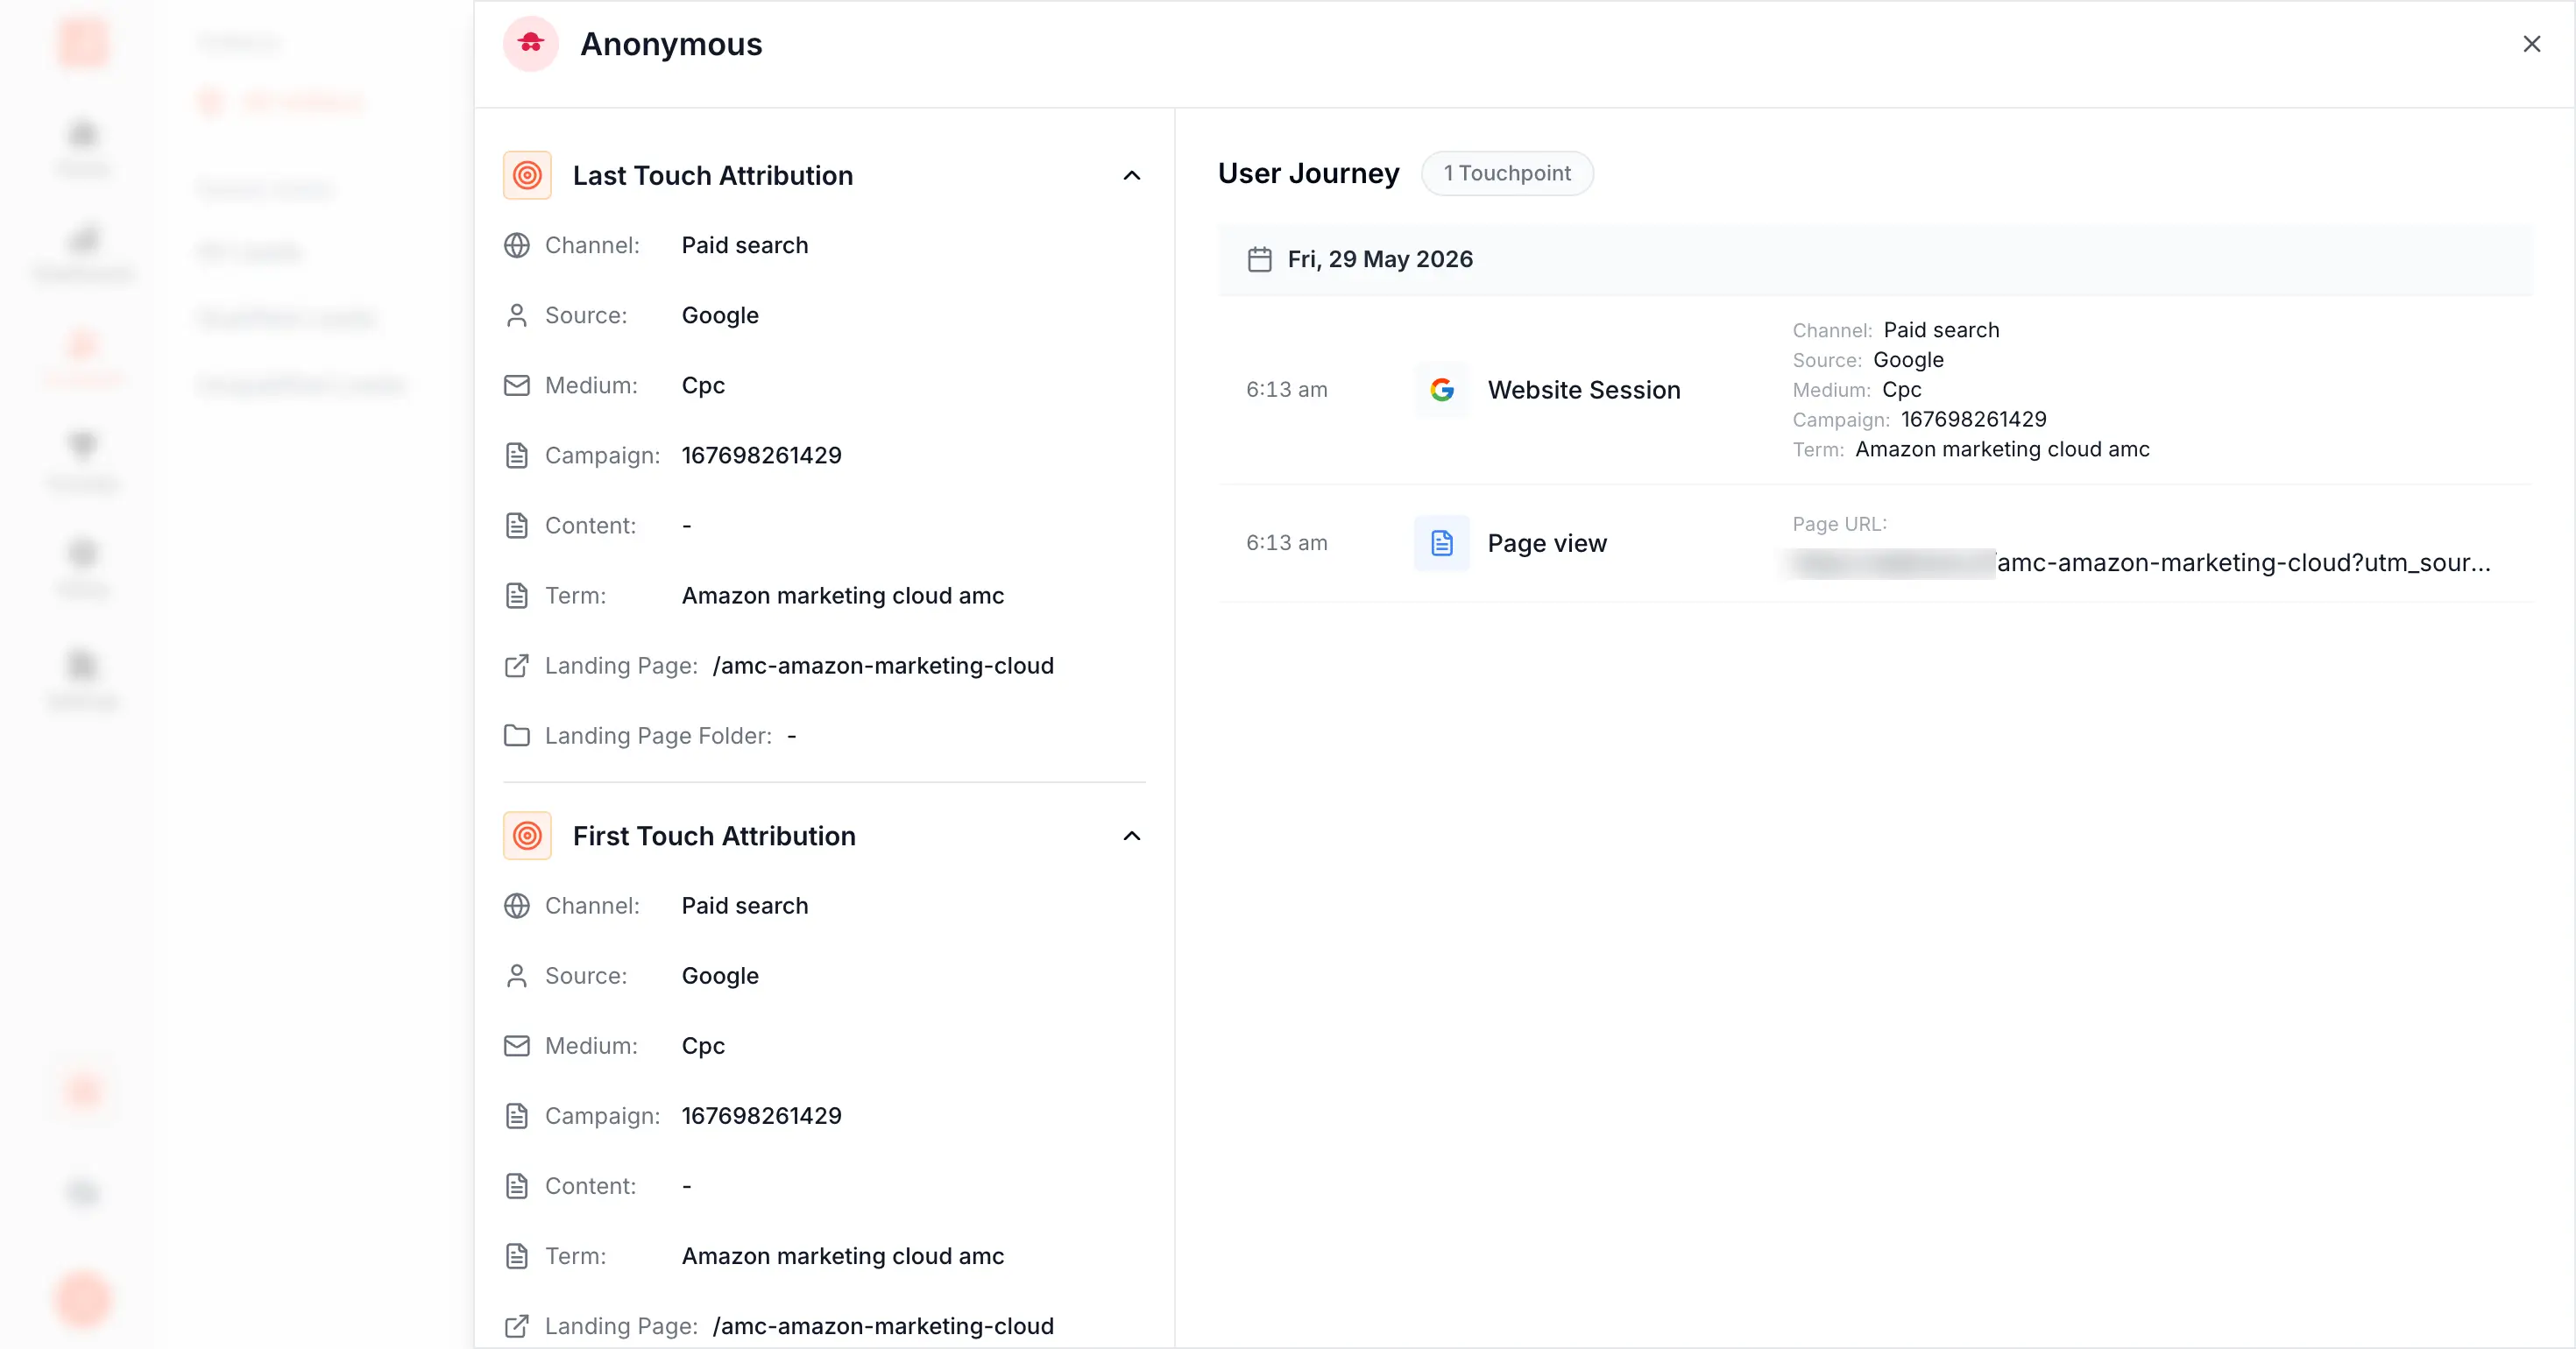
Click any row. The right-side drawer opens, the same drawer the Contacts table uses, in read-only mode.
For an anonymous visitor, the drawer shows:
- Last Touch Attribution and First Touch Attribution sections, exactly as for an identified lead
- Personal Information: mostly empty for an anonymous visitor; populated as soon as identifying data lands
- Technical Information: browser, device, OS
- Journey timeline on the right side, every session the visitor has had, expanded into individual events: page views, ad clicks, custom events, scroll milestones, video plays, form starts (without submissions), etc.
The journey timeline is what makes this view valuable. You can see the pages a Paid Search visitor browsed before bouncing, the ads a return visitor clicked, the videos a high-engagement anonymous visitor watched, all of it, even without a conversion.
Step 6: Spot the patterns that matter
A few useful reading patterns:
High engagement, no conversion → visitors are getting interested but the path to convert isn’t clear. Look at their last viewed page and check the CTA placement and copy. Click their row to see the journey timeline; did they look at the pricing page and bounce?
Specific campaign driving lots of unconverted visitors → filter Latest Campaign = “your campaign name”. If the volume is high but no one converts, the campaign is targeting the wrong audience, the landing page is wrong, or the CTA is too far below the fold.
Return-visitor traffic from Direct after Paid Search → indicates real interest. These are the visitors most likely to convert next; consider a retargeting campaign that catches them on their third visit.
High organic traffic from a specific country with zero conversions → either you’re not localised for that market, or your form / payment flow is failing for that geo (currency, language, payment method). Drill into a journey to confirm.
Step 7: Export to CSV
Same Export button, top-right. The CSV includes every visible column plus full attribution per visitor, one row per browser.
Typical exports:
- Audience upload to ad platforms: export, hash, and upload as a custom audience to retarget high-engagement non-converters
- Top-of-funnel quality check: export by Latest Channel to compare engagement metrics across paid vs organic sources
- Bounced-campaign analysis: filter to a campaign with high cost but no Leads, export, and review session-by-session in a spreadsheet
What’s next
- See identified leads with full revenue and lifecycle data: Contacts (Leads) table
- Slice the same data by channel rather than per-visitor: Traffic and Revenue report
- See pre-conversion page sequences in aggregate: Paths report
- Compare attribution credit across models: 7 Types of Attribution Models
Frequently asked questions
-
Why doesn't this view show names or emails?
Because these visitors haven't given you any. The moment a visitor identifies themselves by submitting a form, booking a meeting, starting a chat with an email, or paying, they graduate to the Contacts table and stop appearing here. The Unidentified visitors list is intentionally the pre-identification stage.
-
What counts as a 'visitor'?
A unique anonymous browser, identified by a first-party cookie that SourceLoop's tracker sets on first page load. The same browser returning multiple times is one visitor with multiple sessions; a different browser (e.g., switching from phone to laptop) shows as a separate visitor until you can later stitch them via an identifier.
-
How is Engagement calculated?
A simple synthetic score based on session count and pageview count. Highly active visitors have had multiple sessions or browsed deeply in one. Moderately active have a typical 2-3 page session. Slightly active have a single short session. It's a rough sort, not a model, useful for finding the visitors most worth a follow-up if they later convert.
-
Can I export the Unidentified visitors list?
Yes, the same way as the Contacts table. The CSV includes every visible column plus first-touch and last-touch attribution, with one row per anonymous visitor. Useful for ad-platform audience uploads (after hashing) or for analysis when you suspect a campaign is driving large unconverted volume.
-
Why are some attribution columns blank?
Because the visitor came in without UTM parameters and without a recognised referrer (Direct traffic). The First Channel column will show "Direct" and most other attribution columns will be empty. This is normal for brand-search, direct-typed, and dark-social traffic.
-
Can I click a visitor to see their journey?
Yes. Click any row to open the journey drawer, the same drawer the Contacts table uses, in read-only mode. You'll see every session, every page view, every ad click, every event the visitor has triggered. It's the most useful artifact for diagnosing "why are paid clicks coming in but not converting".
-
How long do visitors stay in this view?
Until they convert (which moves them to the Contacts table) or until their session data ages out of your retention window. Practically, you're looking at every active and recent anonymous visitor at any moment.

 Paid Social


