Skip to content
SourceLoop
Dashboards

How to Analyse Conversion Paths and Customer Journeys

The Paths dashboard, see the exact sequence of channels, sources, and pages every converting visitor went through before they converted.

On this page
  1. What the Paths dashboard answers
  2. Step 1: Pick your filters
  3. Step 2: Decide whether to collapse repeat touches
  4. Step 3: Switch grouping with the tabs
  5. Step 4: Read the path rows
  6. Step 5: Read the patterns that matter
  7. Step 6: Compare paths under different attribution models
  8. Step 7: Export and act
  9. When to use Paths vs Traffic
  10. What’s next

The Paths dashboard is SourceLoop’s multi-touch attribution view in its purest form. Instead of assigning credit to channels and summarising, it shows you the exact sequence of touches every converting visitor went through, the literal path to conversion.

It’s the dashboard for the question every marketer eventually asks: “Is paid social actually driving sales, or just creating awareness that organic search converts later?” The Paths view answers it directly.

What the Paths dashboard answers

In one screen:

  • The single-touch paths that close in one visit (high-intent traffic)
  • The two- and three-touch paths that compound (your real conversion funnel)
  • Which channels reliably assist conversions even when they’re not the closer
  • The exact sequence your highest-revenue customers go through before they convert
  • Whether your funnel has a repeating discovery → consideration → close pattern (and what each role plays)

It’s the right dashboard when you need to defend or kill a channel based on its assist value, plan retargeting, or design a nurture sequence that mirrors real buyer behaviour.

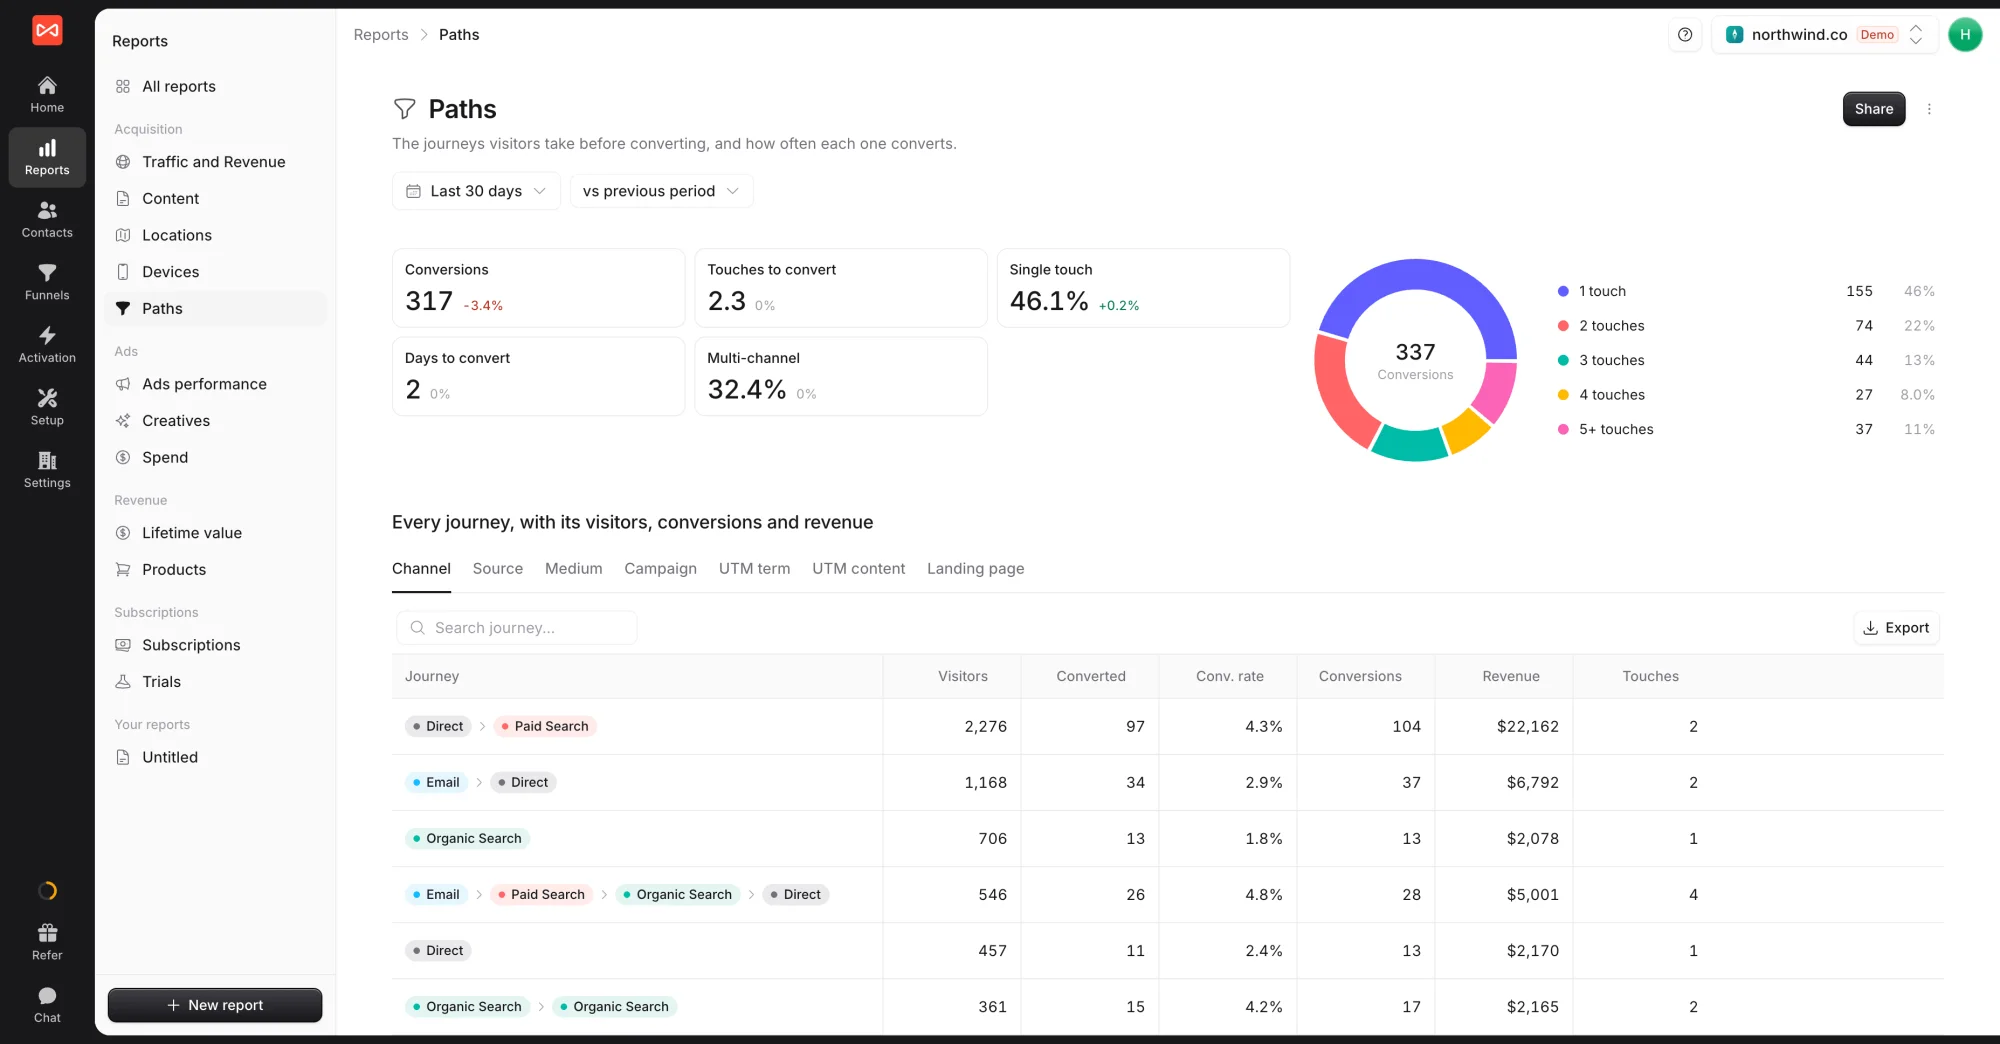
SourceLoop Paths dashboard showing the conversion path column with sequences like 1 social → 2 paid_search, 1 referral → 2 paid_search, 1 email → 2 paid_social → 3 paid_social, with Visitors, Conversions, and Revenue columns

Step 1: Pick your filters

The filter bar is similar to the other dashboards but with one new control specific to Paths:

  1. Date range — defaults to the last 30 days
  2. Collapse repeat touches — toggle in the top-right (covered in detail below); ON by default
  3. Filter — add ad-hoc filters on channel, source, campaign, country, device, etc.

The dashboard recomputes the entire view on every filter change.

Step 2: Decide whether to collapse repeat touches

The Collapse repeat touches toggle in the top-right is one of the most important controls on this dashboard. It changes what each path actually looks like:

  • ON (default) — repeated touches from the same channel collapse into one. A visitor who hits your site three times from social and converts shows up as 1 social instead of 1 social → 2 social → 3 social. Use this when you want to see the structural path: what unique sequence of channels matters.
  • OFF — every individual session is a separate touch. The same visitor shows as 1 social → 2 social → 3 social. Use this when you specifically want to see frequency patterns: how many touches a channel needs before it converts.

For most analysis (budget allocation, channel mix decisions), ON is the right default. Flip it OFF when investigating ad-frequency or nurture-cadence questions.

Step 3: Switch grouping with the tabs

Above the table, seven tabs control what each touch in the path represents:

  • Channel — high-level bucket (social, paid_search, referral, email, etc.) — the default
  • Source — literal utm_source value (google, linkedin, twitter, etc.)
  • Medium — literal utm_medium value (cpc, organic, social, email, etc.)
  • Campaign — literal utm_campaign value (e.g., “summer-sale-2026”)
  • Termutm_term, often keywords from paid search
  • Contentutm_content, often ad-variant identifiers
  • Page — landing pages on your site, so each touch is a specific URL instead of a channel

The Page tab is especially powerful for content marketing analysis, it tells you the literal sequence of pages each converter read on the way to the conversion, like “1 /blog/utm-tracking → 2 /pricing → 3 /demo-thank-you”.

Switch tabs based on the question you’re answering:

  • “Which channel mixes convert?” → Channel tab
  • “Which specific Google Ads campaign features in winning paths?” → Campaign tab
  • “What content sequence do my best customers read?” → Page tab
  • “Which keywords appear in paid-search-assisted paths?” → Term tab

Step 4: Read the path rows

Each row in the table is a unique path observed in the period, displayed as a sequence of numbered chips. Reading from left to right gives you the chronological order.

Three columns:

  • Visitors — unique people who went through this exact path
  • Conversions — total conversion events from this path
  • Revenue — attributed revenue when payment integrations are connected

Sort by Conversions to see the highest-volume paths first. That’s where your real funnel structure lives.

Step 5: Read the patterns that matter

Once the table is sorted by Conversions (descending), look for these patterns:

Single-touch top rows (1 social, 1 paid_search, 1 referral) → high-intent traffic that converts on first arrival. These are your best paid-acquisition opportunities, double down where the CPA is good.

Two-touch paths with the same closer (1 social → 2 paid_search, 1 referral → 2 paid_search) → the first channel is the discovery driver, the second is the closer. Paid search is doing a lot of “closing” work here; cutting it without thinking would crater your overall conversion rate, even though it’s not the original source.

Repeat-channel paths (1 social → 2 social → 3 social, with Collapse OFF) → social is doing both discovery and reinforcement. The channel needs frequency in your bidding strategy, that’s a multi-impression brand-building motion, not a one-click direct-response motion.

Paths ending in Direct (1 paid_social → 2 organic_search → 3 Direct) → classic awareness → consideration → close pattern. The earlier channels worked: brand recall closed the deal. Don’t kill paid_social just because it’s not in the last position; without it, the whole path wouldn’t exist.

Email assists in the middle (1 social → 2 email → 3 paid_social) → your nurture sequence is working. Email picked up an unconverted social visitor and re-engaged them before they converted via paid social. This is the kind of pattern that justifies investing in lifecycle marketing.

Step 6: Compare paths under different attribution models

Path data is structurally attribution-model-agnostic, the sequence itself doesn’t change when you switch models. But the Visitors, Conversions, and Revenue columns do, because those numbers aggregate per the selected model.

Two useful comparisons:

  • Last Touch view — counts conversions where the last touch in the path was the closer. Useful for understanding what closes.
  • Linear or Position-Based view — splits credit across every touch in the path. Useful for understanding total contribution, including assist value.

For deep detail on each model, see Attribution models overview.

Step 7: Export and act

Typical follow-up actions teams take after a Paths dashboard session:

  • Budget defence — if you’re under pressure to cut paid social because it’s not Last Touch, export the Paths data and show how often it appears in winning multi-touch sequences. The assist value is real and quantifiable.
  • Retargeting design — for paths where Direct closes, set up retargeting on the discovery channels (paid social, paid search) so brand awareness has somewhere to land
  • Nurture sequence redesign — paths where email middle-assists tell you which segments respond to email cadence; build sequences that mirror those paths
  • Channel kill / keep decisions — channels that never appear in any winning path can be cut without revenue impact (rare, but worth checking quarterly)
  • Content sequence planning — Page tab paths show the canonical “browsing journey” for your converters; use that to design internal linking, blog series, and CTA placement

When to use Paths vs Traffic

Quick reference:

  • Traffic dashboard — “Which channels drive conversions?” Budget allocation, channel-mix comparisons.
  • Paths dashboard — “What sequence of channels do my converters go through?” Multi-touch attribution defence, assist-channel decisions, nurture design.

The two work together: Traffic tells you which channel closes, Paths tells you which channels assisted along the way. Most marketing-mix decisions need both views.

What’s next

Frequently asked questions

  1. What's a 'conversion path'?

    The exact sequence of marketing touches a visitor went through before they converted. A single-touch path looks like 1 social, the visitor came from social and converted on the same session. A two-touch path looks like 1 social → 2 paid_search, they first arrived via social, came back later via paid search, and converted on the second visit. Paths can have 5+ touches for considered purchases. The dashboard shows every unique path observed plus the volume and revenue it produced.

  2. What does the 'Collapse repeat touches' toggle do?

    When ON (default), repeat touches from the same channel are collapsed into a single touch. A visitor who hits your site three times from social, then converts, shows up as 1 social (instead of 1 social → 2 social → 3 social). When OFF, every individual session is shown as a separate touch, which surfaces the real raw sequence including the repeat-engagement signal. Use ON for high-level analysis (which combinations matter), OFF when you specifically want to see frequency patterns.

  3. Should I read paths under Last Touch or First Touch attribution?

    Path data is naturally attribution-model-agnostic, the path is the path regardless of how you split credit. The model selector still affects the Visitors / Conversions / Revenue columns, though, those still aggregate per the model you've selected. For "which raw paths produce conversions", any model works. For "how much value to assign each path", the model matters.

  4. What does '1 social → 2 social → 3 social' mean? Three social visits before converting?

    Yes (with Collapse repeat touches OFF). It means the visitor came to your site three separate times from social before they converted on the third one. This pattern is common for considered purchases, social drives discovery and reinforcement before someone is ready to buy. Repeat-channel paths usually tell you which channel needs more frequency in your bidding strategy.

  5. Some paths end with 'Direct'. What does that mean?

    Direct is the catch-all when the channel detection couldn't find a signal, no UTM, no recognised referrer, no click ID. A path ending in Direct usually means the visitor remembered your URL from earlier sessions and typed it in (or bookmarked it). Common when the original Channel does its job, brand recall closes the deal. The path 1 paid_social → 2 organic_search → 3 Direct visible in the screenshot is a classic example, paid creates awareness, search confirms intent, direct closes.

  6. How is this different from the Traffic dashboard?

    Traffic dashboard tells you which channel produced each conversion (with credit assigned per the selected attribution model). Paths dashboard tells you the entire sequence of channels each visitor went through. Traffic answers "which channel converts"; Paths answers "which combinations of channels reliably convert". Use Traffic for budget allocation, Paths for understanding the funnel structure.

  7. I see hundreds of unique paths. How do I find what matters?

    Sort by Conversions (descending) to see your highest-volume paths first, those are the patterns your funnel actually runs on. Most teams find that 10-20 paths cover 80% of conversions. The long tail of single-occurrence paths is normal and not worth optimising individually. Focus on the top paths, then look for shared sequences (e.g., does every top path include paid_search at some position?).

Track every conversion to its true source

Capture and send full attribution data from every signup, lead, booking, and sale to your CRM and ad platforms, so you know exactly what's driving revenue.

Without SourceLoop

Untagged

Kayden Floyd

kayden@abc.com

  • SourceUnknown
  • MediumUnknown
  • CampaignUnknown
  • Landing pageUnknown
Journey
No touchpoints captured

With SourceLoop

Auto-tagged

Kayden Floyd

kayden@abc.com · Acme Co.

  • Channel Paid Social
  • CampaignFree_demo
  • Landing page/pricing
Journey
Synced to HubSpot Google Ads Meta