
How to Build and Analyse Conversion Funnels
Build step-by-step conversion sequences, read the drop-off chart, compare two periods, and break down by channel, device, country, or attribution model.
On this page
- What a funnel actually is in SourceLoop
- What you’ll get from a funnel
- Step 1: Build a funnel
- Section 1: Name the funnel
- Section 2: Add the steps
- Section 3: Choose an audience (optional)
- Section 4: Configure the settings
- Step 2: Read the Overview report
- The chart
- The step table
- Step 3: Compare two periods
- Step 4: Break the funnel down by dimension
- Multi-model attribution in Breakdown
- Step 5: Manage funnels
- Common funnel patterns
- Counting, order, and conversion window in detail
- Count unique
- Step order
- Conversion window
- What’s next
The Funnels feature in SourceLoop answers a question the dashboards can’t: “Of the people who entered our pipeline at step A, how many actually reached step B, then C, then converted, and where exactly are we losing them?”
The Traffic and Revenue report tells you channel totals. The Content report tells you which pages got the most visits. Funnels tell you the literal progression of visitors through a sequence of steps, and the percentage who drop out at each one.
This guide covers everything: how to build a funnel, how to read the two report views (Overview and Breakdown), how to compare periods, the settings that change how steps are counted, and the common patterns marketers use them for.
What a funnel actually is in SourceLoop
A funnel is an ordered sequence of conditions. The classic four-step lead funnel looks like:
| Step | Condition |
|---|---|
| 1 | Visitor lands on /pricing |
| 2 | Visitor lands on /signup |
| 3 | Visitor submits the signup form |
| 4 | Visitor reaches /dashboard/welcome (account created) |
SourceLoop counts every unique visitor who matches step 1, then checks how many of them also matched step 2, then step 3, then step 4, in order. The numbers fall as you go down the steps. That falloff is the drop-off, and the percentage who reach the final step is the conversion rate.
What you’ll get from a funnel
In one screen:
- Conversion rate from step 1 to the final step, the headline metric
- Per-step drop-off counts and percentages, the diagnostic detail
- Median time from step 1 to each subsequent step (how long does each transition take?)
- A visual chart showing the funnel collapsing from step to step
- A breakdown by channel, source, country, device, etc., so you can see which segments convert better
- Period-over-period comparison, did this funnel improve or regress since last quarter?
Funnels are the right tool when:
- You suspect a specific step in your conversion journey is leaking, but you don’t know where
- You ran an A/B test on a step and want to measure its impact end-to-end
- You’re trying to compare conversion rates across channels for the same journey
- You need to show stakeholders a clear before/after when you changed a landing page or form
Step 1: Build a funnel
- Sign in to SourceLoop.
- Click Funnels in the left sidebar.
- Click New funnel at the bottom of the funnels list, or Create your first funnel if you have none yet.
The Create funnel drawer opens with four numbered sections.
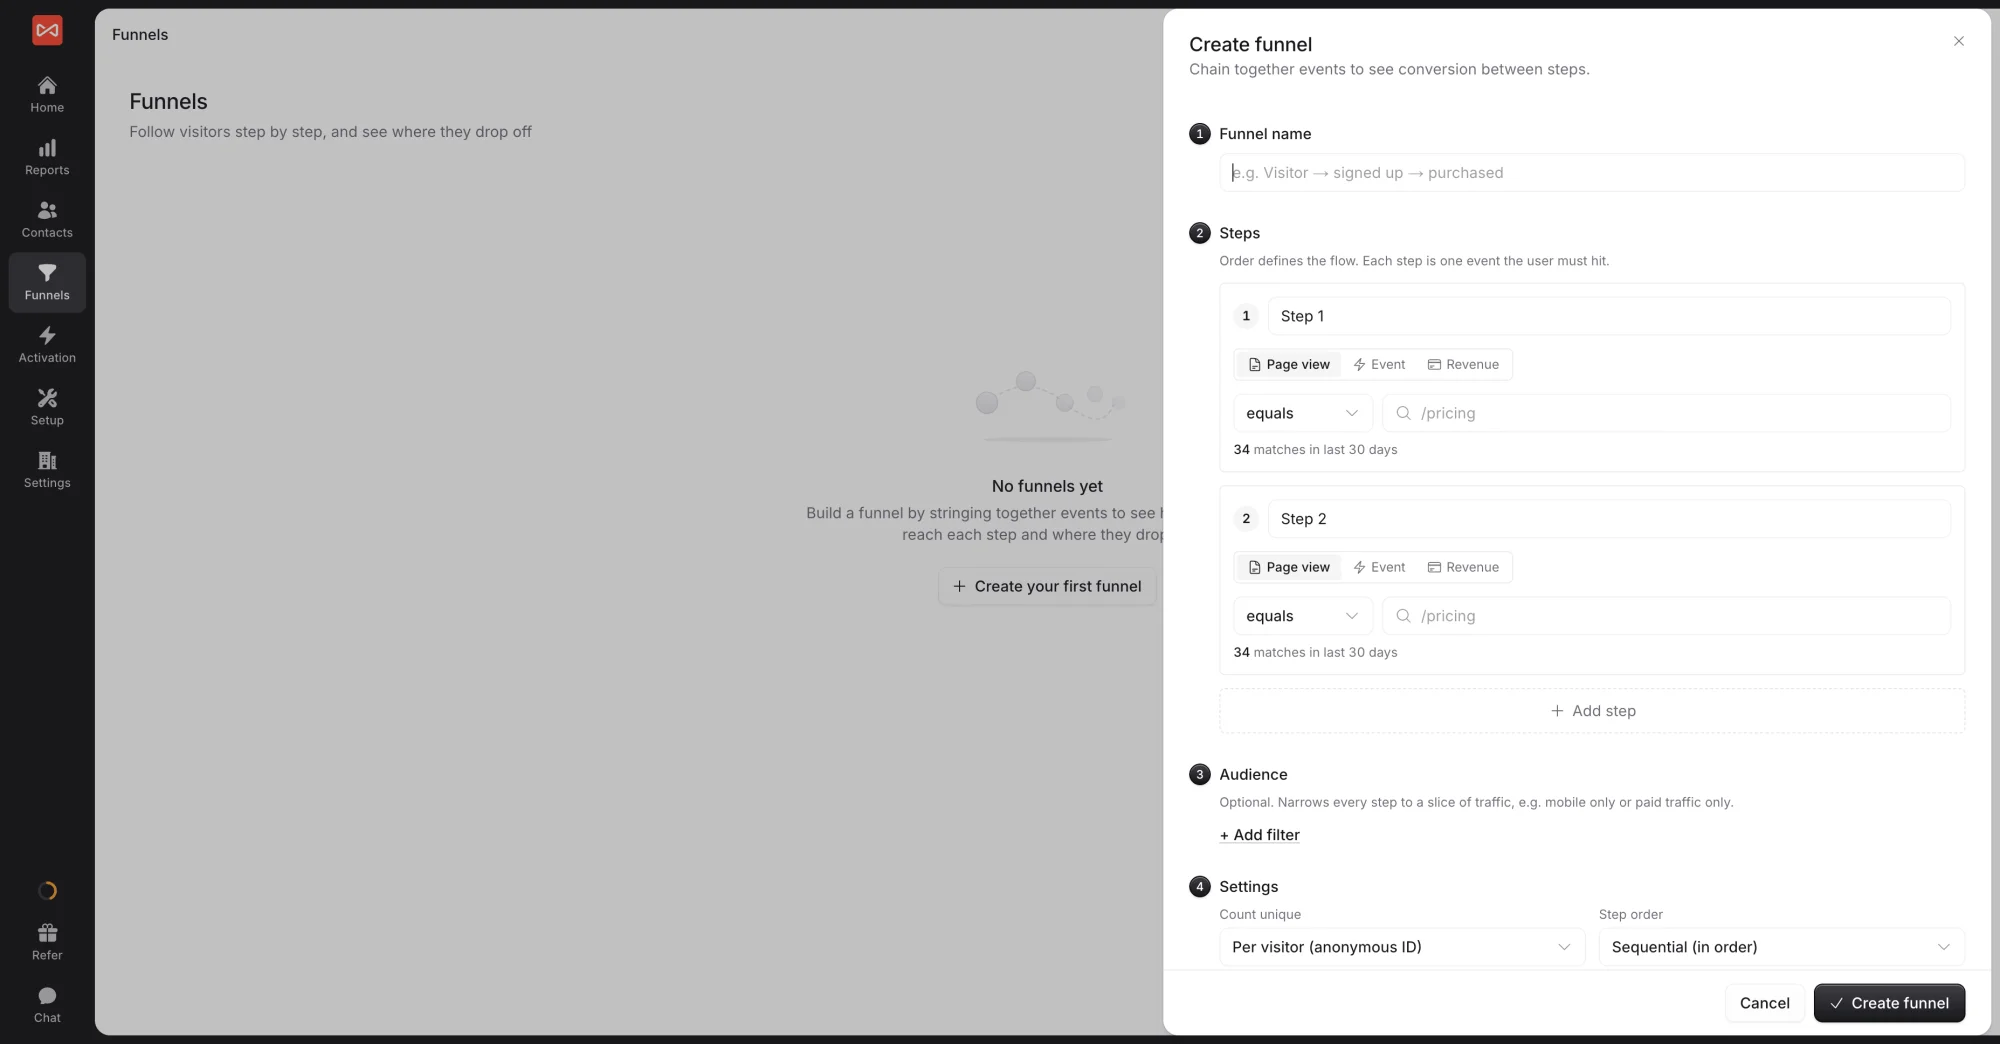
Section 1: Name the funnel
Give it a name you’ll recognise in the list, such as “Pricing → Signup → Activated” or “Demo request to closed-won”.
Section 2: Add the steps
Each step is one thing the visitor must do. There are three kinds:
| Step type | Matches | Example |
|---|---|---|
| Page view | A page or pattern on your site | /pricing or /blog/* |
| Event | An event your site sends, optionally narrowed to one element | form_submitted, or a click on “Start now” |
| Revenue | A payment or subscription event from your billing tool | Trial started, Subscription started, Trial converted to paid |
For each step, pick the type, the match (such as equals, starts with, or contains), and the value, and give it a friendly name if you like. Mark a step as Optional step when people can skip it.
Section 3: Choose an audience (optional)
Click Add filter to narrow every step to a slice of traffic, such as mobile visitors only or paid traffic only.
Section 4: Configure the settings
| Setting | Options | When to change |
|---|---|---|
| Count unique | Per visitor (anonymous ID), Per session, Per identified user | Per session when the funnel should be completed in one visit. Per identified user to follow people after they sign in or fill a form. |
| Step order | Sequential (in order), Any order | Any order when the steps don’t have to happen in a set order. |
| Conversion window | Empty for no limit, or a number of days, under Advanced options | Set it to require completion within, say, 7 days. |
Click Create funnel. SourceLoop computes it against your existing data straight away.
Step 2: Read the Overview report
Open a funnel from the list on the left and you land on the Overview tab. Set the date range and, if you want, a comparison at the top right.
The chart
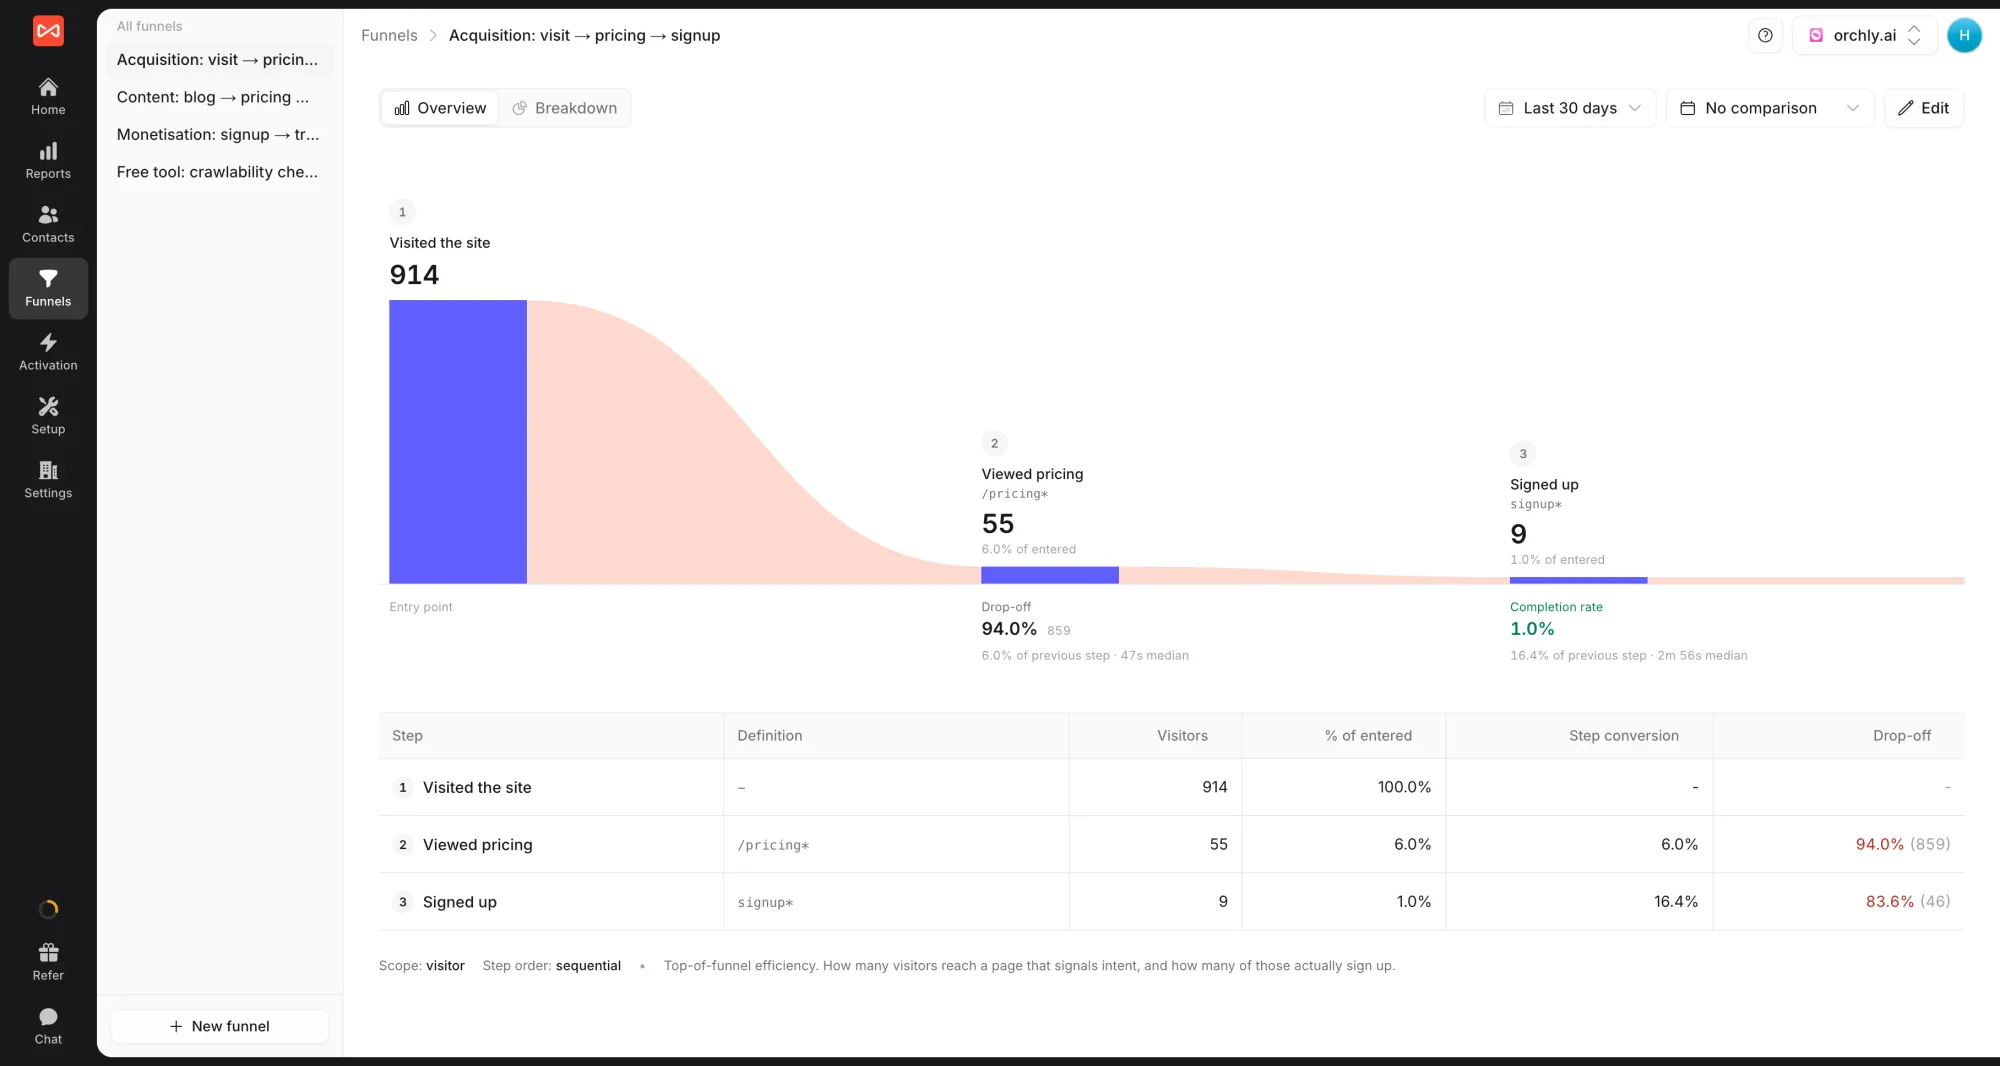
Each step shows how many visitors reached it and their share of everyone who entered. The shaded band between steps shows who dropped off, with the drop-off rate, the step conversion from the previous step, and the median time it took. The first step is the Entry point and the last shows the Completion rate.
The step table
| Column | What it shows |
|---|---|
| Step | Step name and position |
| Definition | The condition, such as a URL pattern or event name |
| Visitors | How many reached this step |
| % of entered | Share of everyone who reached the first step |
| Step conversion | Share of the previous step who reached this one |
| Drop-off | Share and number who left at this step |
The biggest drop-off is usually your weakest step and the best place to start improving.
Step 3: Compare two periods
Use the comparison menu next to the date range to put the same funnel against an earlier period: vs previous period, vs 30 days earlier, or vs a year earlier. Each step then shows its change, so you can see whether last month’s changes improved conversion.
What to look for:
- Completion rate up or down: the headline answer
- Per-step shifts: a step that improved can hide one that got worse
- Entry volume: a higher completion rate sometimes means better-qualified traffic rather than a better funnel
Step 4: Break the funnel down by dimension
The Breakdown tab is the most powerful view for diagnosis. It splits the funnel by a dimension you pick, channel, source, country, device, browser, etc., so you can see how conversion differs across segments.
- Click the Breakdown tab.
- Pick a dimension: traffic source (channel, source, medium, campaign, referrer), location (country, region, city), device (device type, browser, operating system), or site (hostname).
- Pick an attribution model from the model selector. The default is the workspace default (usually Last Non-Direct, matching Google Analytics).
- SourceLoop shows a table with one row per dimension value (e.g., one row per channel), each with Entered, Completed, and Conv. rate columns.
Useful patterns:
- Channel with low Entered but high Conv. rate → small but efficient channel; consider investing more there
- Channel with high Entered but low Conv. rate → high traffic, weak fit; tighten targeting or the landing page
- Mobile rate meaningfully lower than Desktop on the same funnel → your mobile experience has friction; usually fixable with form simplification
- Conv. rate variation by country → either targeting issues, or localisation opportunities
Multi-model attribution in Breakdown
The Breakdown tab supports SourceLoop’s full set of attribution models. You can stack multiple models in the same view, so a single table can show Last Touch conversions alongside First Touch conversions alongside Linear conversions for the same channels in the same funnel.
The gap between Last Touch and First Touch credit for a channel = its assist value within this funnel. Useful for justifying top-of-funnel investment when defending budget. For more on the seven models, see 7 Types of Attribution Models.
Step 5: Manage funnels
The Funnels list page shows every funnel for the current website, with summary stats (Entered / Completed / Conv. rate) for the default date range.
For each funnel, the menu at the end of its row offers:
| Action | What it does |
|---|---|
| Edit | Reopens the builder to change steps, name, audience, or settings |
| Delete | Removes the funnel for good, with no undo |
You can also click Edit at the top right of an open funnel.
Common funnel patterns
A few funnels worth setting up early in your workspace:
| Funnel | Steps |
|---|---|
| Lead capture funnel | Lands on /pricing → Lands on /signup → Submits signup form |
| Demo to closed-won | Submits demo form → Books meeting → Converts to paid |
| Blog to subscriber | Lands on /blog/* → Submits newsletter form |
| Trial activation | Signup completed → Lands on /dashboard/onboarding → Lands on /dashboard/(any feature) |
| Checkout funnel (ecommerce) | Lands on product page → Adds to cart → Reaches checkout → Payment complete |
Once a funnel is set up, it computes against historical data automatically, so you can immediately see the last 30, 60, or 90 days of progression.
Counting, order, and conversion window in detail
These three settings often confuse first-time funnel users. A quick reference:
Count unique
| Count unique | Counts | When to use |
|---|---|---|
| Per visitor | Unique anonymous IDs (the default) | Almost always; tracks the same person across sessions even before they identify themselves |
| Per session | Unique session IDs | When you want to measure a single-visit completion, e.g., “do they finish checkout without leaving?” |
| Per identified user | Unique user IDs (after identify call) | When tracking post-signup behaviour (in-product funnels) |
Step order
| Order mode | Behaviour | When to use |
|---|---|---|
| Sequential | Steps must occur in temporal order (the default) | Standard linear funnels: pricing → signup → activation |
| Any order | Steps can occur in any order, but all must occur within the window | Research funnels where order doesn’t matter; e.g., visit pricing + visit features + book demo, in any sequence |
Conversion window
| Setting | Behaviour |
|---|---|
| None (default) | No time limit, the funnel counts completions within the report’s date range |
| N days | Enforces that the visitor completes all steps within N days of step 1 |
A typical pattern: set a 7-day window for trial activation funnels (the visitor needs to activate within the trial period) but leave it unbounded for B2B sales funnels that span months.
What’s next
- Pick the right attribution model for the Breakdown tab: 7 Types of Attribution Models
- See channel-level traffic data: Traffic and Revenue report
- See landing-page-level data: Content report
- See the literal sequence of channels converters went through (instead of conditions you defined): Paths report
Frequently asked questions
-
How is a funnel different from the Traffic or Content dashboards?
The dashboards summarise what happened, visits, conversions, revenue grouped by channel or page. A funnel measures progression, did the same visitor go from step A to step B to step C, in order, and where did they drop out. Use the dashboards to track totals; use funnels to find the specific step where your conversion journey is leaking.
-
How many steps can a funnel have?
Between 2 and 10. Two is the minimum (you need an entry and a goal). Ten is the maximum SourceLoop supports per funnel. Most useful funnels have 3-5 steps, more than that and drop-off rates become hard to interpret because the cumulative loss compounds.
-
What counts as a step?
A page view or a custom event. For pageviews, you can match by URL with operators like equals, starts_with, or contains, so /pricing matches just the pricing page, while /blog/* matches every blog post. For custom events, you match by the event name your tracking pixel fires (form submitted, signup completed, etc.).
-
Does the funnel respect the global attribution model?
On the Breakdown tab, yes. You can pick which attribution model gets applied when breaking the funnel down by channel, source, medium, country, device, or browser, including multi-touch models like Linear, Position-Based, and Time Decay. The Overview tab uses a literal raw count of who reached each step, no attribution model needed there.
-
What's the conversion window?
An optional time limit between step 1 and the final step. If you set a 7-day window, only visitors who completed all steps within 7 days of their first step are counted as converted. If you leave it empty, there's no time limit, the funnel just looks across whatever date range you've picked at the top.
-
Can I share a funnel with my team?
Funnels are scoped to your website (or workspace), so every teammate with access to the website automatically sees and can edit the same funnels. There's no separate "share link", anyone on the team can open the funnel by name from the funnels list.
-
What happens to my data if I delete a funnel?
Deleting removes the funnel definition for good, but never touches the underlying visit and conversion data, so you can rebuild the same funnel later and get the same numbers.
-
Why are the Linear or Time-Decay credits showing fractional visitor counts in the Breakdown tab?
Because multi-touch attribution models split credit across all touches in the journey. If a visitor's path was social → email → search before completing the funnel, Linear gives each channel 0.33 of a visitor instead of 1.0 to the last channel. The fractional counts are real and add up correctly; they just look unusual at first glance.

 Paid Social


