How to Use the SourceLoop Contacts (Leads) Table
The Contacts table, one row per identified lead with first-touch and last-touch attribution, lifecycle status, revenue, and the full visitor journey.
On this page
- What the Contacts table answers
- Step 1: Pick your date range and filters
- Step 2: Read the row
- Step 3: Read the attribution columns
- Step 4: Read the contact and technical columns
- Step 5: Show / hide columns and save the view
- Step 6: Open the lead drawer for the full journey
- Step 7: Export to CSV
- What’s next
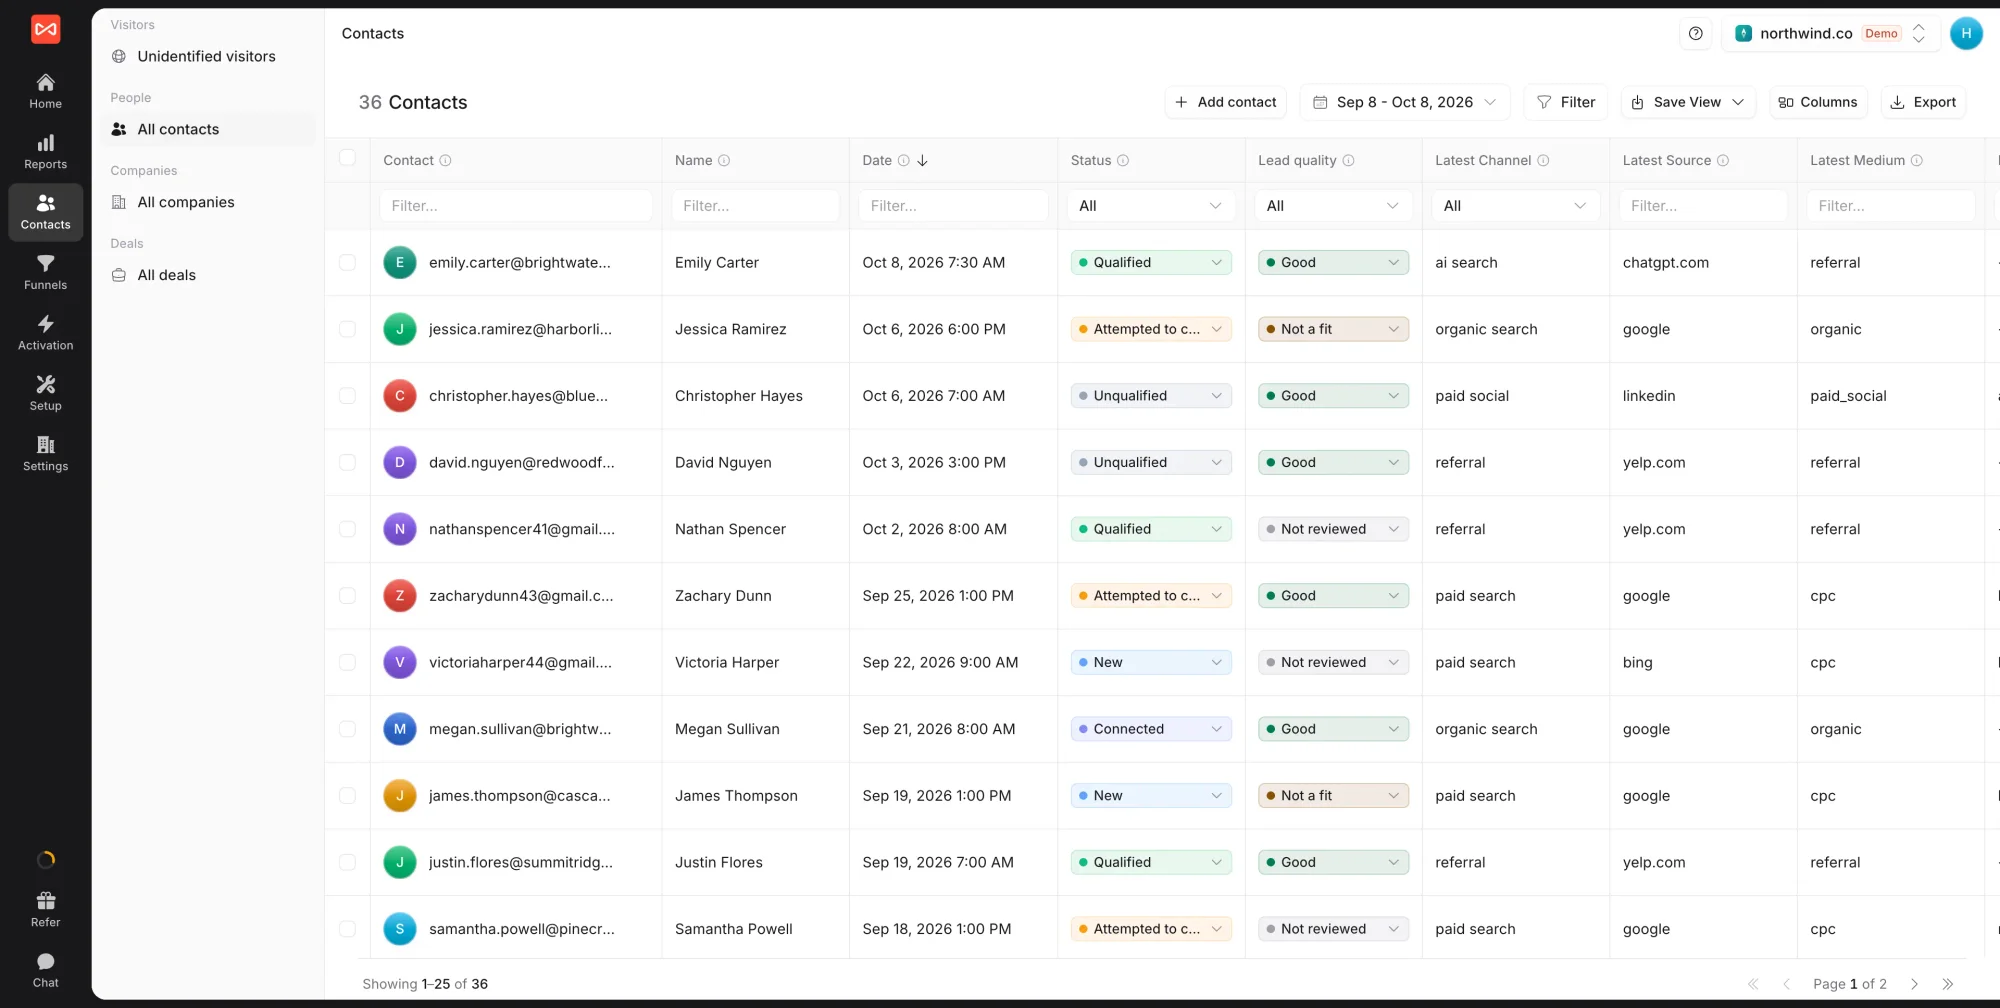
The Contacts table is the row-per-lead view in SourceLoop. Every identified contact, anyone who left an email, phone number, or other handle through a form, meeting, chat, or payment, gets one row. The table shows who they are, what brought them in, what they’re worth, and how to drill into their full journey.
It lives at Contacts in the left sidebar. The same page also has a Visitors view for anonymous browsers who never converted.
What the Contacts table answers
In one screen:
- Who has converted recently, with full contact details
- What channel, source, campaign, and landing page brought each lead in (both first and last touch)
- Where each lead is in your sales lifecycle (Status + Qualified flag)
- What each lead is worth (Expected Revenue, Revenue, Lead Score)
- What the full journey looked like before they converted
If the Traffic dashboard is “what channels are working”, the Contacts table is “show me the actual people each channel produced”.
Step 1: Pick your date range and filters
The page-level controls at the top:
- Date range — defaults to the last 30 days
- Saved view (left sidebar) — load a previously saved combination of filters, sort, and visible columns
- Column filters (under each header) — quick text or dropdown filter per column
- Advanced filter — build multi-condition filters across any columns (e.g., “Channel = Paid Search AND Country = US AND Revenue > 0”)
The filter bar is sticky. Add filters and the table re-queries in real time.
Step 2: Read the row
Each row is one lead. The most useful default columns:
| Column | What it shows |
|---|---|
| Contact | Email or phone, with an avatar initial. The pinned identity column. |
| Name | Lead’s name if the conversion source included one. Blank if not. |
| Date | When the lead converted. Click to edit. |
| Type | What kind of conversion: Web Form, Meeting, Chat, Payment, Subscription, API, CRM Import, or Custom. |
| Status | Lifecycle stage (New, Contacted, In Progress, Converted, Lost). Configurable per workspace. |
| Qualified | Yes / No / Not Set flag for sales qualification. |
| Lead Score | Numeric score your team or workflow assigns. |
| Expected Revenue | The forecasted deal value (quote). |
| Revenue | The realised deal value (closed-won amount). |
All of these are click-to-edit inline; no separate edit mode.
Step 3: Read the attribution columns
Two parallel sets of attribution columns, one for the lead’s first touch (how they originally found you) and one for the last touch (the session in which they converted):
| First touch | Last touch | Meaning |
|---|---|---|
| First Channel | Latest Channel | High-level bucket (Paid Search, Organic Social, Direct, etc.) |
| First Source | Latest Source | The utm_source value (google, linkedin, twitter, etc.) |
| First Medium | Latest Medium | The utm_medium value (cpc, organic, social, email) |
| First Campaign | Latest Campaign | The utm_campaign value |
| First Keyword | Latest Keyword | Search term that landed them on the page |
| First Content | Latest Content | The utm_content value |
| First Landing Page | Latest Landing Page | URL they first arrived on / converted on |
| First Landing Page Folder | Latest Landing Page Folder | The URL folder of either |
Plus, both first and last touch carry the click IDs for each ad platform: Google (gclid, gbraid, wbraid), Microsoft (msclkid), Facebook (fbclid), and LinkedIn (li_fat_id). Those are useful for debugging mismatches between SourceLoop attribution and the ad platforms’ own reporting.
Step 4: Read the contact and technical columns
| Column | What it shows |
|---|---|
| Company | Company name if captured (calendar bookings often include this) |
| Phone | Phone number if captured |
| Country | Country derived from the converting session’s IP |
| City | City derived from the same |
| Browser | Browser used at the converting session |
| Device Type | Desktop, Mobile, or Tablet |
| OS | Operating system |
And two flags:
- Is Spam — manual toggle for cleaning up junk submissions
- Is Duplicate — manual toggle when the same person appears twice
Plus Notes (free text), First Seen (read-only), and Last Seen (read-only).
Step 5: Show / hide columns and save the view
That’s a lot of columns. Most teams don’t need all of them visible at once.
- Click the Column visibility menu (right of the table header).
- Toggle columns on or off. The list has a search box; type “click” to surface just the click ID columns, etc.
- Click Save view to keep this column layout (plus current filters and sort) as a named view. It appears in the left sidebar for one-click recall.
Useful preset views to create:
- Sales pipeline — visible: Contact, Status, Qualified, Expected Revenue, Latest Channel; sorted by Date desc.
- Paid Search performance — filter Latest Channel = Paid Search; visible: Contact, Latest Campaign, Latest Keyword, Revenue.
- High-value leads — filter Lead Score > 50; visible: Contact, Status, Expected Revenue, Latest Channel.
Step 6: Open the lead drawer for the full journey
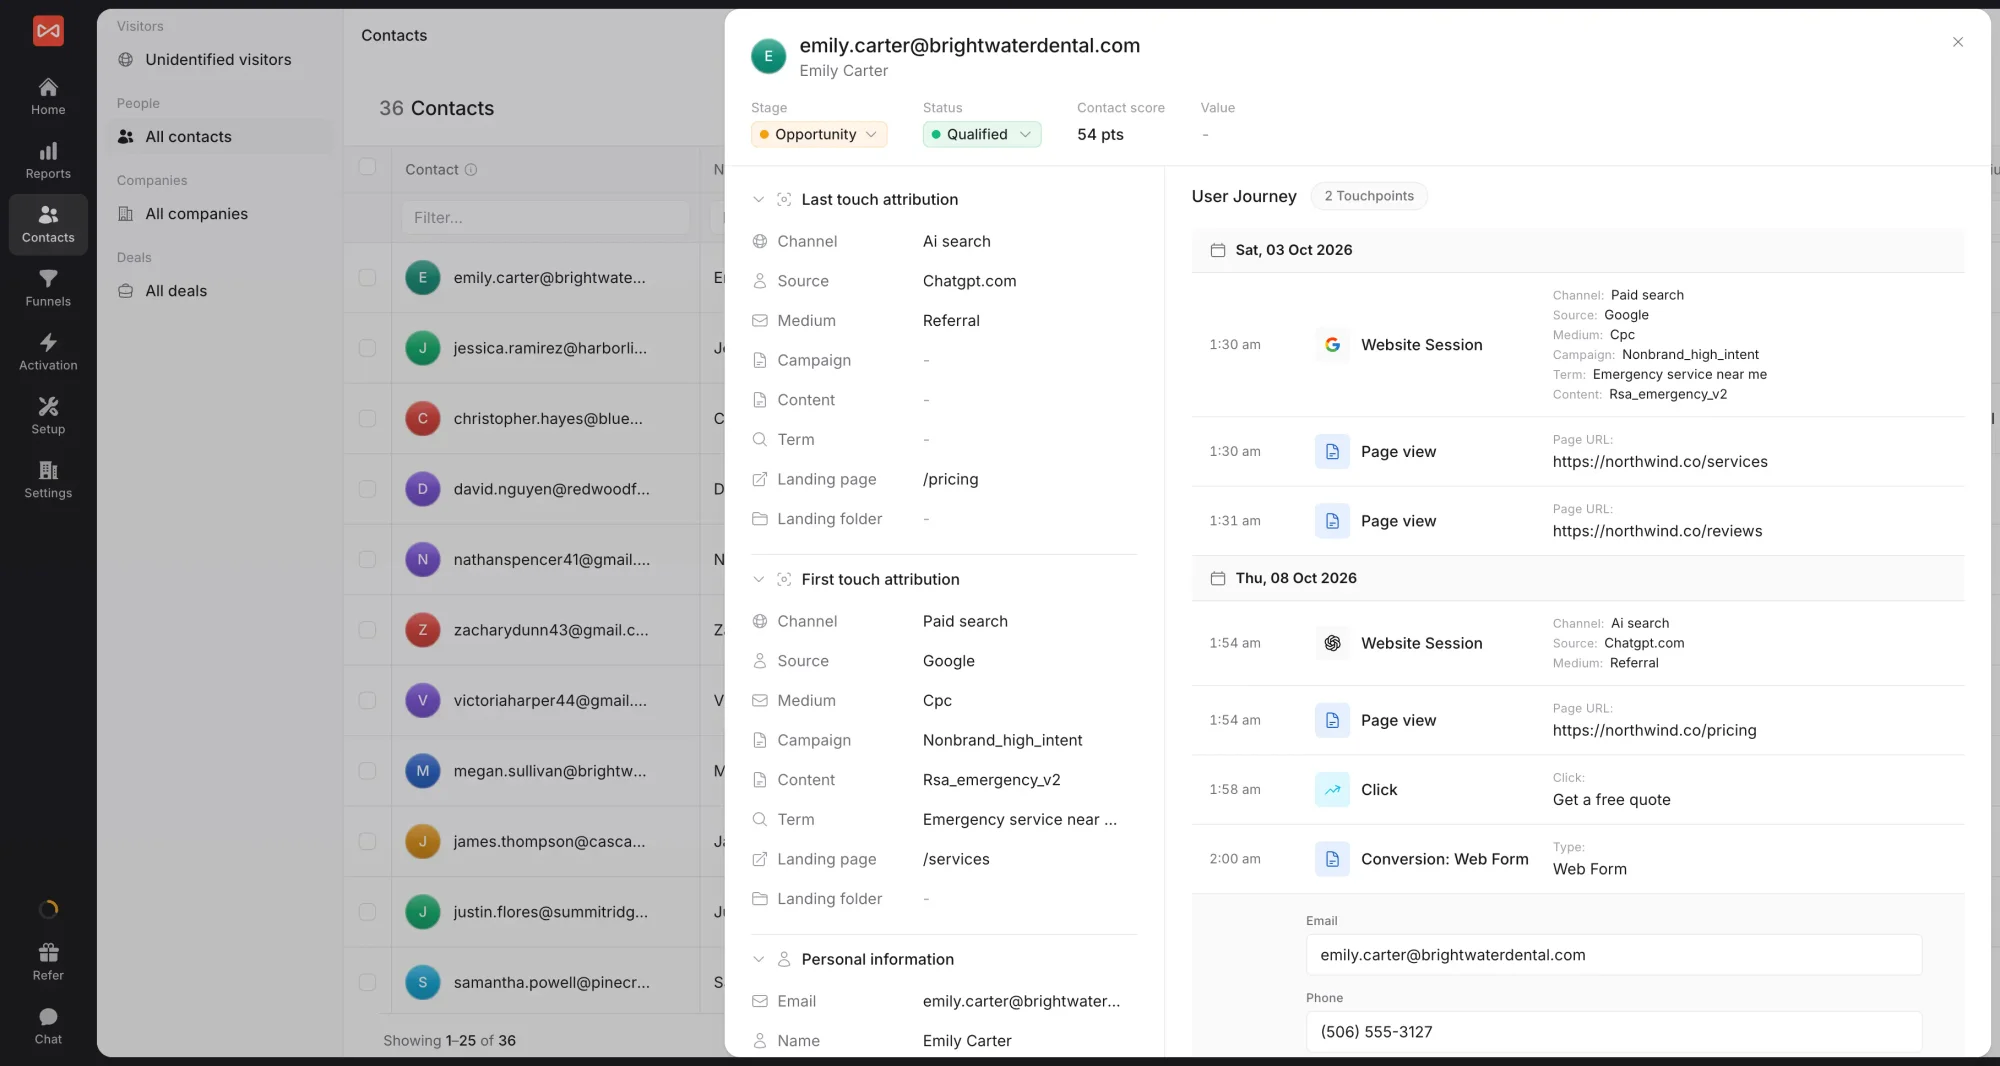
Click any row. The right-side lead drawer opens with the lead’s full pre-conversion journey.
The drawer has two sides:
Left side, expandable accordions for the lead’s metadata:
- Last Touch Attribution — channel, source, medium, campaign, keyword, content, landing page (clickable to open in a new tab)
- First Touch Attribution — same fields, for the original touch
- Personal Information — email, name, company, phone, country, city (all inline editable)
- Technical Information — browser, device, OS
- Additional Information — date, mark as spam, mark as duplicate
Right side, a vertical timeline of every event leading to the conversion:
- The conversion event at the top (form submission, meeting booking, payment, etc.) with every field captured
- Every session the lead had on your site, expanded into the individual events: page views, ad clicks, custom events, form interactions, video plays, scroll milestones, etc.
- Each event timestamped, with the page URL or event metadata inline
Click any event to expand details below. The timeline is the single most useful artifact in SourceLoop for understanding “why did this lead convert from this campaign?”
Step 7: Export to CSV
Top-right of the table, Export. The CSV download includes every visible column for every row matching the current filters, with attribution flattened into row-per-lead format.
Typical exports:
- Sales handoff — filter to recent qualified leads, export with contact details and Latest Channel / Campaign for sales follow-up
- ROAS analysis — filter to a date range, export with Revenue, First Channel, and Latest Channel; analyse in your spreadsheet of choice
- CRM backfill — export historical leads with their attribution for backfilling a new CRM
What’s next
- Browse anonymous visitors who haven’t converted yet: Anonymous visitors view
- Compare how attribution credit shifts across models: 7 Types of Attribution Models
- Slice the same data by channel rather than per-lead: Traffic dashboard
- See pre-conversion page patterns in aggregate: Paths dashboard
Frequently asked questions
-
What's the difference between the Leads table and the Visitors table?
The Leads table shows identified contacts, anyone who left an email, phone number, or other identifying detail through a form, meeting booking, chat, or payment. The Visitors table shows anonymous browsers who came to the site but never converted. Same underlying journey data, just split by whether SourceLoop has a contact handle yet.
-
How do I save a filter I use often?
Set your filters, sort, and visible columns the way you want them, then click the Save view button. Give it a name (e.g., "Hot leads this week" or "Paid Search demos"). Saved views appear in the left sidebar, one click to load them later. Each user has their own views.
-
Can I export the table to CSV?
Yes. Click the Export button top-right. The CSV includes every visible column for every row that matches your current filters, with attribution and journey data flattened into row-per-lead format. Useful for handing off to sales ops, importing into spreadsheets, or backfilling another tool.
-
Can I edit a lead's status, score, or revenue inline?
Yes. Click any editable cell (Status, Qualified, Lead Score, Expected Revenue, Revenue, Notes, Is Spam, Is Duplicate) and edit in place. The change saves automatically and propagates to any CRM you've connected within minutes.
-
What does the Qualified column mean?
A simple Yes / No / Not Set flag your team can use to mark whether a lead is sales-qualified. It's not auto-calculated, you set it manually (or via API). The Status column is the longer lifecycle stage (New, Contacted, In Progress, Converted, Lost); Qualified is the binary "should sales chase this?" flag.
-
Why are some lead names blank?
Because the conversion source didn't include a name field. Calendar bookings always include a name; web forms only do if you have a Name field on the form. The Contact column always falls back to the email or phone number so you can still identify the lead.
-
How do I open a lead's full journey?
Click any row in the table. The right-side drawer opens with the lead's entire pre-conversion journey, every page they viewed, every ad they clicked, every form attempt, every session, in reverse chronological order. The drawer is where most of the attribution story lives.