
How to Measure Customer Lifetime Value by Marketing Channel
Measure customer lifetime value (LTV) by acquisition channel and campaign, see how long each channel takes to pay back its cost, and compare monthly revenue cohorts.
On this page
Customer lifetime value by channel is the number that settles budget arguments. A channel that wins cheap first purchases can still lose money, and a channel with an expensive first sale can be your best one by the second year. The Lifetime value report follows the customers each channel brought in and adds up everything they have paid since.
Open Reports in the left sidebar, then Lifetime value under Revenue. It needs a connected payment tool or Shopify store.
How the date range works here
On this report the date range chooses who you are looking at, not which payments count. It opens on the last 12 months, which means “customers who first paid in the last 12 months, and everything they have paid since.” Widen it to look at older customers.
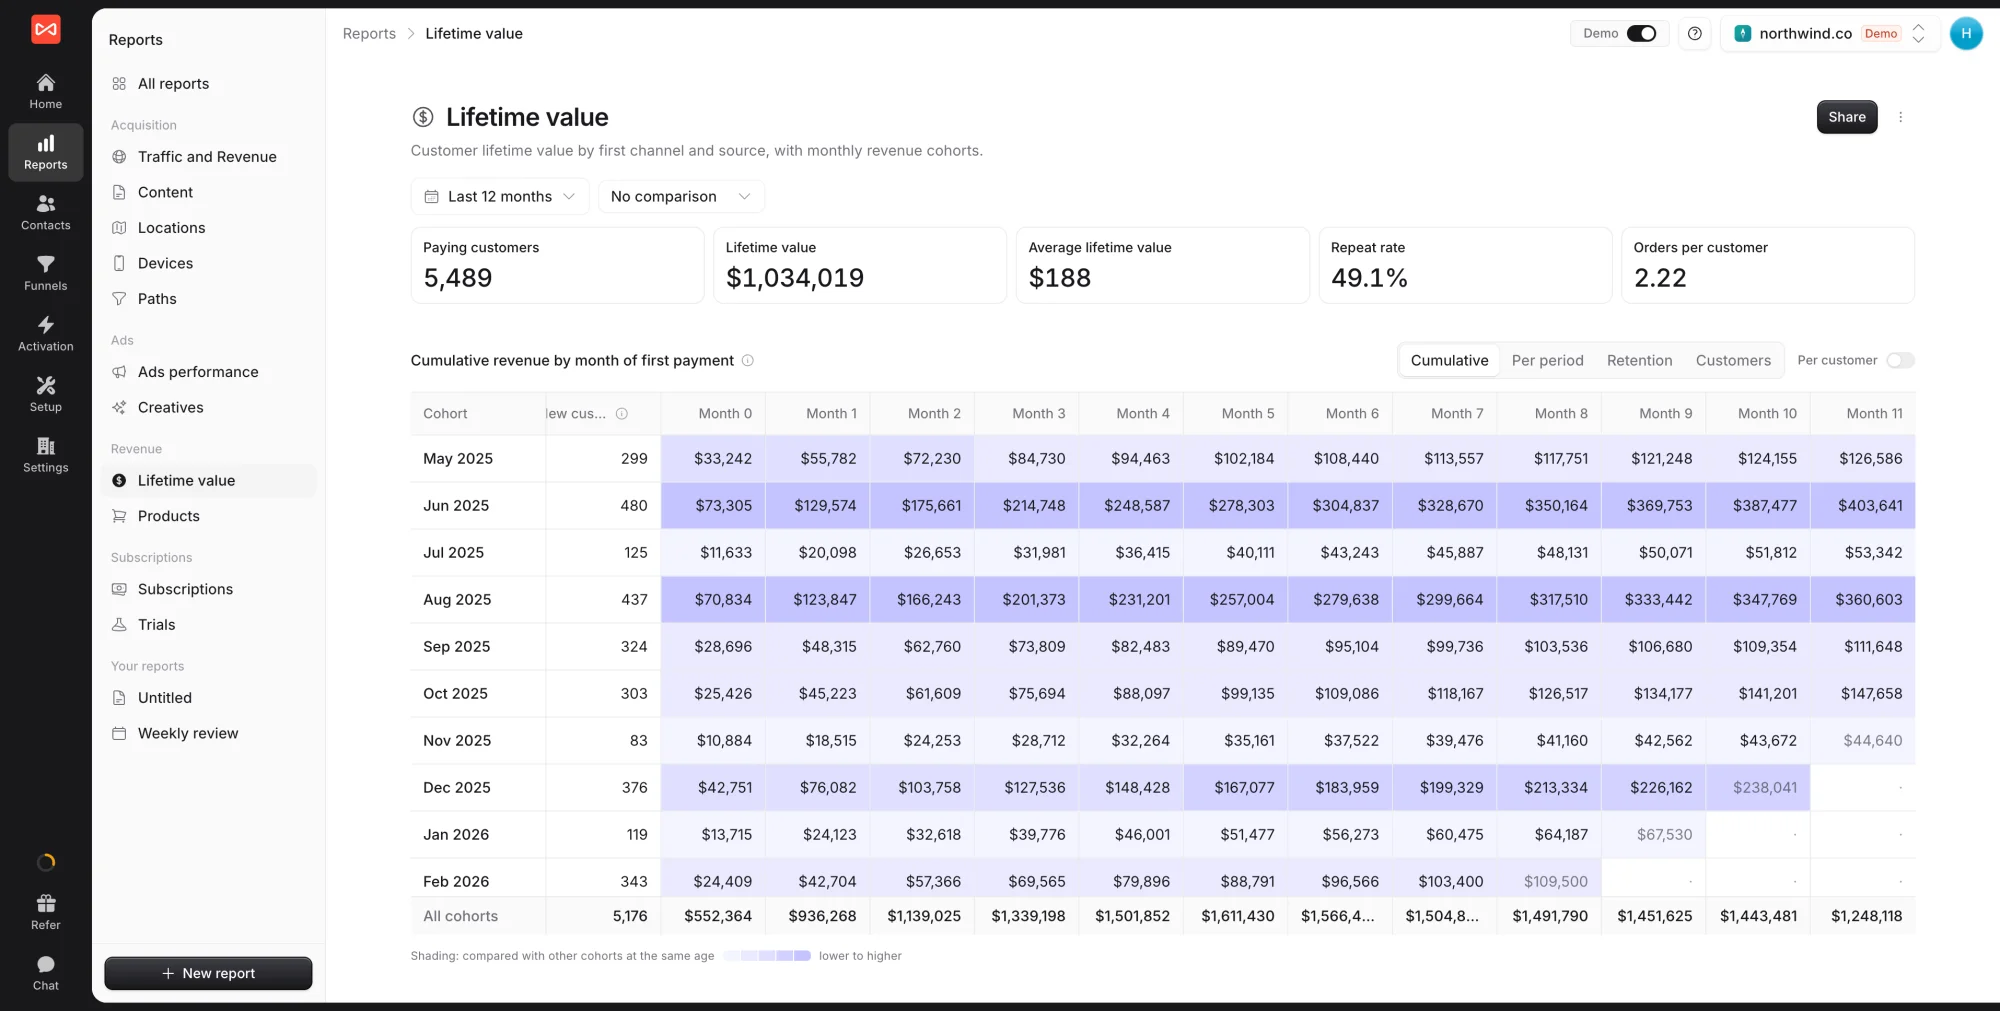
Step 1: Read the headline figures
- Paying customers: people who have paid at least once. Someone who paid three times counts once.
- Lifetime value: the total those customers have paid, including after the period
- Average lifetime value: lifetime value per customer
- Repeat rate: the share of customers who bought more than once. Refunds never count as a second purchase.
- Orders per customer: payments per customer
Step 2: Read the cohort grid
Cumulative revenue by month of first payment groups customers by the month they first paid (rows) and shows what they paid in each month since (columns). Switch the view above it:
- Cumulative: revenue so far, adding up month by month
- Per period: revenue in each month on its own
- Retention: the share of each cohort still paying
- Customers: how many customers each cohort holds
Turn on Per customer to divide every cell by the cohort’s size, which makes a small cohort comparable with a large one. All cohorts at the bottom combines every row, weighted by size, and cells for months that haven’t happened yet stay blank. Darker shading means higher than other cohorts at the same age.
Step 3: Compare channels by lifetime value
Lifetime value by channel lists the headline figures for every channel, plus MRR from acquired customers, the recurring revenue those customers still pay today. Tabs switch to source, medium, campaign, referrer, landing page, or country.
Each customer counts once, under the first touch behind their first payment. Sort by average lifetime value to find the channels whose customers are worth the most, not just the ones that bring the most customers.
Step 4: Check payback by channel
Payback by channel answers “how long until this channel’s customers cover their cost?” For each channel you get:
- Marketing cost in the months its customers were won
- New customers and Cost per customer
- Revenue so far from those customers and the share of the cost Returned
- Paid back in: how many months it took
Payback needs costs to work with. Ad spend comes in from connected ad accounts. Add retainers, fees, and other costs under Setup -> Costs, as explained in the Spend report guide.
What’s next
- Put every marketing cost against leads: Spend report
- Track MRR and churn for subscriptions: Subscriptions report
- See which products customers buy: Products report
Frequently asked questions
-
Does the date range limit which payments count?
No. The date range picks which customers to look at, the ones who first paid in that period. Every payment those customers made afterwards still counts, so lifetime value keeps growing as they keep paying.
-
Which channel gets credit for a customer?
The first touch behind their first payment. Each customer counts once, under the channel, source, or campaign that first brought them to your site, with everything they have paid since.
-
What does "Paid back in 3 months" mean?
The customers a channel won in a month took three months, counting the month of their first payment, to pay back what that channel cost in that month.
-
Why is the bottom-right of the cohort grid empty?
Those cells are periods that have not happened yet. A cohort from last month only has one month of history, so its later columns stay blank instead of showing zero.
-
What do I need connected for this report?
A payment tool such as Stripe, Paddle, Polar, Lemon Squeezy, or Dodo Payments, or a Shopify store. The payback views also need ad spend or costs, from a connected ad account or Setup -> Costs.

 Paid Social


