
How to Export Marketing Reports to PDF and PowerPoint
Turn any marketing report into a paginated PDF or an editable PowerPoint deck with a cover, contents, and your branding, ready to send to a client.
On this page
Some clients want a link. Others want a file they can forward, print, or drop into their own board deck. Any SourceLoop report exports as a PDF or an editable PowerPoint deck, laid out on real pages with a cover and contents.
Step 1: Open the export preview
- Open the report, pre-built or your own.
- Set the date range and filters you want in the file.
- Click the menu next to Share and choose Export.
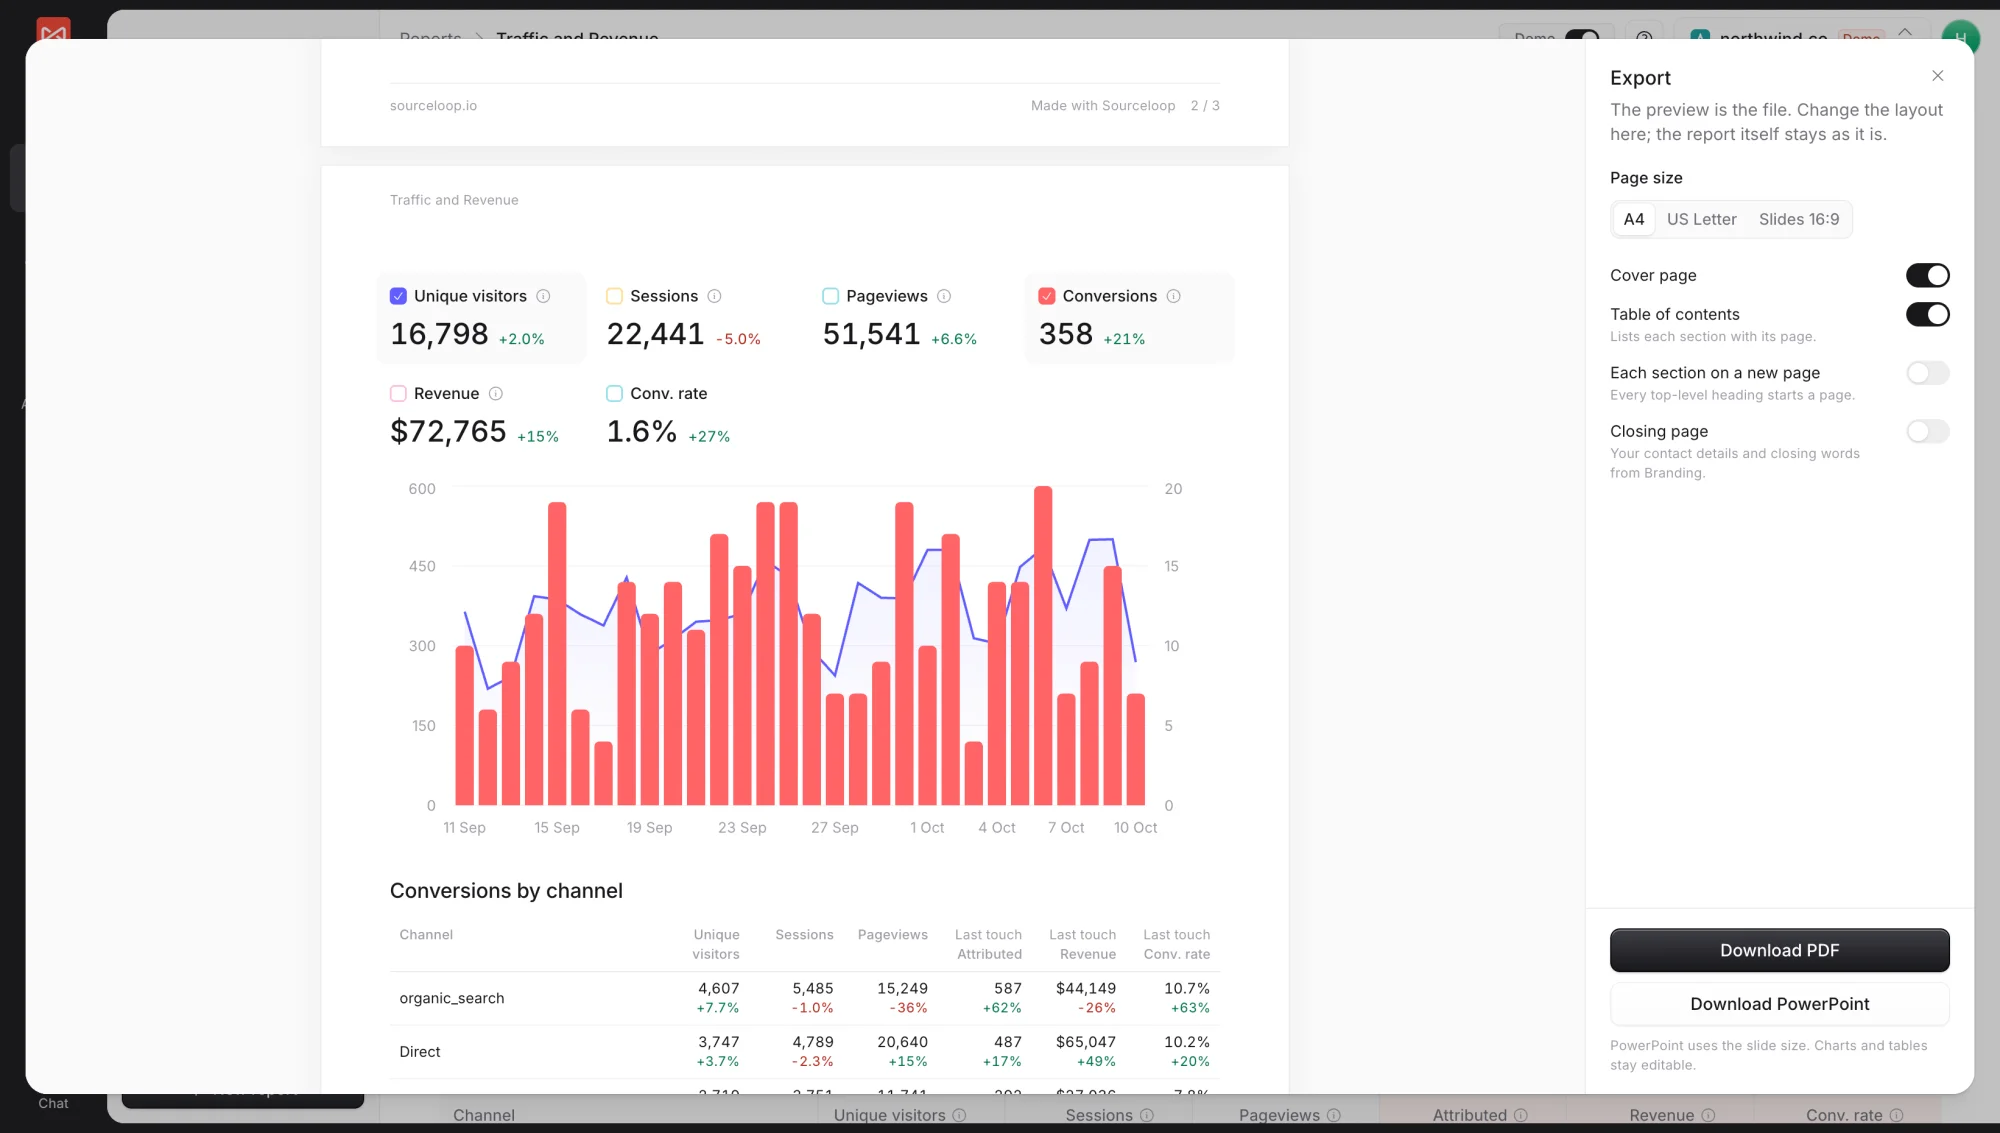
The export dialog shows the report laid out on pages. The preview is the file, so what you see is what you download.
Step 2: Choose the page setup
- Page size: A4, US Letter, or Slides 16:9
- Cover page: a first page with the title and your brand
- Table of contents: lists each section with its page
- Each section on a new page: every top-level heading starts a page
- Closing page: your contact details and closing words from Branding
Changes only affect the file. The report itself stays as it is.
A few layout rules keep exports readable:
- Charts, numbers, and maps never split across pages.
- Tables split between rows, with the header repeated under “Continued”.
- Widgets wider than the page scale down to fit.
- A Page break block in your report forces a new page wherever you put it.
Step 3: Download
- Download PDF for a document to send or print.
- Download PowerPoint for a deck. PowerPoint always uses the slide size, and charts and tables stay editable.
What’s next
- Add your logo, colours, and cover photo: White-label branding
- Send a live link instead: Share a report
- Build a client report to export: Create a custom report
Frequently asked questions
-
Are charts in the PowerPoint editable?
Line, area, bar, combo, and donut charts and tables come through as native PowerPoint charts and tables you can edit. Maps, journey flows, heatmaps, and cohort grids come through as pictures.
-
Why did a chart move to the next page?
Charts, numbers, and maps never split across pages, so one that doesn't fit moves to the next page whole. Long tables split between rows instead, with the header repeated under "Continued".
-
How many table rows are exported?
Up to 50 rows per table. For the full list, use Export above the table in the report to download a CSV.
-
Will my export settings be remembered?
Yes. For a report you built, the page setup is saved with the report. For a pre-built report, it is remembered in your browser.
-
Where do the cover and closing page get their content?
From Settings -> Branding: your logo, colours, cover layout and photo, contact line, and closing words. Without branding, exports use SourceLoop's look.

 Paid Social


